Key Features of Coding Bootcamps KPI Dashboard in Power BI
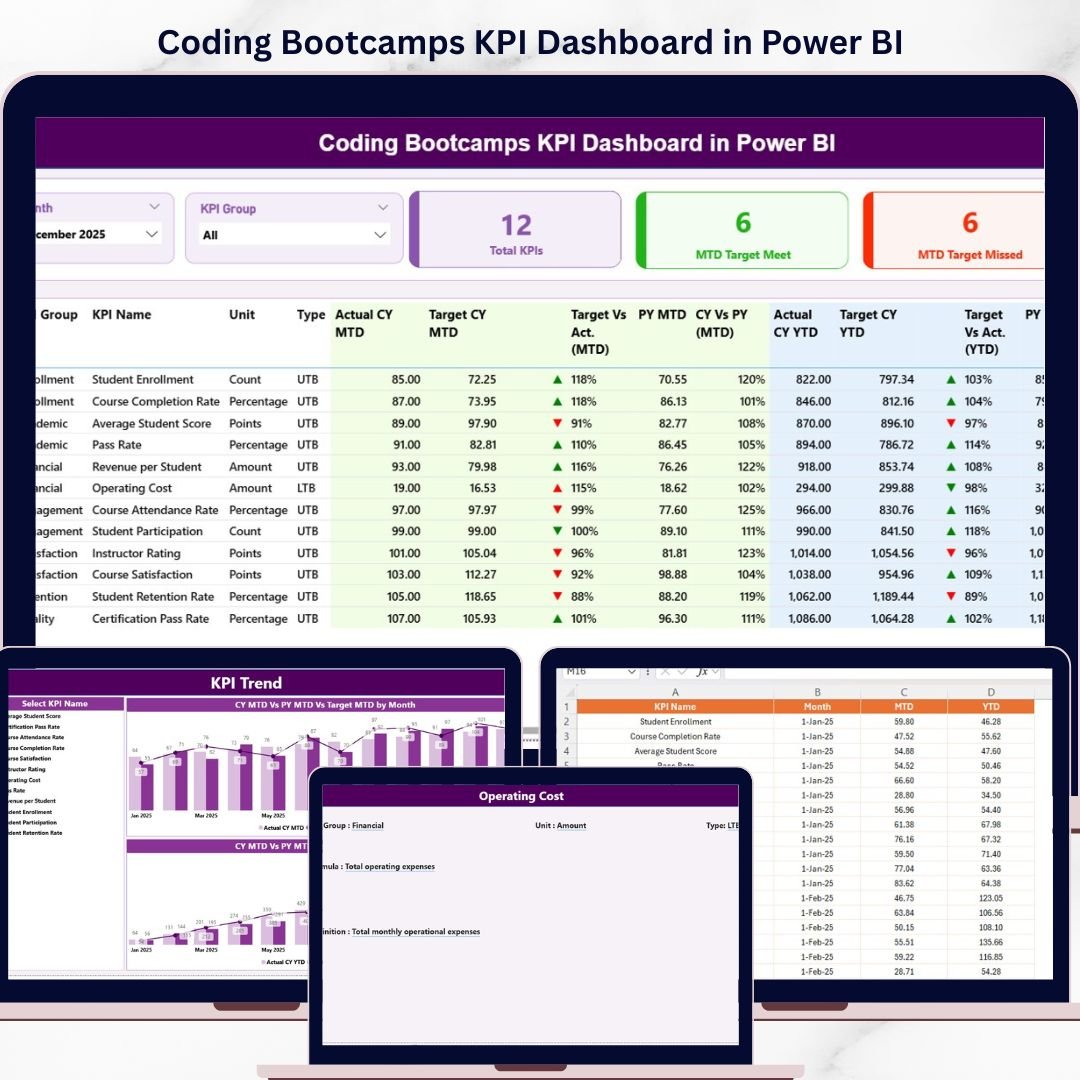
The Coding Bootcamps KPI Dashboard in Power BI is a powerful, ready-to-use digital tool designed to help you effortlessly track and analyze your coding bootcamp’s key performance indicators (KPIs). With three intuitive pages, this dashboard offers a comprehensive view of your KPIs with dynamic visuals and insightful comparisons. Simply update your data in the Excel file, connect it with the Power BI dashboard, and refresh to get real-time insights.
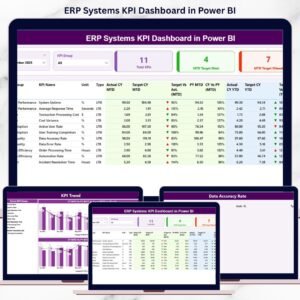
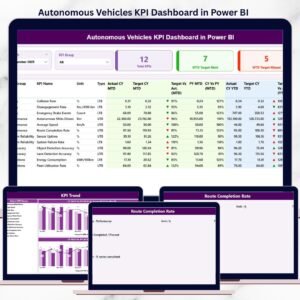
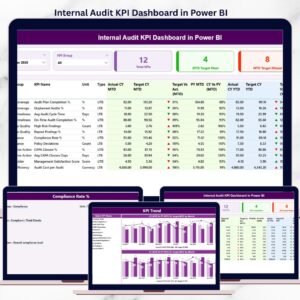
- 📊 Three Interactive Pages: Summary page, KPI Trend page, and KPI Definition page to cover all aspects of KPI monitoring.
- 📅 Dynamic Month & KPI Group Slicers: Filter your data by month and KPI category for targeted analysis.
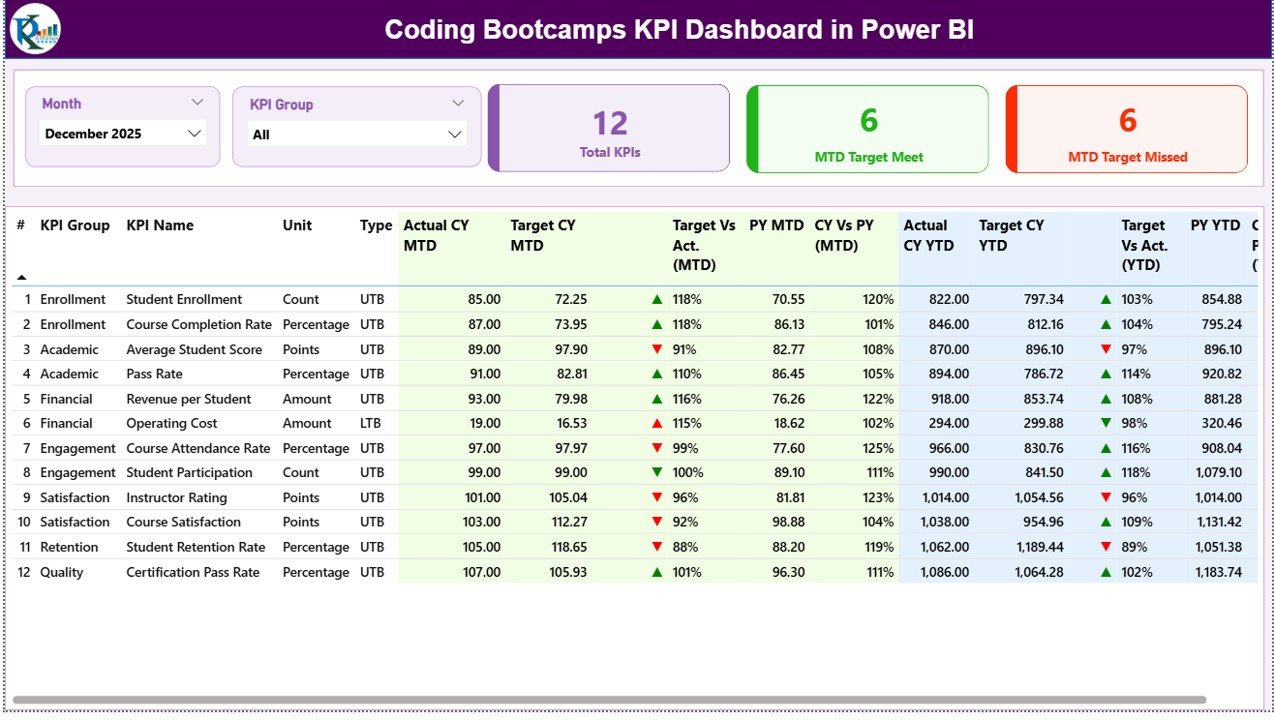
- 🎯 Real-Time KPI Status Indicators: Color-coded icons (green up arrow/red down arrow) display whether KPIs meet or miss targets for MTD and YTD.
- 📈 Detailed KPI Table: Displays KPI Number, Group, Name, Unit, Type (LTB/UTB), Actual vs Target values, and percentage comparisons for both current and previous years.
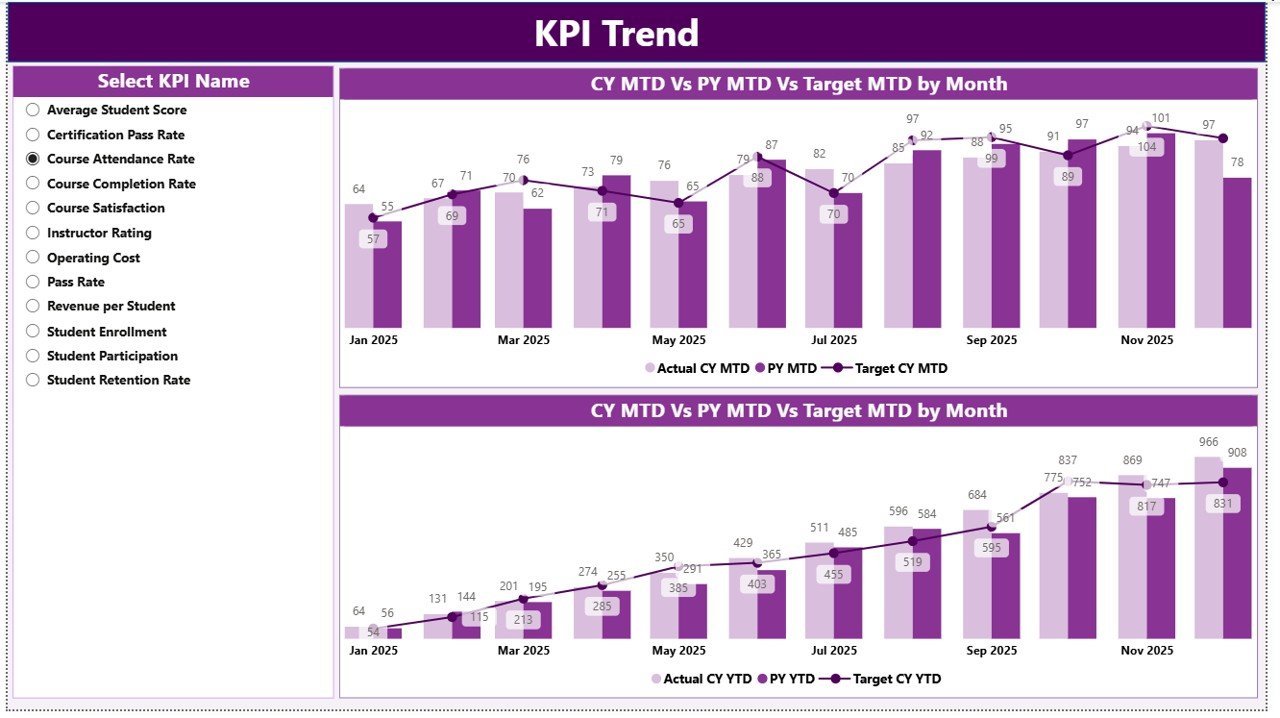
- 📉 Trend Analysis: Combo charts on the KPI Trend page compare actual numbers and targets for current and previous years, providing valuable performance trends.
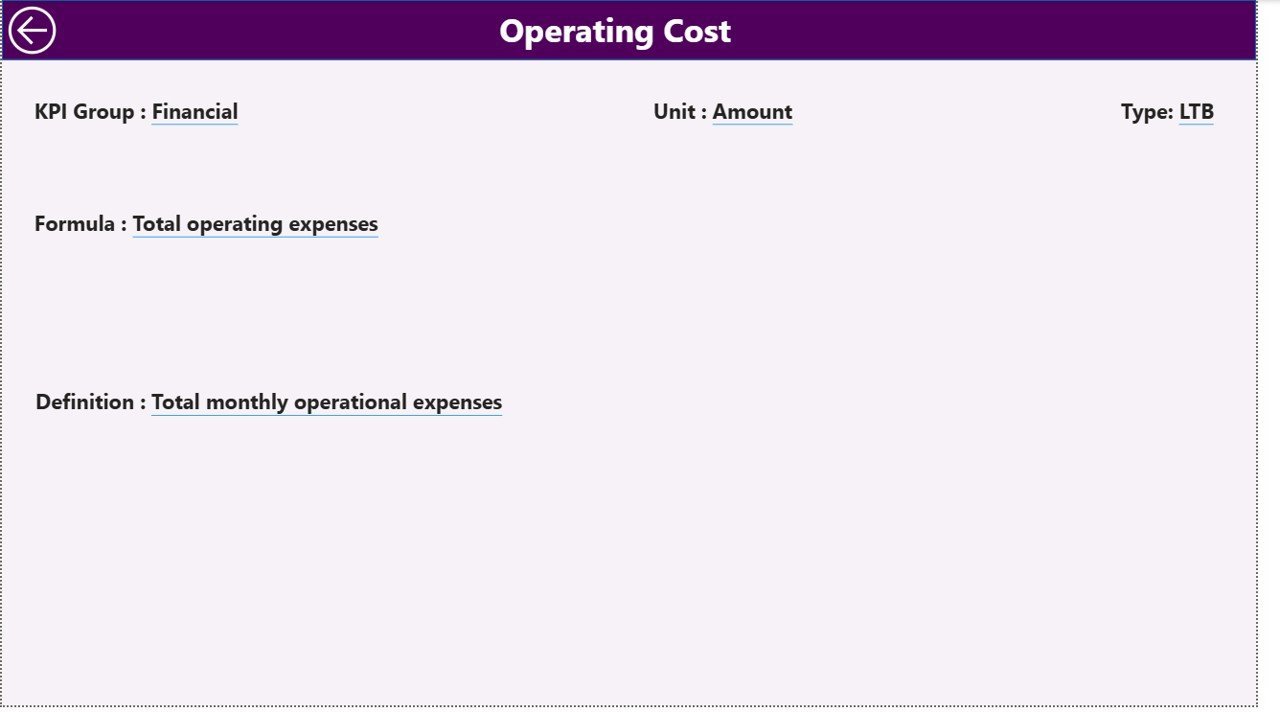
- 🔍 Drill-Through KPI Definitions: Dive into KPI details including formulas and definitions with a hidden KPI Definition page accessible via drill-through.
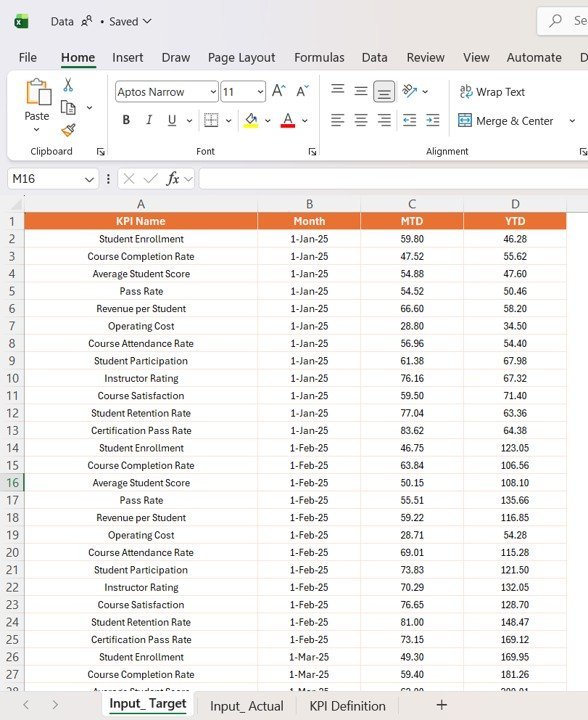
- 📂 Excel Data Integration: Easy-to-update Excel file with separate sheets for Actuals, Targets, and KPI Definitions ensures seamless data management.
What’s Inside the Coding Bootcamps KPI Dashboard in Power BI
This dashboard package includes a fully editable Power BI file and an Excel data source file with three essential tabs:
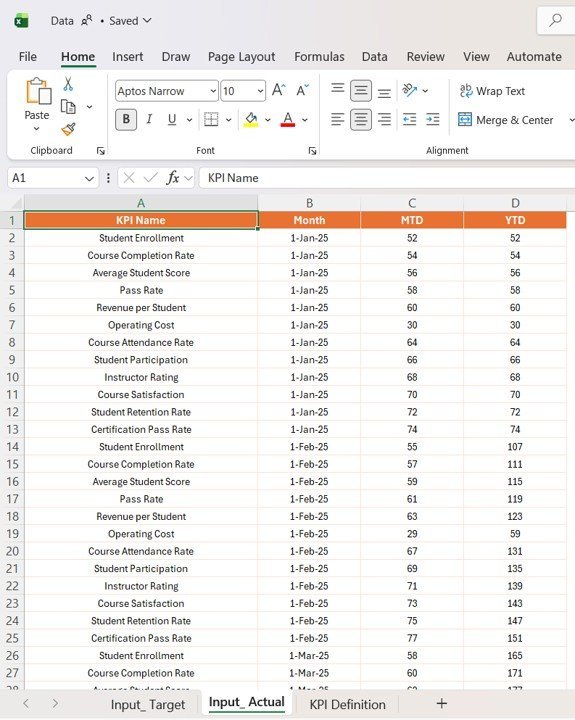
- 📄 Input_Actual Sheet: Enter your actual KPI numbers by month, including MTD and YTD values.
- 📊 Input_Target Sheet: Fill in your target KPI numbers corresponding to each month and measurement period.
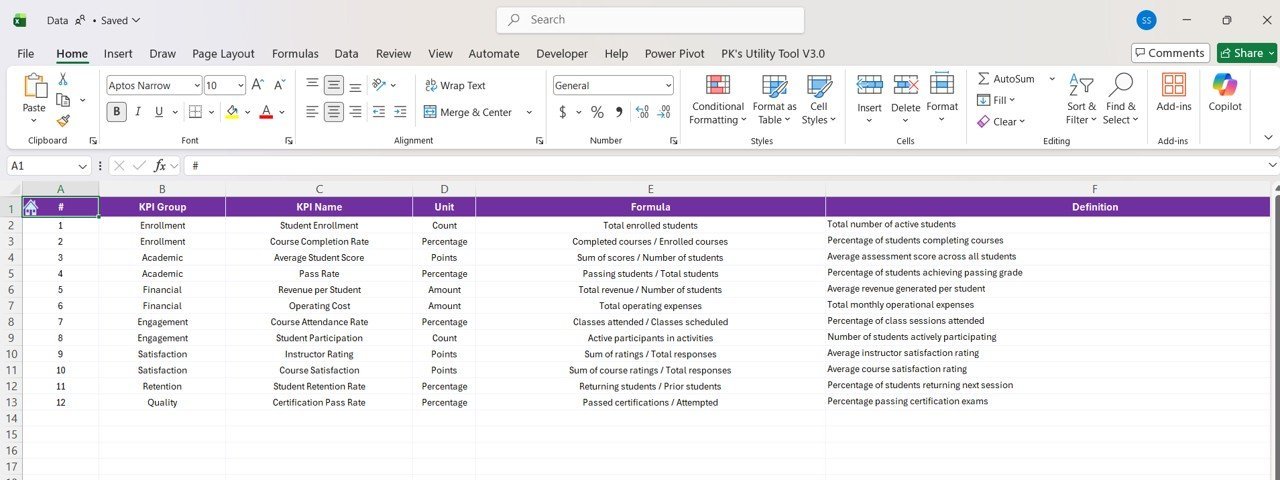
- 📚 KPI Definition Sheet: Define each KPI’s number, group, name, unit, formula, definition, and type (Lower The Better or Upper The Better).
With these components, you can customize the dashboard to fit your bootcamp’s unique KPIs and metrics.
How to Use the Coding Bootcamps KPI Dashboard in Power BI
Using this dashboard is straightforward and requires minimal setup:
- 🔄 Update Data: Input your latest KPI actuals and targets into the provided Excel file.
- 🔗 Connect Data: Open the Power BI dashboard file and ensure it’s linked to your updated Excel data source.
- 🖱️ Refresh Dashboard: Click the Refresh button on the Power BI Home tab to load the latest data.
- 📅 Filter and Analyze: Use the month and KPI group slicers on the Summary page to drill down into specific data sets.
- 📊 Explore Trends: Navigate to the KPI Trend page to analyze performance across months and years.
- 🔍 Drill Through Details: Click on any KPI in the summary table to view detailed definitions and formulas on the KPI Definition page.
- 🔙 Navigate Easily: Use the back button on the top left corner to return to the main dashboard page.
Designed for ease and efficiency, this dashboard enables you to focus on decision-making rather than data preparation.
Who Can Benefit from This Coding Bootcamps KPI Dashboard in Power BI
This dashboard is perfect for a wide range of users involved with coding bootcamps and educational programs:
- 🎓 Bootcamp Administrators: Gain clear visibility of program performance and operational KPIs.
- 📈 Data Analysts: Quickly analyze trends and generate reports without building dashboards from scratch.
- 🧑🏫 Instructors and Coaches: Monitor student progress KPIs to improve teaching methods.
- 💼 Program Managers: Track target achievements and adjust strategies based on data-driven insights.
- 🚀 Startups & EdTech Companies: Use the dashboard to measure success metrics and investor KPIs.
- 👨💻 Consultants: Provide clients with a ready-made, customizable dashboard solution for coding bootcamps.
Whether you are managing multiple bootcamps or a single program, this dashboard saves time and enhances KPI tracking accuracy.
Click here to read the Detailed blog post.
Visit our YouTube channel to learn step-by-step video tutorials


Reviews
There are no reviews yet.