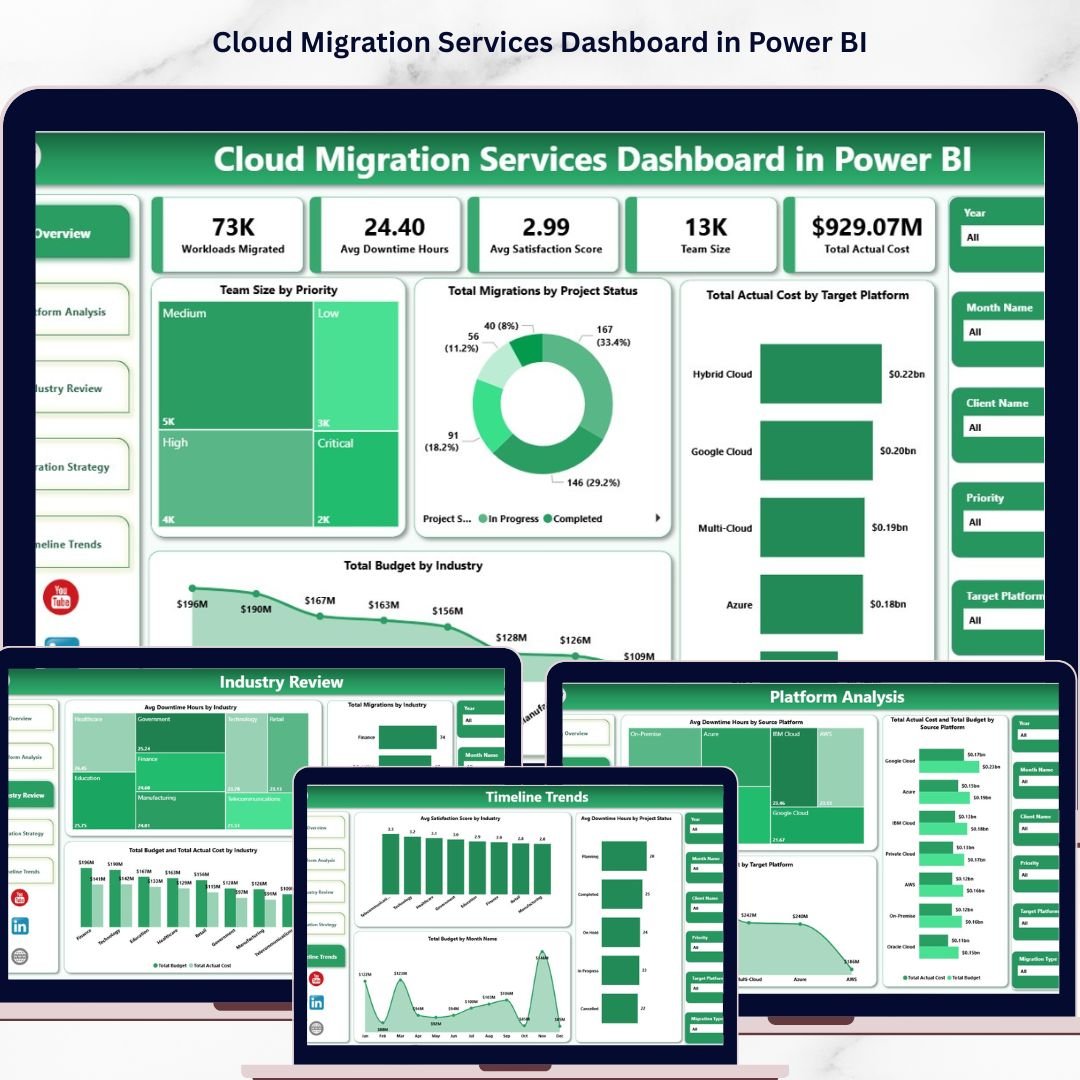

Cloud Migration Services Dashboard in Power BI is a powerful, ready-to-use Power BI dashboard template designed for IT teams, cloud architects, project managers, and consulting firms managing cloud migration projects across multiple industries and platforms. This dashboard includes 5 interactive analytical pages that track key metrics including Workloads Migrated, Avg Downtime Hours, Avg Satisfaction Score, Team Size, and Total Actual Cost — giving you complete visibility into your cloud migration portfolio at a glance.
🔑 Key Features of Cloud Migration Services Dashboard in Power BI
📊 5 Interactive Dashboard Pages — Overview, Platform Analysis, Industry Review, Migration Strategy, and Timeline Trends provide multi-dimensional analysis of your cloud migration projects in a single Power BI file.
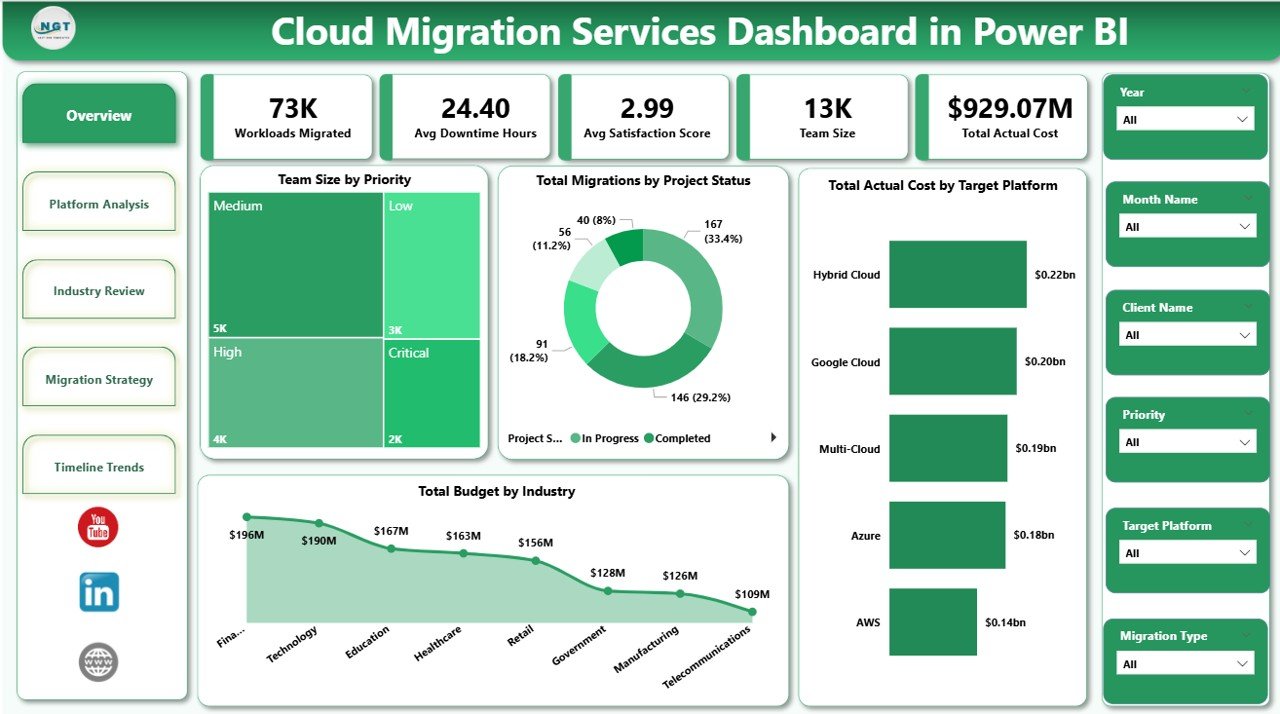
📈 5 KPI Cards on Overview Page — Workloads Migrated, Avg Downtime Hours, Avg Satisfaction Score, Team Size, and Total Actual Cost provide a high-level executive summary instantly.
🎛 Multiple Slicers for Quick Filtering — Apply filters across all pages to instantly drill down into specific industries, platforms, migration types, priorities, or time periods.
💰 Budget vs Actual Cost Comparison — Compare planned budgets against actual costs by target platform, industry, and migration priority to identify cost overruns early.
🏢 Industry-Level and Platform-Level Analysis — Understand which industries consume the most resources and analyze migration performance by source and target platforms across AWS, Azure, GCP, and more.
📅 Timeline Trends — Track satisfaction scores by industry, downtime by project status, and monthly budget trends over time for data-driven forecasting.
🔄 Instant Data Refresh — Simply update your data source and click Refresh to see every chart and visual update instantly in Power BI Desktop.
⚡ No Coding Required — Designed for immediate use by anyone familiar with Power BI Desktop — just open the .pbix file, connect your data, and start analyzing.
📦 What’s Inside the Cloud Migration Services Dashboard in Power BI
This Power BI dashboard template includes 5 page tabs designed for comprehensive cloud migration tracking and analysis:
📊 Overview Page — Displays 5 KPI cards (Workloads Migrated, Avg Downtime Hours, Avg Satisfaction Score, Team Size, Total Actual Cost) along with charts showing Team Size by Priority, Total Migrations by Project Status, Total Actual Cost by Target Platform, and Total Budget by Industry. Multiple slicers allow instant filtering across all dimensions.
 Cloud Migration Services Dashboard in Power BI
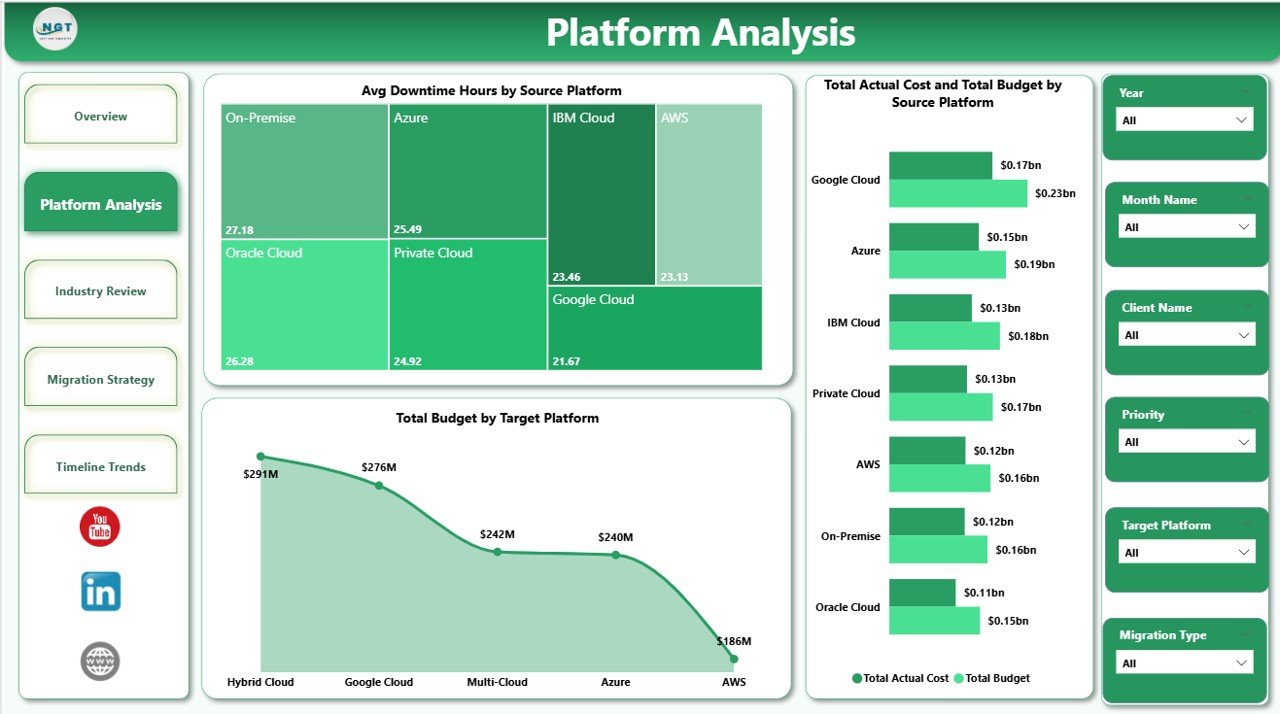
🖥 Platform Analysis Page — Provides deep analysis of cloud platforms with charts for Avg Downtime Hours by Source Platform, Total Actual Cost and Total Budget by Source Platform, and Total Budget by Target Platform. This page helps you identify which source platforms experience the most downtime and where budget allocations differ from actual spending.
 Platform Analysis
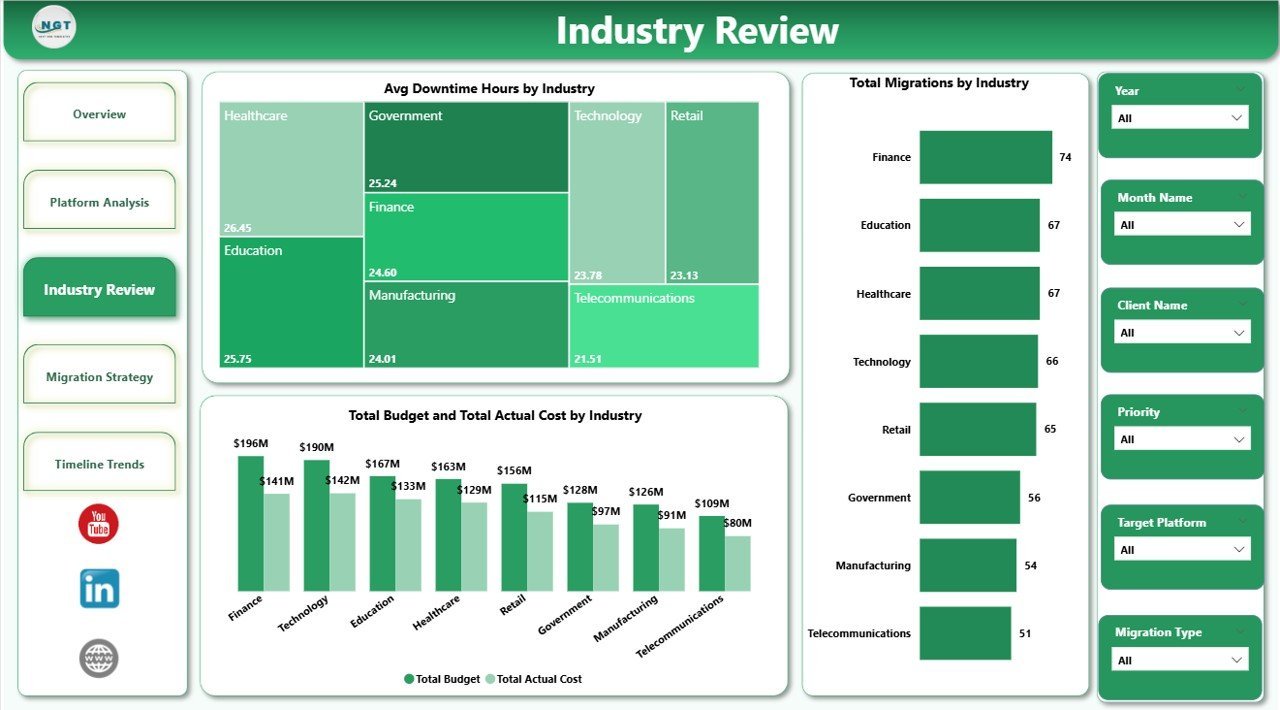
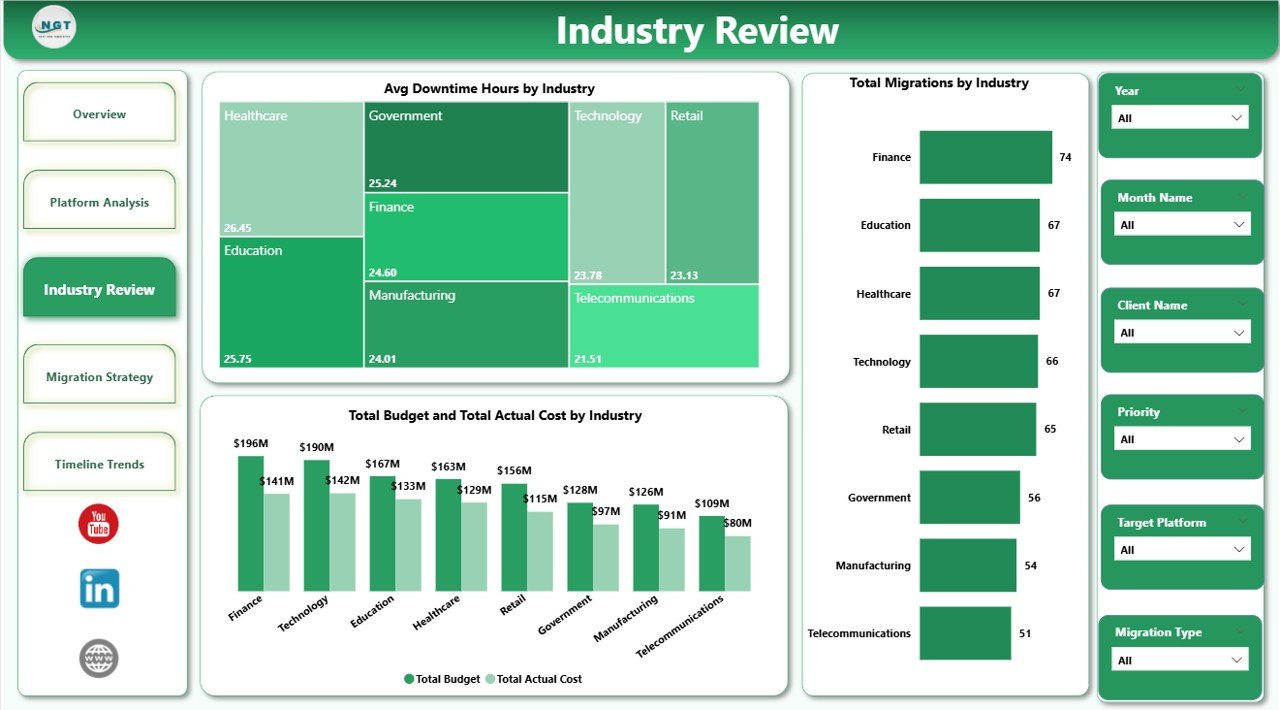
🏭 Industry Review Page — Analyzes cloud migration data by industry with charts for Avg Downtime Hours by Industry, Total Migrations by Industry, and Total Budget and Total Actual Cost by Industry. Quickly spot which industries face the highest downtime and where budget overruns are occurring.
 Industry Review
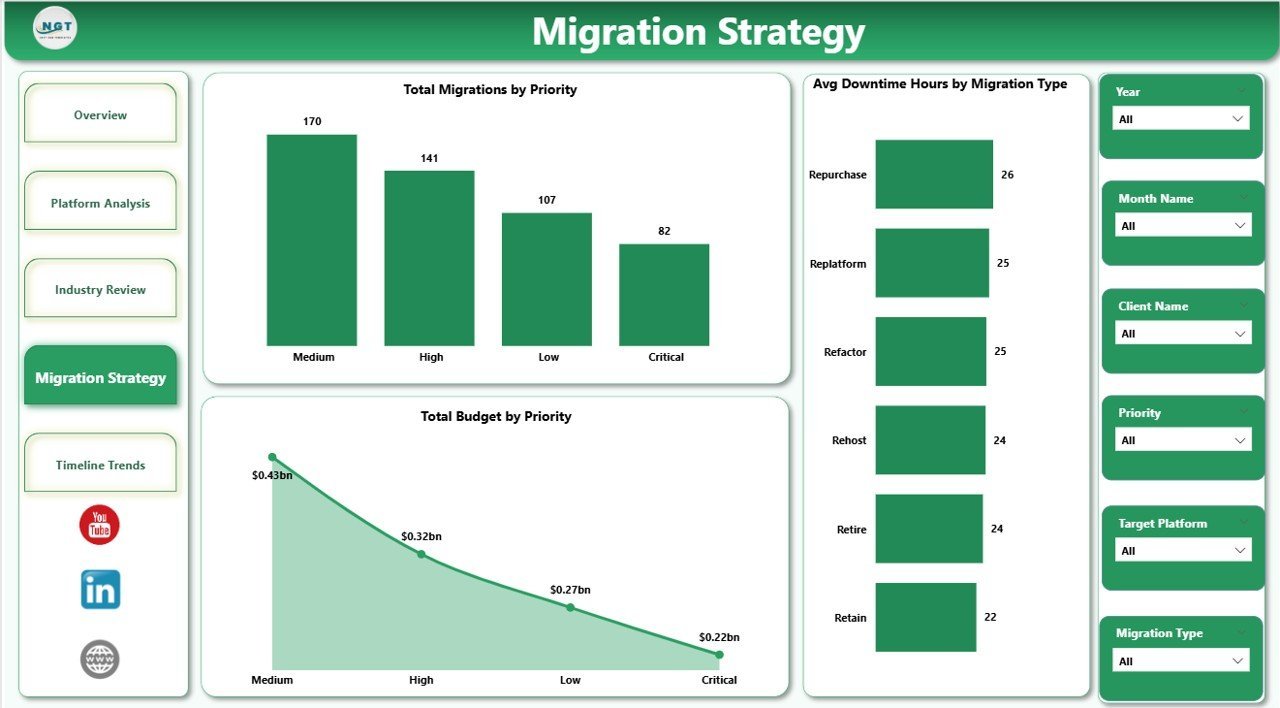
🔀 Migration Strategy Page — Focuses on migration approach analysis with charts for Total Migrations by Priority, Avg Downtime Hours by Migration Type, and Total Budget by Priority. Evaluate which migration strategies are the most efficient and cost-effective.
 Migration Strategy
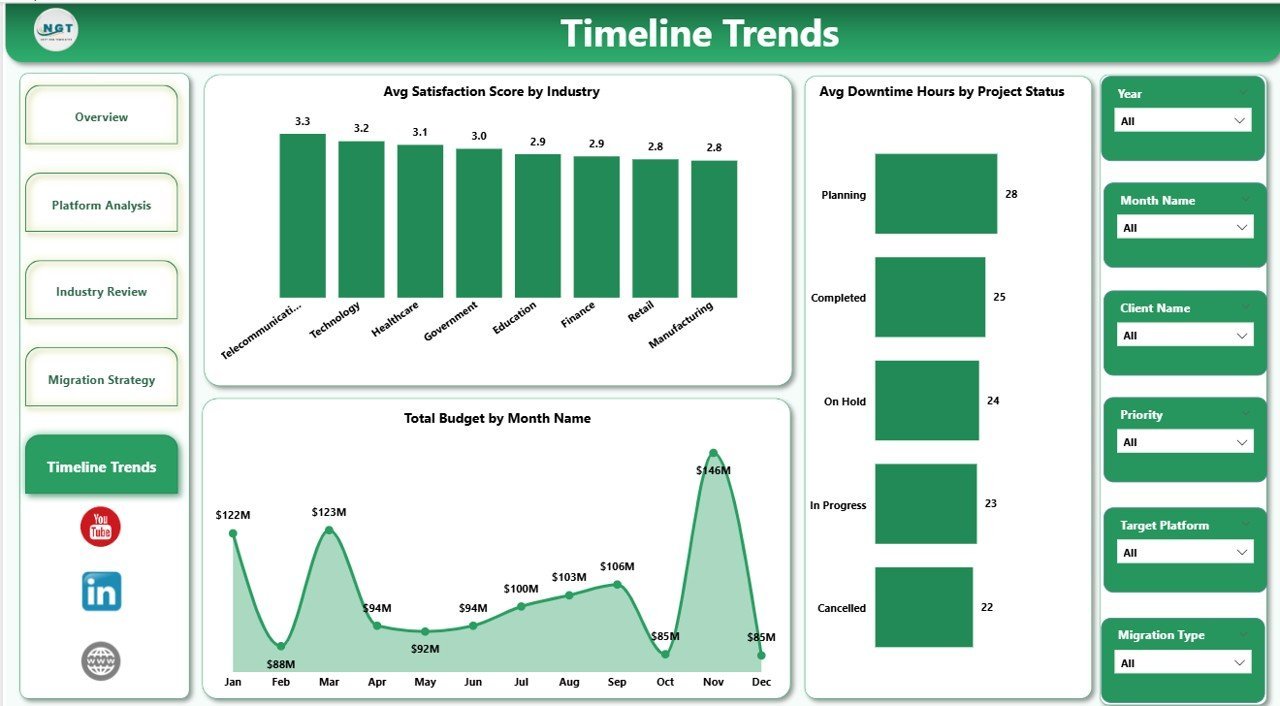
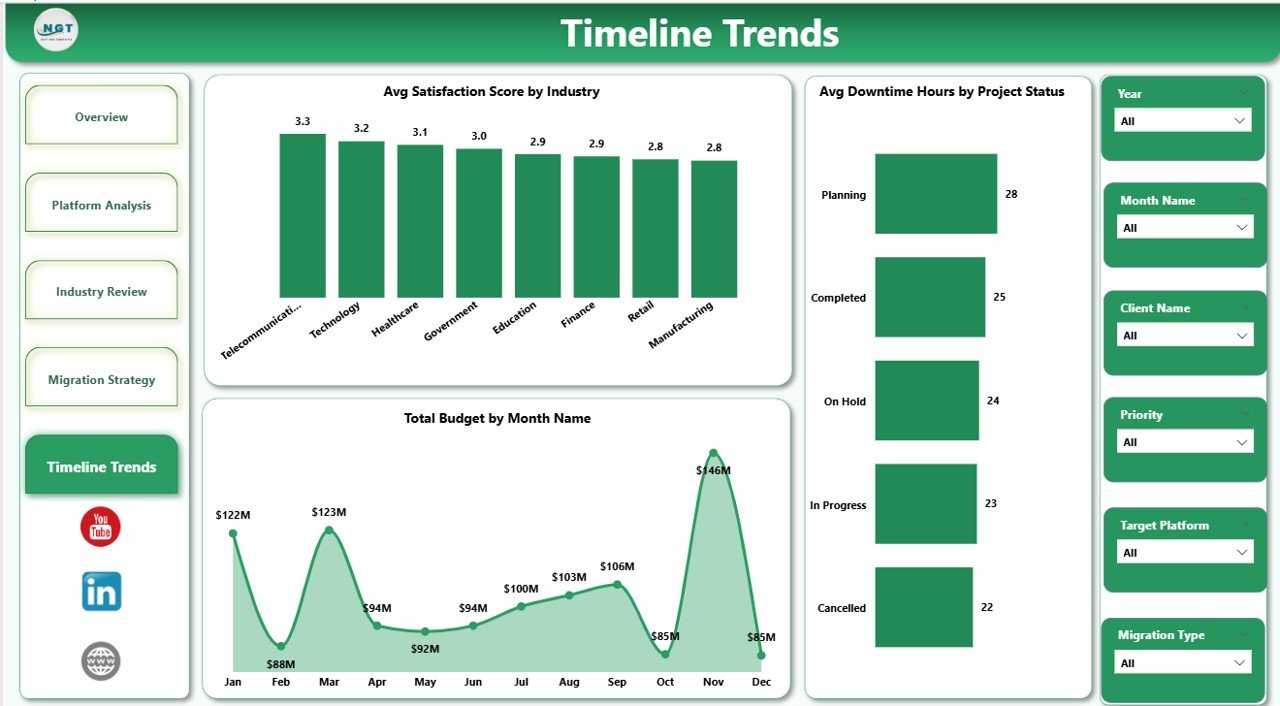
📅 Timeline Trends Page — Tracks migration performance over time with charts for Avg Satisfaction Score by Industry, Avg Downtime Hours by Project Status, and Total Budget by Month Name. Use this page to forecast upcoming expenses and identify seasonal patterns in migration activity.
 Timeline Trends
⚙️ How to Use the Cloud Migration Services Dashboard in Power BI
1️⃣ Download and Open — Unzip the file and open the .pbix file in Power BI Desktop (free download from Microsoft).
2️⃣ Connect Your Data Source — Replace the sample data with your own cloud migration project data in the connected Excel or CSV file.
3️⃣ Refresh the Dashboard — Go to Home tab and click Refresh to update all visuals instantly.
4️⃣ Explore Dashboard Pages — Navigate through Overview, Platform Analysis, Industry Review, Migration Strategy, and Timeline Trends for complete insights.
5️⃣ Apply Slicers — Filter by industry, platform, migration type, priority, or project status to focus on specific areas.
6️⃣ Present to Stakeholders — Share insights with CIOs, IT directors, and project sponsors directly from Power BI.
👥 Who Can Benefit from This Cloud Migration Services Dashboard in Power BI
☁ Cloud Architects & Engineers — Track workload migration across platforms and monitor downtime and cost.
📋 IT Project Managers — Monitor budget vs actual cost, project status, and migration timelines.
🏢 IT Consulting Firms — Manage multi-industry cloud migration portfolios with a single Power BI dashboard.
💼 CIOs & IT Directors — Get executive-level visibility into cloud transformation progress.
📊 Business Analysts — Analyze migration trends and cost patterns for data-driven recommendations.
❓ Frequently Asked Questions
What metrics does the Cloud Migration Services Dashboard in Power BI track?
The Cloud Migration Services Dashboard in Power BI tracks 5 key metrics including Workloads Migrated, Avg Downtime Hours, Avg Satisfaction Score, Team Size, and Total Actual Cost across 5 interactive dashboard pages covering platform performance, industry breakdown, migration strategy, and timeline trends.
Do I need advanced Power BI skills to use this dashboard?
No. Simply open the .pbix file in Power BI Desktop, replace the sample data with your own, and click Refresh. All charts and visuals update automatically with zero coding required.
What cloud platforms does this dashboard support?
This dashboard supports all major cloud platforms including AWS, Azure, GCP, IBM Cloud, Oracle Cloud, and hybrid environments. You can add any custom platform names in your data source.
Can I add more data rows to expand the analysis?
Yes. Add more records in your data source file, click Refresh in Power BI, and the dashboard updates instantly with expanded analysis.
Is this suitable for consulting firms managing multiple clients?
Absolutely. The dashboard includes fields for Client Name, Industry, and Project Status, making it ideal for multi-client portfolio management across industries.
🔗 Explore Related Templates
📊 Cloud Migration Services Dashboard in Excel — Track cloud migration projects with pivot-powered charts and slicers in Excel.
📊 Cloud Migration KPI Dashboard in Power BI — Monitor cloud migration KPIs with MTD/YTD analysis and trend charts.
📊 Digital Transformation Dashboard in Power BI — Track digital projects, budgets, and completion rates.
Browse all Power BI Dashboard Templates on NextGenTemplates.
📖 Click here to read the Detailed Blog Post
🎥 Visit our YouTube channel to learn step-by-step video tutorials
👉 YouTube.com/@NextGenTemplates


Reviews
There are no reviews yet.