Managing clinic tenders is no longer just about paperwork and approvals. Today, clinics must handle strict compliance, rising costs, vendor accountability, and performance transparency—all at the same time. However, when tender data is scattered across multiple spreadsheets and manual reports, visibility drops and risks increase. That is exactly why the Clinic Tender KPI Dashboard in Excel is designed to transform the way clinics monitor, analyze, and control tender performance.
This professionally built Excel dashboard converts complex tender data into clear, visual, and actionable insights. Instead of spending hours consolidating reports, clinics can track all key tender KPIs in one centralized dashboard. As a result, decision-makers gain clarity, speed, and confidence—without investing in expensive BI tools.
Key Features of Clinic Tender KPI Dashboard in Excel
📊 Centralized Tender KPI Monitoring
Track all clinic tender KPIs in one structured Excel dashboard instead of managing multiple disconnected files.
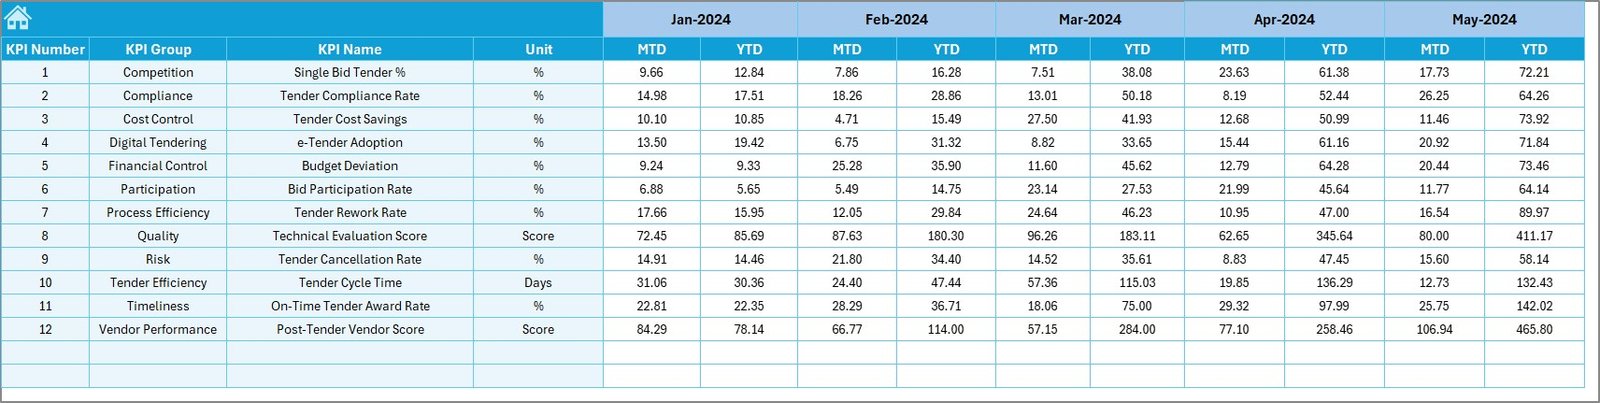
📅 MTD & YTD Performance Tracking
Analyze Month-to-Date and Year-to-Date Actuals, Targets, and Previous Year values for every tender KPI.
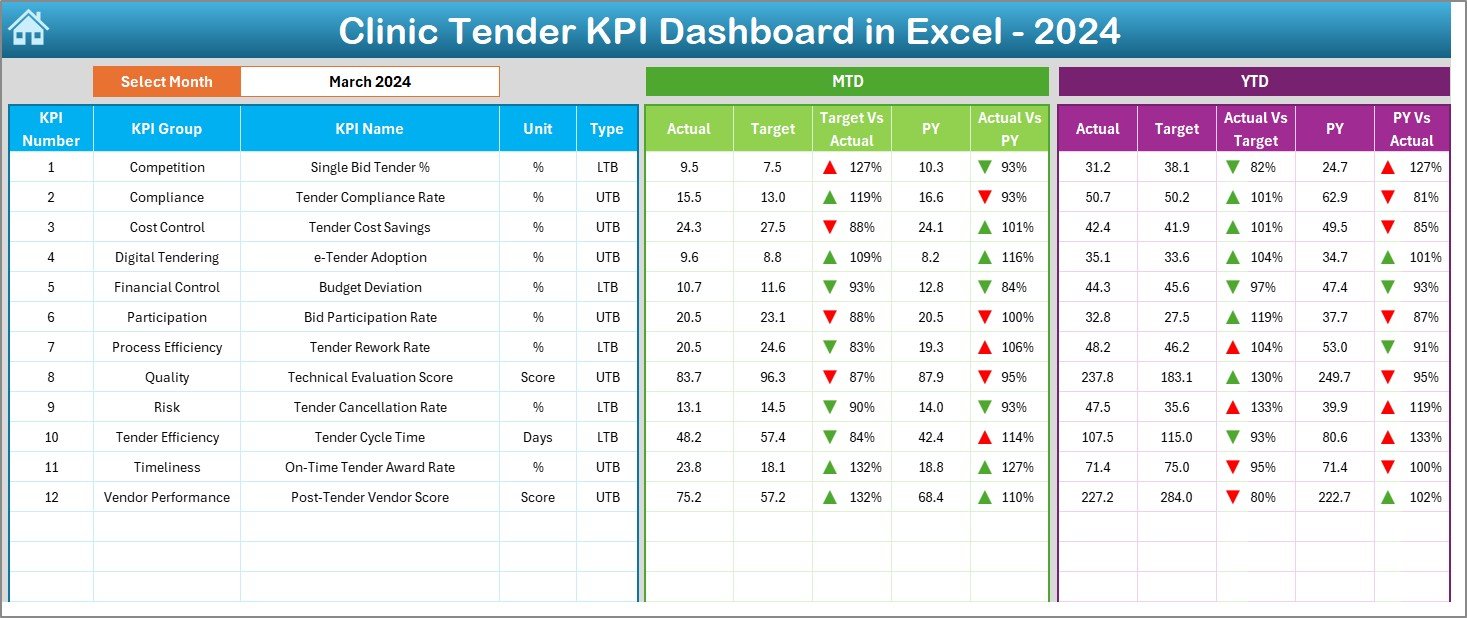
🎯 Target vs Actual Variance Analysis
Instantly identify gaps, delays, or overruns using automated variance calculations and visual indicators.
📉 Previous Year Comparison
Evaluate improvement or decline by comparing current tender performance with historical benchmarks.
📈 Interactive KPI Trend Analysis
Visual trend charts help you understand performance movement over time rather than relying on static numbers.
🚦 Conditional Formatting Indicators
Up and down arrows highlight positive and negative performance instantly for faster decision-making.
🧩 Fully Customizable Structure
Add, modify, or adjust KPIs easily without advanced Excel skills.
What’s Inside the Clinic Tender KPI Dashboard in Excel
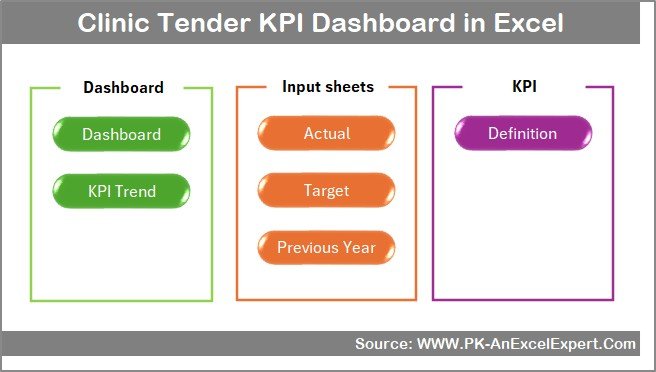
This dashboard includes 7 professionally structured worksheets, each designed for a specific purpose:
📌 Summary Page (Index Sheet)
Acts as the navigation hub with 6 interactive buttons for one-click access to all major sections.
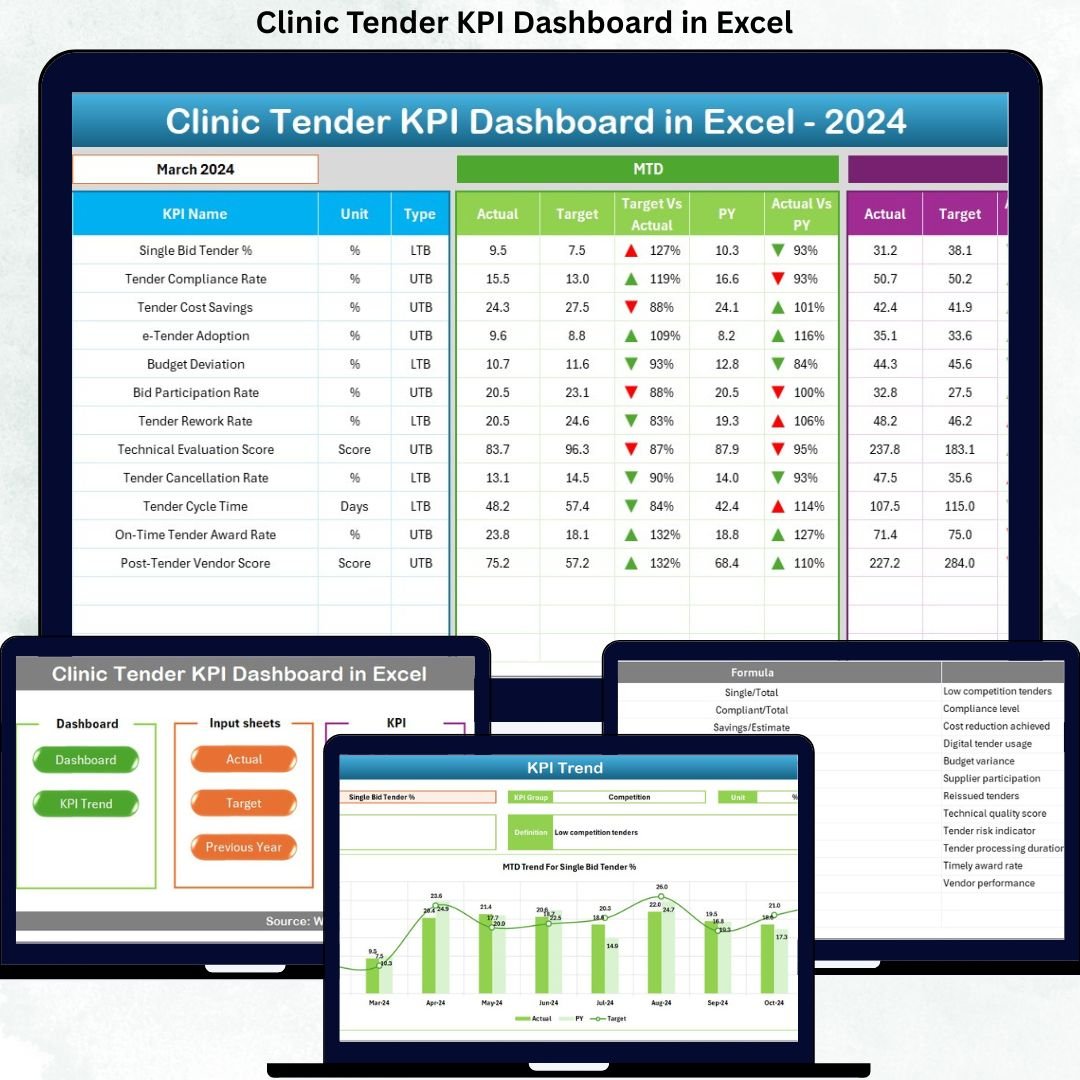
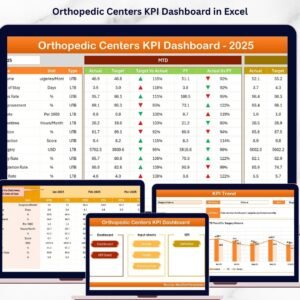
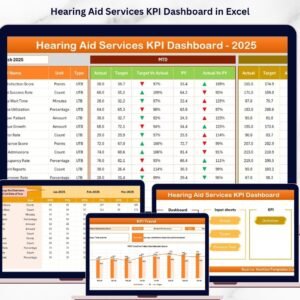
📌 Dashboard Sheet
The core reporting page where you select the month (cell D3) and instantly view all KPI results, including MTD, YTD, Target, and Previous Year comparisons.
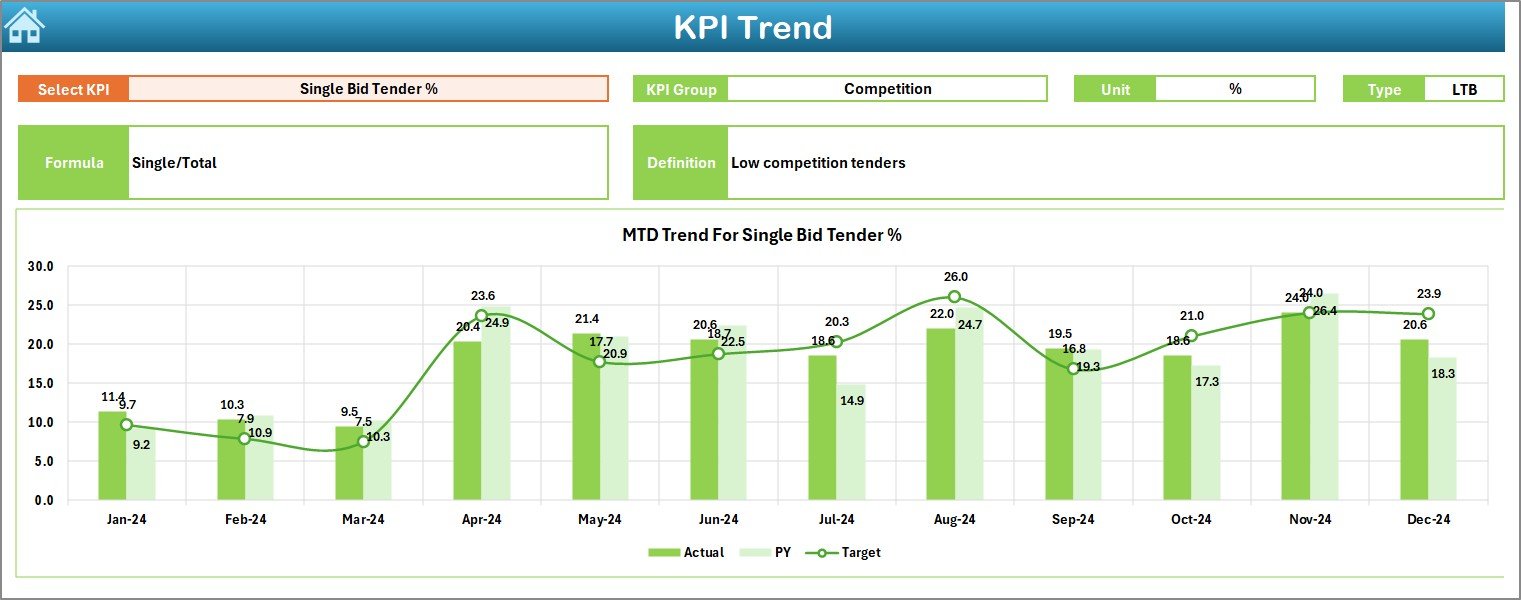
📌 Trend Sheet
Provides deep KPI-level analysis with dynamic MTD and YTD trend charts, along with KPI group, unit, formula, and definition details.
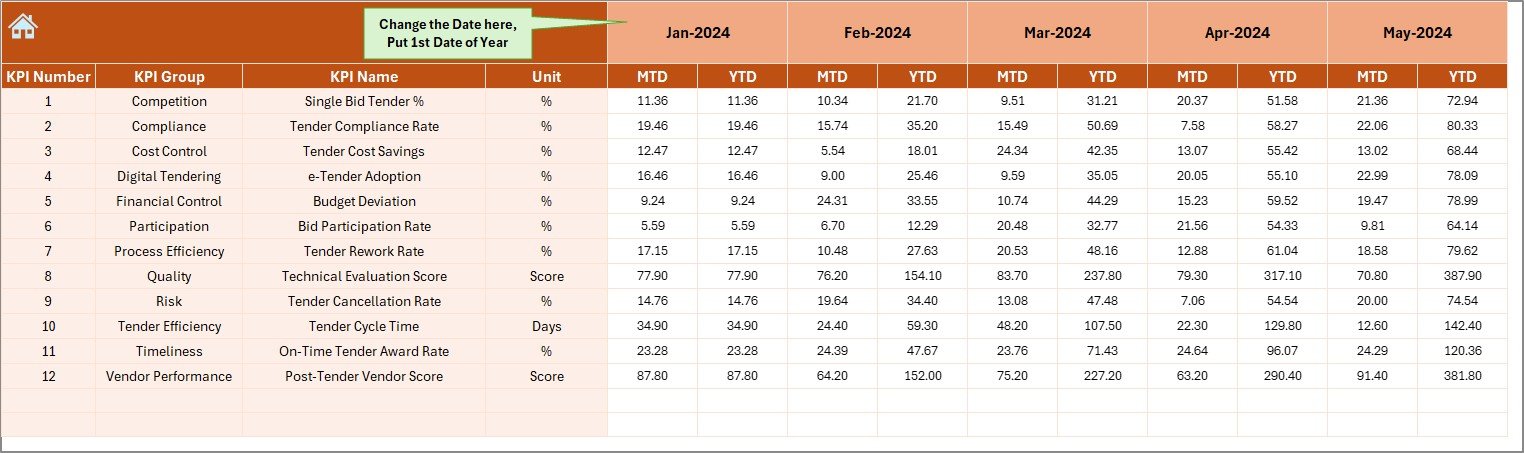
📌 Actual Numbers Input Sheet
Enter real performance data in a structured monthly format that automatically feeds the entire dashboard.
📌 Target Sheet
Define monthly and yearly benchmarks to drive meaningful variance and performance evaluation.
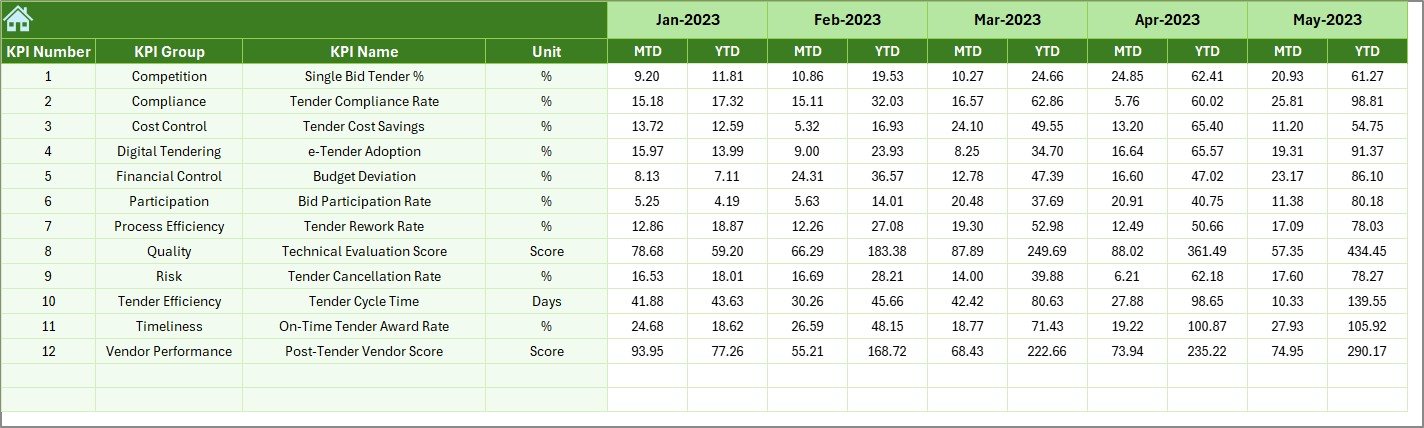
📌 Previous Year Sheet
Store historical KPI values to support accurate year-over-year analysis.
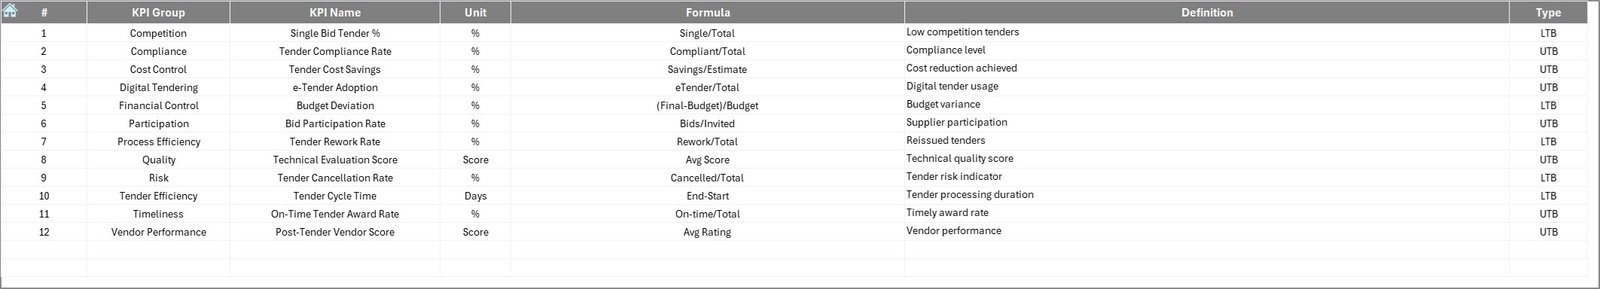
📌 KPI Definition Sheet
Standardize KPI understanding by clearly defining KPI names, groups, units, formulas, and KPI types (LTB or UTB).
⚙️ How to Use the Clinic Tender KPI Dashboard in Excel
Using this dashboard is simple and intuitive:
1️⃣ Enter KPI definitions and structure once
2️⃣ Input actual, target, and previous-year values
3️⃣ Select the reporting month from the dashboard
4️⃣ Instantly analyze MTD, YTD, variances, and trends
5️⃣ Use insights to improve tender decisions and control risks
Because everything updates dynamically, you always work with the latest insights.
👥 Who Can Benefit from This Clinic Tender KPI Dashboard
This dashboard is ideal for:
🏥 Clinic procurement managers
📋 Tender evaluation committees
💼 Finance and accounts teams
🏢 Hospital administrators
📑 Compliance and audit teams
🧠 Healthcare consultants
Whether you manage a single clinic or multiple healthcare facilities, this dashboard adapts easily to your needs.
Click here to read the Detailed Blog Post
Watch the step-by-step video tutorial:


Reviews
There are no reviews yet.