
Managing clinic projects has become more complex than ever. Clinics today juggle multiple initiatives such as facility expansion, medical equipment installation, IT system upgrades, renovation work, compliance programs, and patient service improvements. Because timelines are tight and budgets are limited, even a small delay or cost overrun can create serious operational challenges. Unfortunately, relying on scattered spreadsheets, emails, and manual reports often leads to confusion, delays, and poor visibility.
That is exactly why the Clinic Project KPI Dashboard in Excel is a must-have solution for modern clinics. This professionally designed, ready-to-use Excel dashboard converts raw project data into clear, visual, and actionable insights. Instead of spending hours consolidating reports, clinic teams can monitor project performance, timelines, costs, and risks—all from one centralized dashboard inside Microsoft Excel.
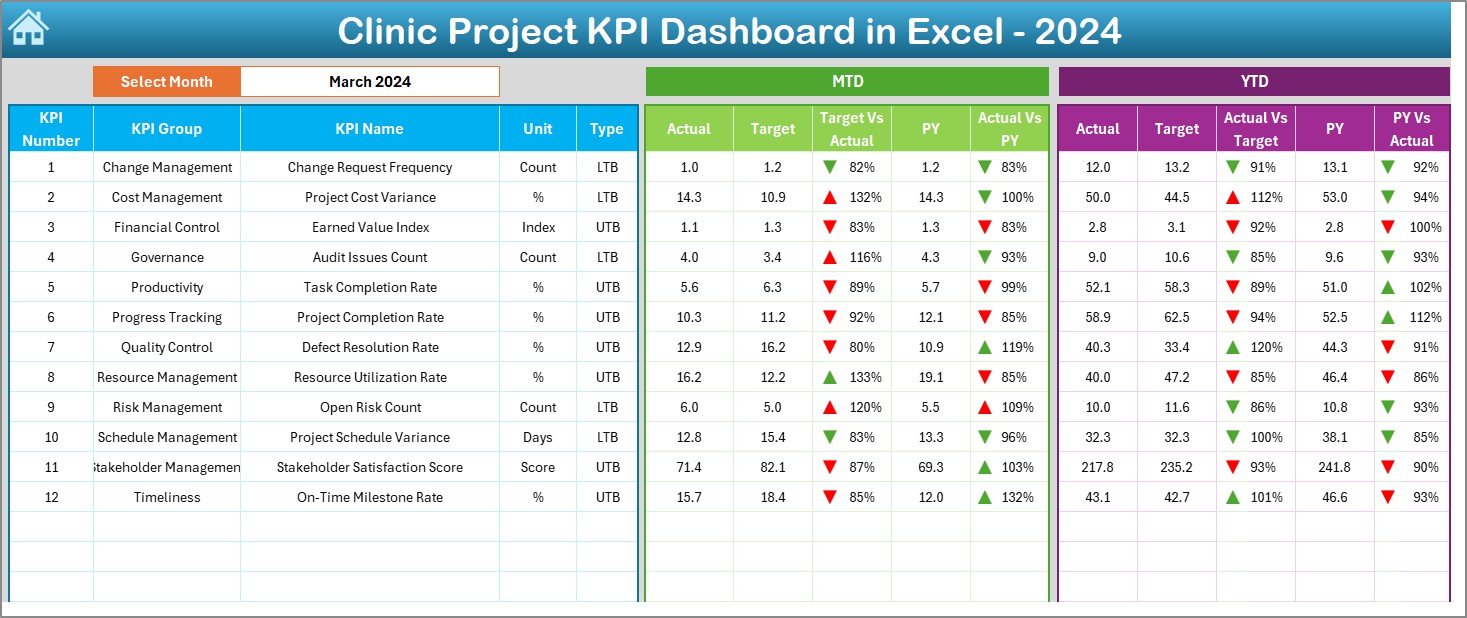
Designed for simplicity and power, this dashboard helps clinics track MTD and YTD performance, compare Actual vs Target vs Previous Year, analyze trends, and improve accountability—without investing in expensive project management software.
⭐ Key Features of Clinic Project KPI Dashboard in Excel
🚀 Centralized Project KPI Monitoring
Track all clinic project KPIs in one structured Excel dashboard instead of managing multiple disconnected files.
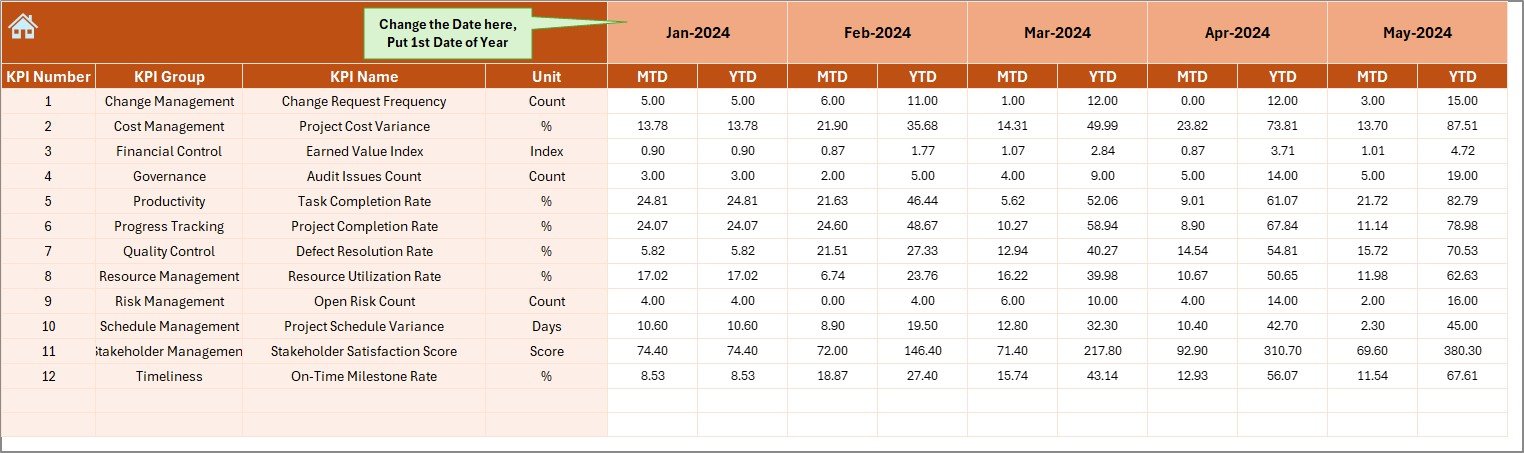
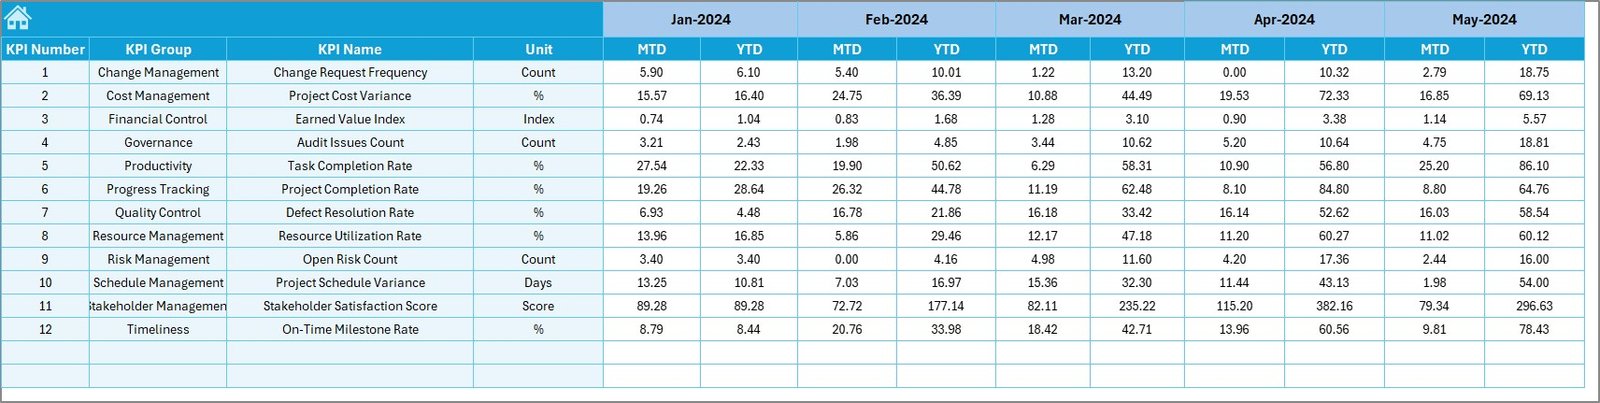
📊 MTD & YTD Performance Analysis
Monitor Month-to-Date and Year-to-Date Actuals, Targets, and Previous Year values in a single view.
🎯 Target vs Actual Variance Tracking
Instantly identify delays, overruns, or underperformance using automated variance calculations and visual indicators.
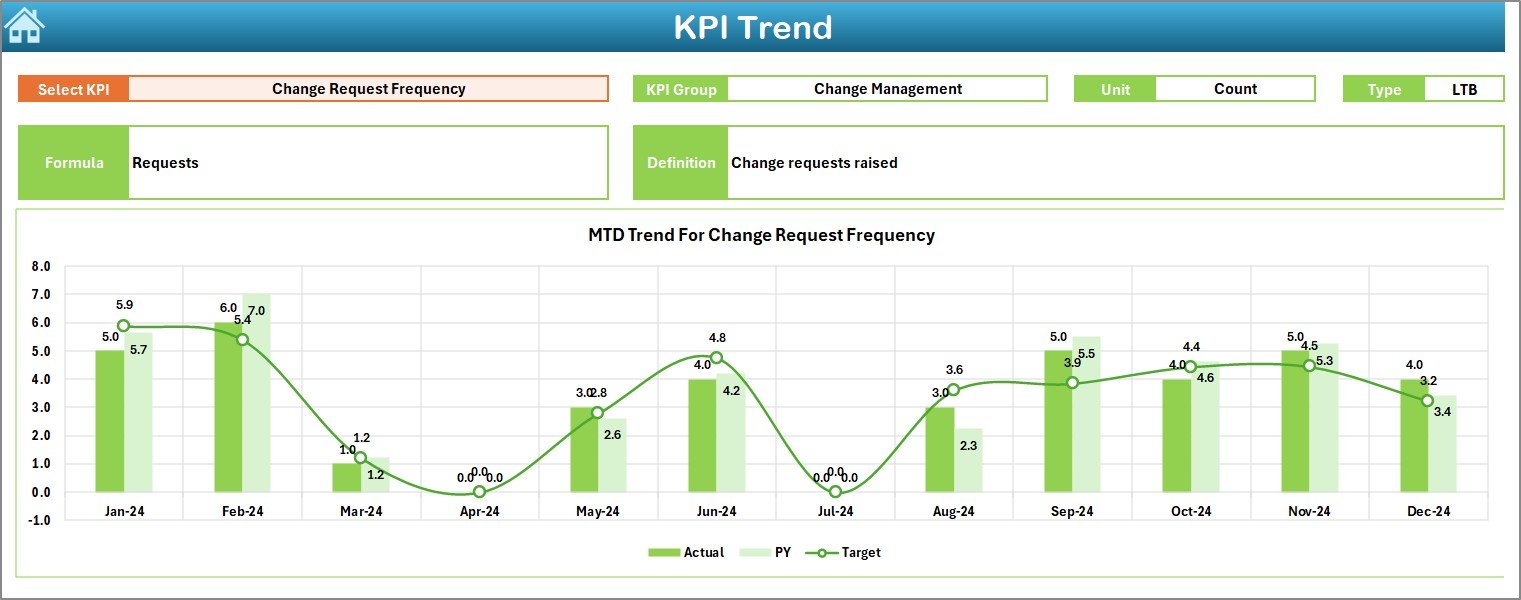
📈 Trend Analysis for Better Insights
Analyze KPI trends over time to uncover recurring issues, performance improvements, or risks early.
🔄 Dynamic Month Selection
Change the month from a dropdown and watch the entire dashboard update automatically.
🟢 Conditional Formatting with Arrows
Quickly identify positive and negative performance using intuitive up-down arrows.
🧩 Fully Customizable KPIs
Easily add, remove, or modify KPIs based on clinic project requirements.
💰 No Expensive Software Needed
Achieve professional project reporting using Microsoft Excel—no BI tools or subscriptions required.
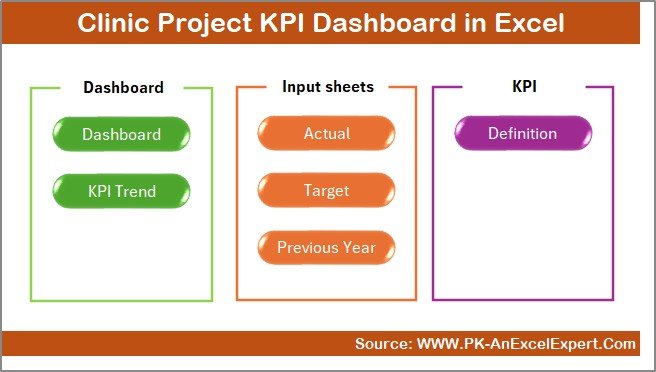
📂 What’s Inside the Clinic Project KPI Dashboard in Excel
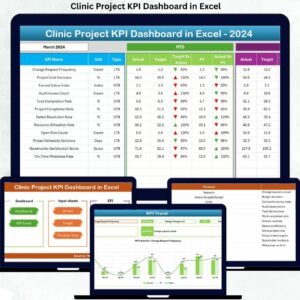
This dashboard includes 7 well-structured worksheets, each built for clarity and usability:
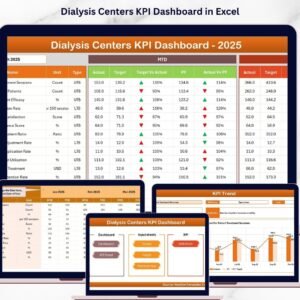
📌 Summary Page – Acts as a navigation hub with buttons for quick access to all major sheets.
📌 Dashboard Sheet – Displays all KPIs with MTD & YTD Actual, Target, and Previous Year comparisons.
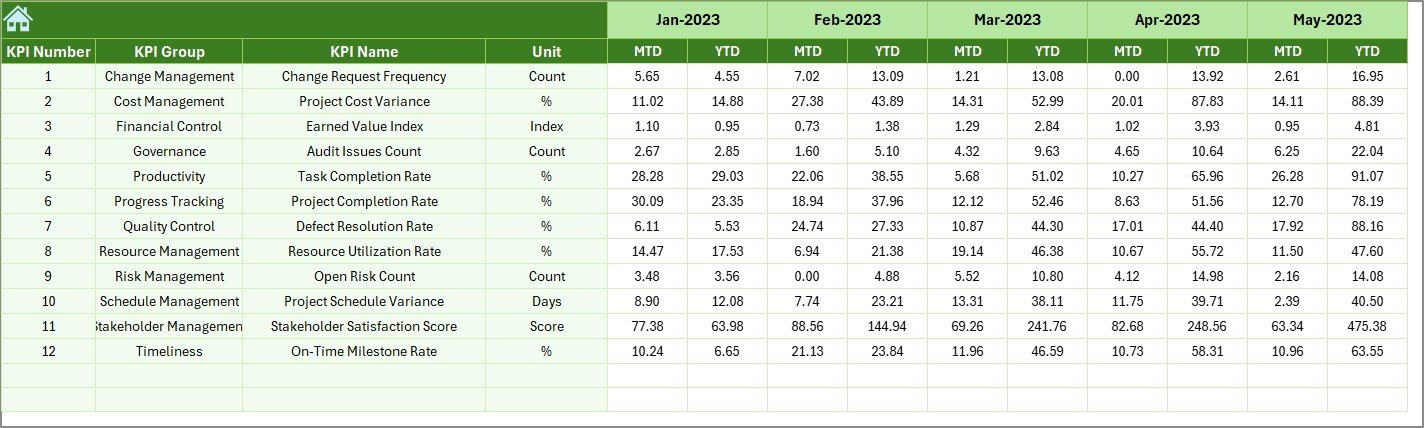
📌 Trend Sheet – Shows KPI-wise trends with charts, KPI group, unit, formula, and type (UTB/LTB).
📌 Actual Numbers Sheet – Input sheet for entering real project performance data.
📌 Target Sheet – Defines expected KPI targets for accurate performance comparison.
📌 Previous Year Sheet – Stores historical data for year-over-year analysis.
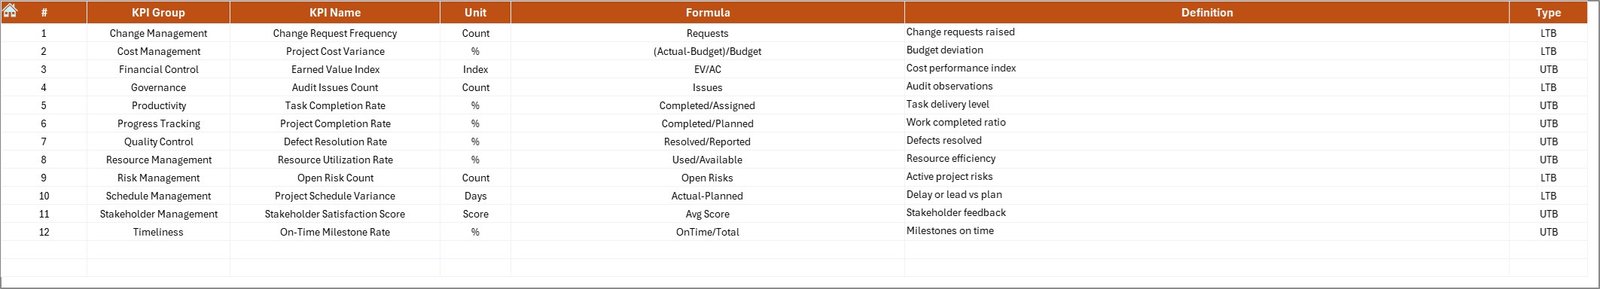
📌 KPI Definition Sheet – Standardizes KPI names, formulas, units, and definitions.
Together, these sheets create a powerful, structured, and audit-ready project reporting system.
🛠️ How to Use the Clinic Project KPI Dashboard in Excel
1️⃣ Enter actual project data in the Actual Numbers Sheet
2️⃣ Define KPI targets in the Target Sheet
3️⃣ Add previous year data in the Previous Year Sheet
4️⃣ Select the desired month from the dropdown
5️⃣ Instantly review performance, trends, and variances on the Dashboard & Trend sheets
No advanced Excel skills are required. The dashboard is designed for plug-and-play usage.
👥 Who Can Benefit from This Clinic Project KPI Dashboard
🏥 Clinic Administrators – Gain full visibility into ongoing projects
📋 Project Managers – Track timelines, milestones, and risks
⚙️ Operations Managers – Improve execution and accountability
💼 Finance Teams – Monitor budgets and cost overruns
📑 Compliance Teams – Track regulatory and accreditation projects
👔 Senior Leadership – Make confident, data-driven decisions
This dashboard ensures that everyone works with the same data, improving alignment across departments.
Click here to read the Detailed blog post
Watch the step-by-step video tutorial:


Reviews
There are no reviews yet.