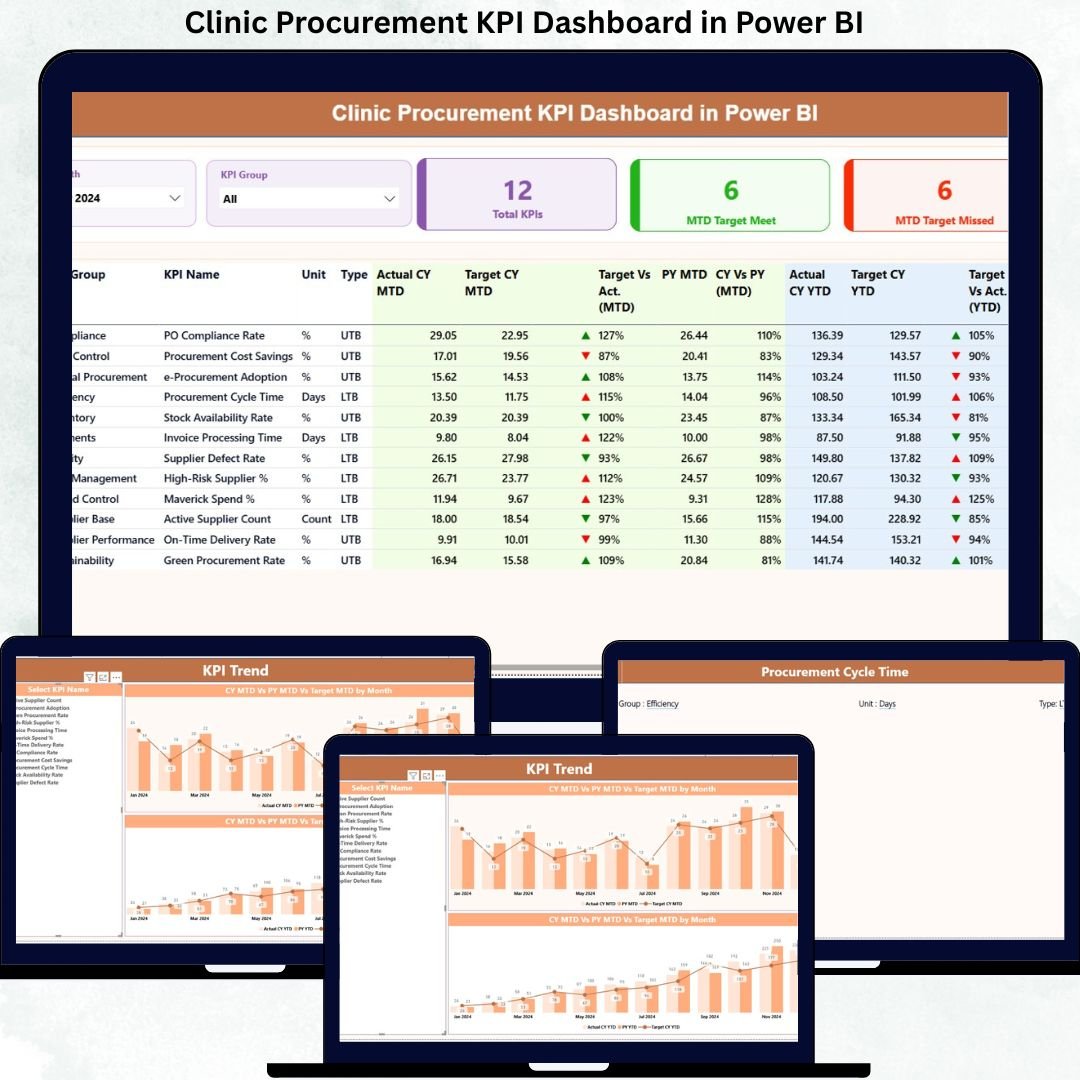
Modern clinics operate under constant pressure to control costs, ensure compliance, and maintain uninterrupted patient care. However, when procurement data is scattered across disconnected Excel files and manual reports, visibility drops and decisions become reactive. That is exactly where the Clinic Procurement KPI Dashboard in Power BI delivers a powerful advantage.
This ready-to-use dashboard transforms raw procurement data into meaningful KPIs, visual indicators, and trend-based insights. As a result, clinics gain complete control over procurement performance, targets, and efficiency—without investing in complex or expensive systems.
Built using Power BI with Excel as the data source, this dashboard is flexible, easy to maintain, and scalable for clinics of any size.
🚀 Key Features of the Clinic Procurement KPI Dashboard
📌 Centralized Procurement Monitoring
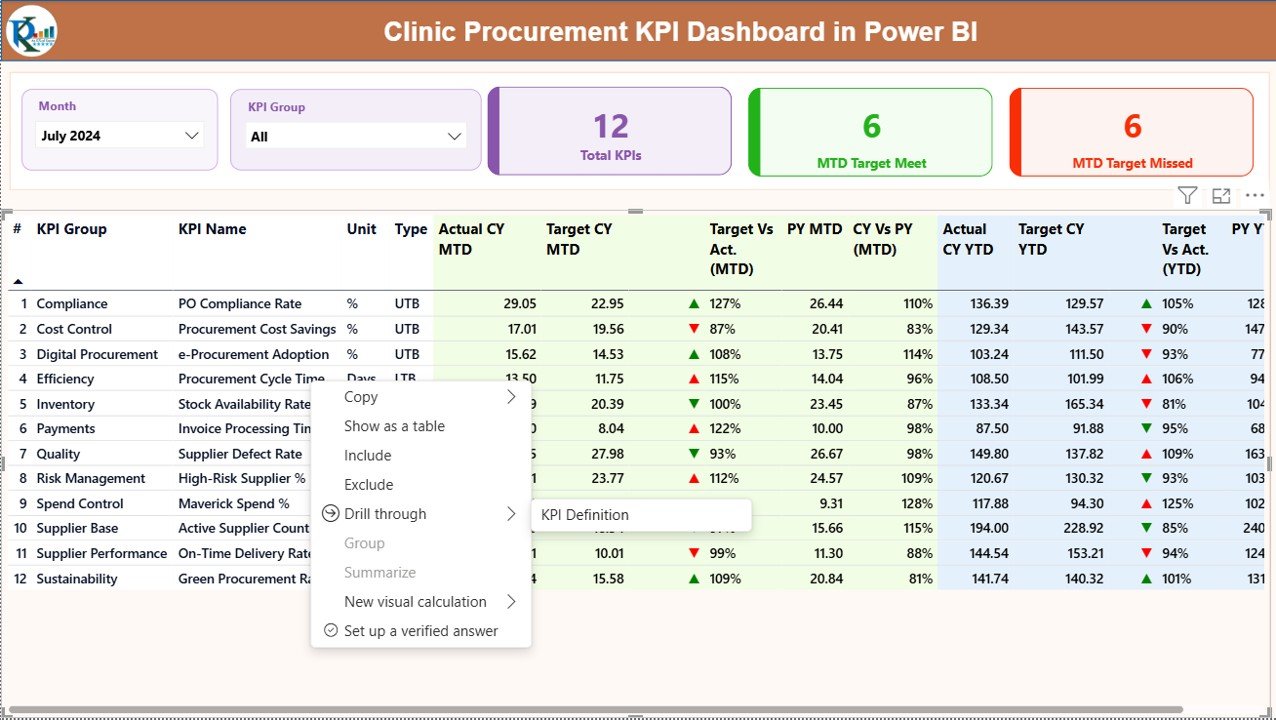
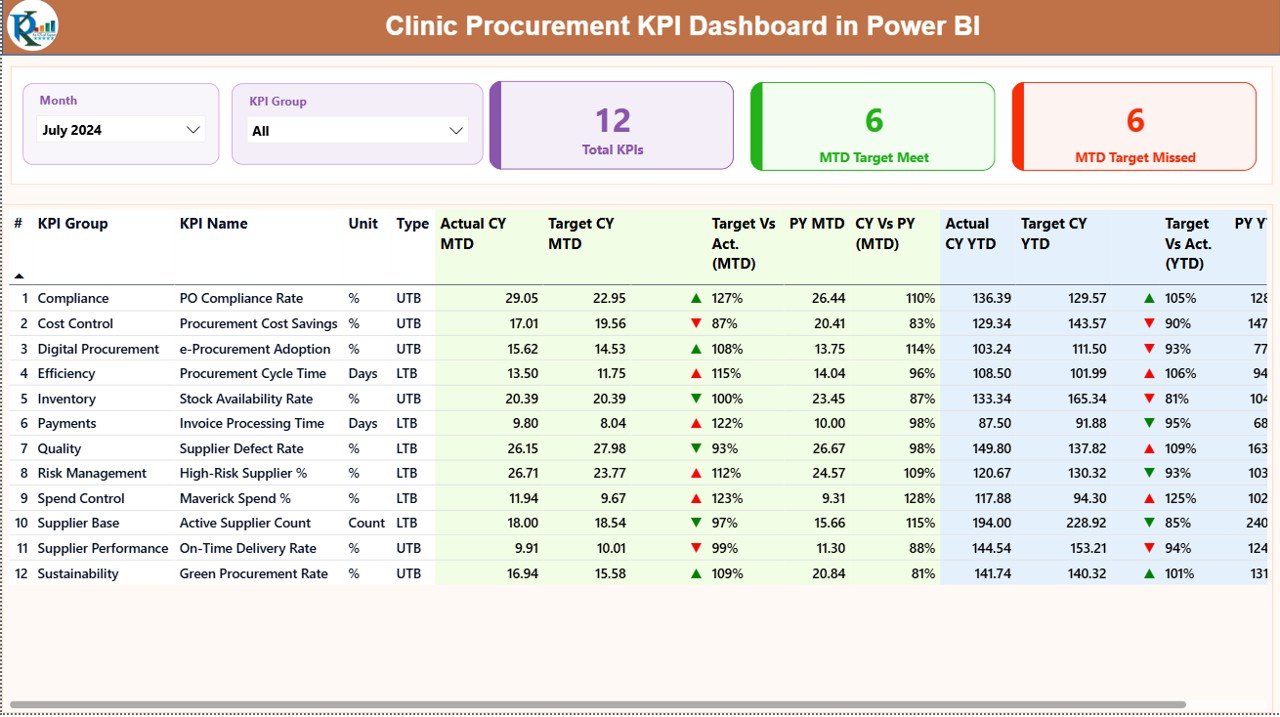
Track all procurement KPIs in one interactive Power BI dashboard instead of managing multiple reports.
📌 MTD & YTD Performance Tracking
Monitor Month-to-Date and Year-to-Date actuals against targets with instant visual indicators.
📌 Target Met vs Target Missed Indicators
Green and red icons clearly highlight which KPIs are performing well and which need attention.
📌 Actual vs Target & YoY Comparisons
Quickly analyze Current Year vs Previous Year performance to identify improvement or decline.
📌 Interactive Slicers for Focused Analysis
Filter results by Month and KPI Group to analyze specific procurement areas instantly.
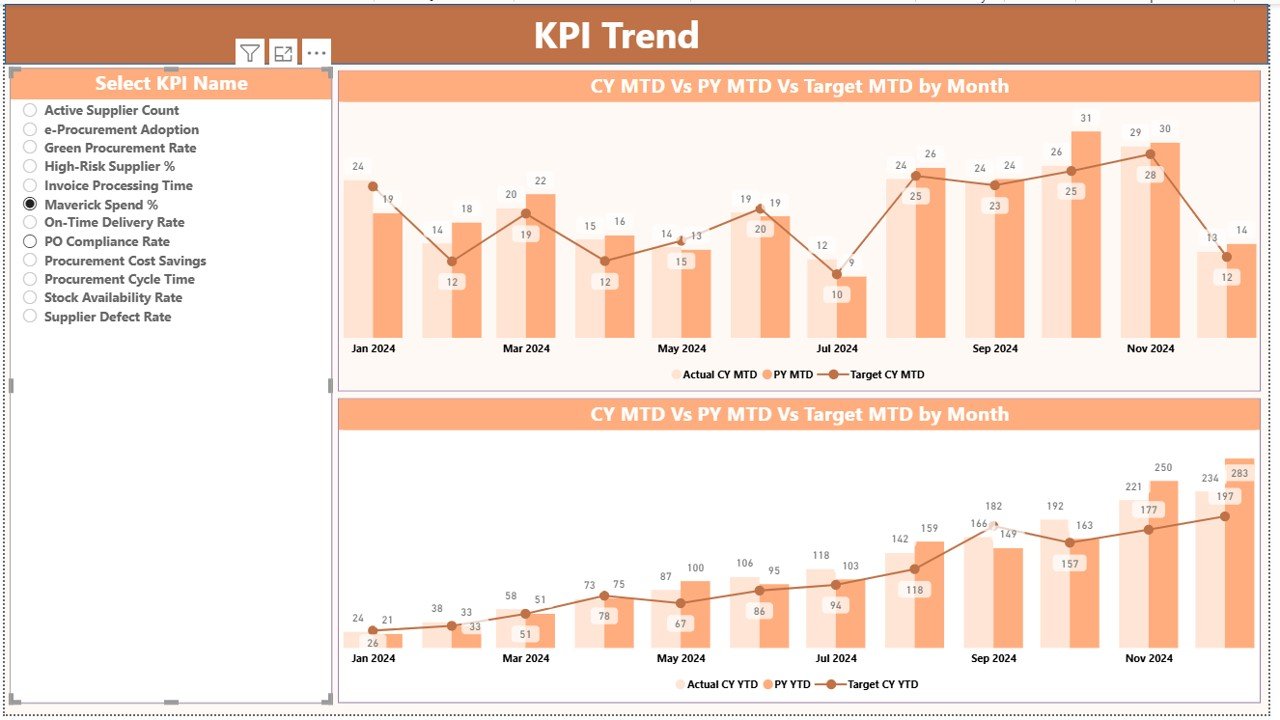
📌 Trend Analysis with Combo Charts
Visualize long-term procurement behavior using MTD and YTD trend charts.
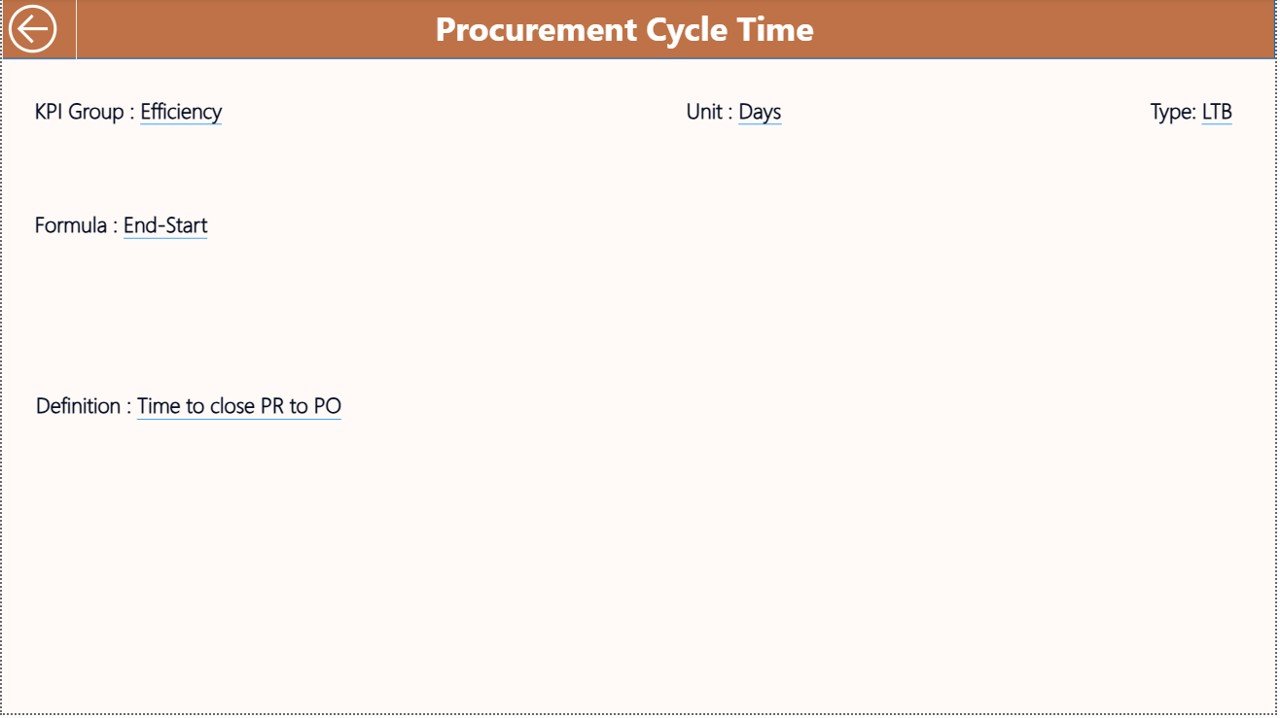
📌 Drill-Through KPI Definitions
Understand every KPI clearly with drill-through navigation to definitions, formulas, and objectives.
📌 Excel-Based Data Input
Update data easily using structured Excel sheets—no advanced Power BI skills required.
📦 What’s Inside the Clinic Procurement KPI Dashboard
This digital product includes a professionally designed Power BI file with three structured pages:
🔹 Summary Page
Acts as the command center with KPI cards, slicers, and a detailed KPI performance table.
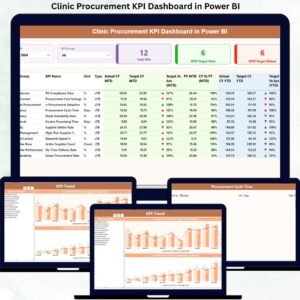
🔹 KPI Trend Page
Shows MTD and YTD trends using combo charts for Actual, Target, and Previous Year values.
🔹 KPI Definition Page
A drill-through page explaining KPI logic, formulas, objectives, and KPI types (LTB / UTB).
In addition, the Excel data model includes:
-
Input_Actual Sheet for actual MTD & YTD values
-
Input_Target Sheet for target values
-
KPI Definition Sheet for standardization and clarity
This structure ensures transparency, audit-readiness, and long-term scalability.
🛠️ How to Use the Clinic Procurement KPI Dashboard
Using the dashboard is simple and user-friendly:
1️⃣ Enter procurement actuals into the Input_Actual Excel sheet
2️⃣ Maintain targets in the Input_Target sheet
3️⃣ Define KPIs clearly in the KPI Definition sheet
4️⃣ Refresh Power BI to update visuals instantly
5️⃣ Use slicers, icons, and trend charts to analyze performance
Because Power BI handles all calculations automatically, clinics can focus on insights—not formulas.
👥 Who Can Benefit from This Clinic Procurement KPI Dashboard
🏥 Procurement Managers – Monitor spending efficiency and target achievement
📊 Finance Teams – Track cost control and procurement performance
🏢 Clinic Administrators – Improve governance and accountability
⚙️ Operations Heads – Identify bottlenecks and underperformance early
📑 Compliance Officers – Ensure standardized KPI tracking and documentation
Whether you manage a single clinic or multiple locations, this dashboard adapts effortlessly.
Click here to read the Detailed Blog Post
Watch the step-by-step video tutorial:
Visit our YouTube channel to learn step-by-step video tutorials
🔗 https://youtube.com/@PKAnExcelExpert


Reviews
There are no reviews yet.