


Managing clinic contracts without real-time performance visibility often leads to cost overruns, missed SLAs, compliance risks, and poor accountability. Modern clinics handle multiple vendors, complex agreements, strict healthcare regulations, and continuous performance expectations. Therefore, relying on scattered Excel sheets or manual reports is no longer sustainable.
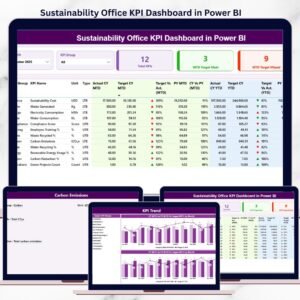
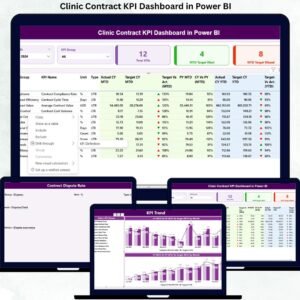
That is exactly why the Clinic Contract KPI Dashboard in Power BI is designed as a powerful, ready-to-use analytical solution. This dashboard converts raw contract data into clear KPIs, visual indicators, and actionable trends—helping clinics monitor performance confidently, improve governance, and make smarter decisions faster.
Built using Power BI with Excel as the data source, this dashboard ensures flexibility, scalability, and ease of use—without requiring advanced technical skills.
🔑 Key Features of Clinic Contract KPI Dashboard in Power BI
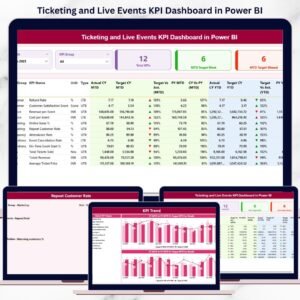
📊 Centralized Contract Performance Monitoring
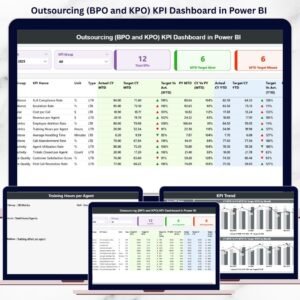
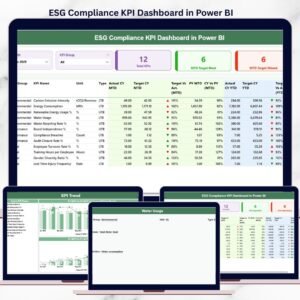
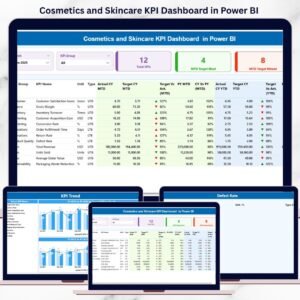
Track all clinic contract KPIs from a single interactive dashboard instead of juggling multiple files.
📅 Dynamic Month & KPI Group Filters
Instantly filter KPIs by reporting month or contract category for focused analysis.
🎯 MTD & YTD Target vs Actual Tracking
Monitor Month-to-Date and Year-to-Date performance with automated calculations.
🚦 Visual Status Indicators (LTB & UTB Logic)
Green and red icons clearly show whether KPIs meet or miss targets.
📈 Trend Analysis with Combo Charts
Compare Current Year, Previous Year, and Target values to identify patterns early.
🧾 Drill-Through KPI Definitions
Ensure clarity with detailed KPI formulas, definitions, units, and logic.
⚡ Excel-Driven & Easy to Maintain
Simply update Excel—Power BI refreshes visuals automatically.

📂 What’s Inside the Clinic Contract KPI Dashboard
📄 Power BI Dashboard File (.pbix)
Fully designed dashboard with Summary, KPI Trend, and KPI Definition pages.
📊 Pre-Structured Excel Data Templates
-
Input_Actual sheet
-
Input_Target sheet
-
KPI Definition sheet
🧠 Pre-Built KPI Logic & Measures
Includes MTD, YTD, CY vs PY, and target achievement calculations.
🎨 Professional Visual Design
Clean layout with cards, tables, slicers, and combo charts.
🔍 Hidden Drill-Through Page
Detailed KPI explanations for consistent interpretation.
▶️ How to Use the Clinic Contract KPI Dashboard
1️⃣ Enter KPI actuals and targets in the provided Excel sheets
2️⃣ Update KPI definitions, units, and types (LTB or UTB)
3️⃣ Open the Power BI file and refresh data
4️⃣ Use slicers to filter by month, KPI group, or KPI name
5️⃣ Analyze MTD & YTD performance instantly
6️⃣ Drill through KPIs to understand logic and formulas
Because of this simple workflow, even non-technical users can operate the dashboard confidently.
👥 Who Can Benefit from This Clinic Contract KPI Dashboard?
🏥 Clinic Administrators – Gain full visibility into contract performance
📑 Contract Managers – Track SLA compliance and renewal timelines
💰 Finance & Accounts Teams – Monitor cost variance and budget control
🛒 Procurement Teams – Evaluate vendor performance objectively
👔 Senior Management – Make data-driven strategic decisions
This dashboard supports better collaboration, accountability, and transparency across clinic operations.
Click here to read the Detailed blog post
Watch the step-by-step video tutorial:


Reviews
There are no reviews yet.