Running a chiropractic clinic successfully today requires more than just excellent patient care. Clinics must also manage financial performance, operational efficiency, staff utilization, and compliance while ensuring patient satisfaction. To achieve this balance, clinics need data-driven insights that go beyond manual spreadsheets and static reports.
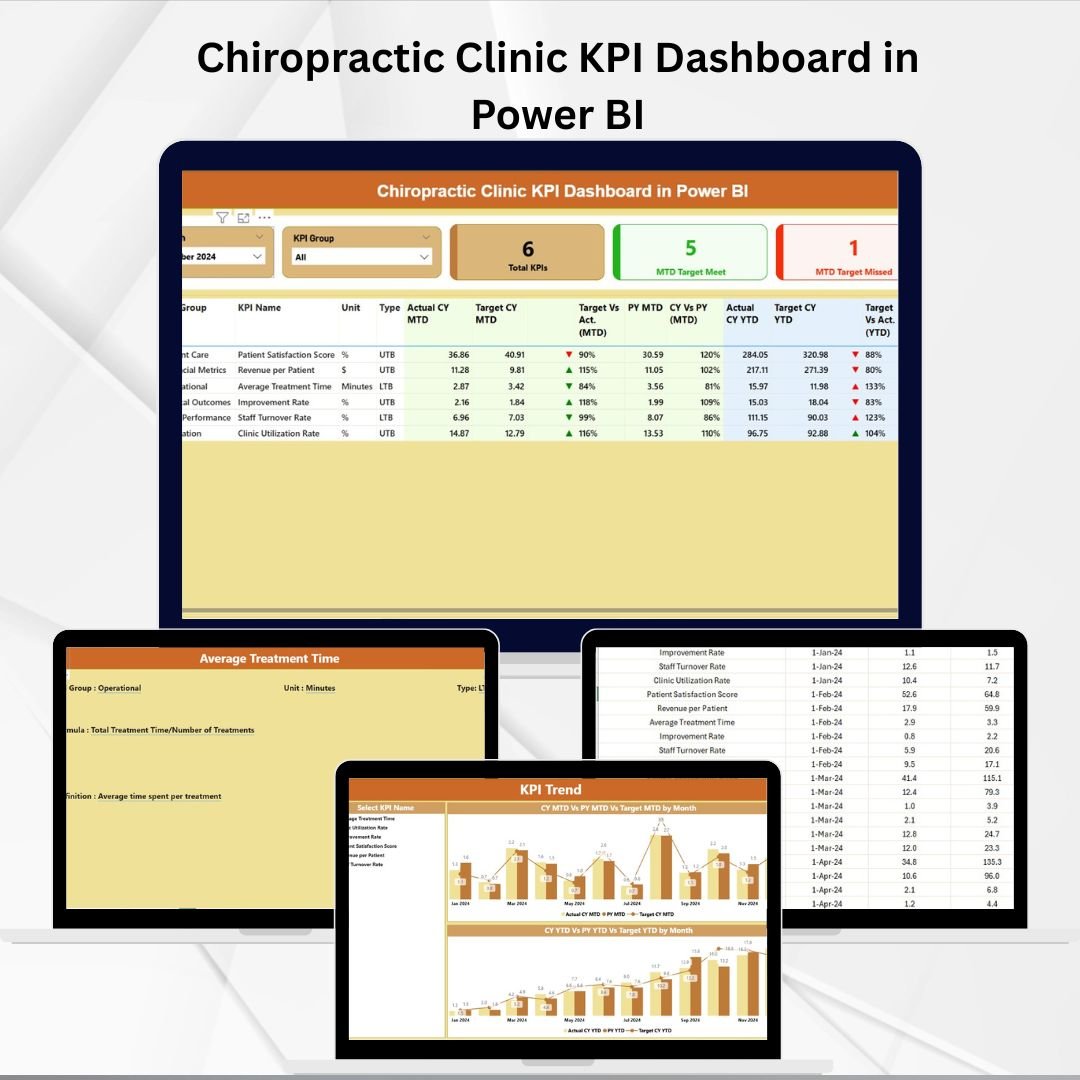
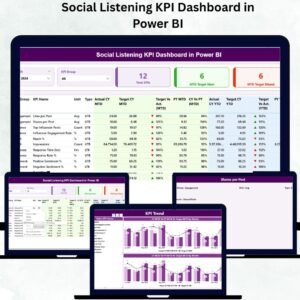
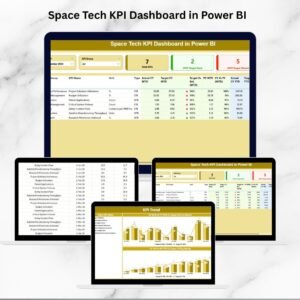
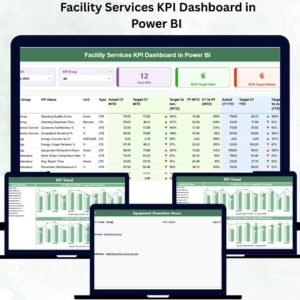
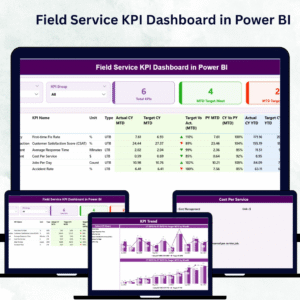
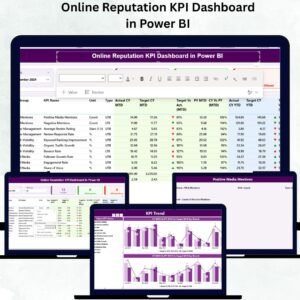
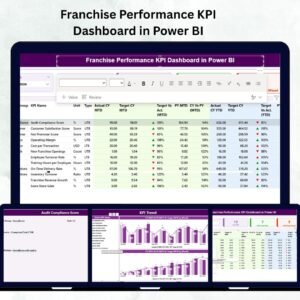
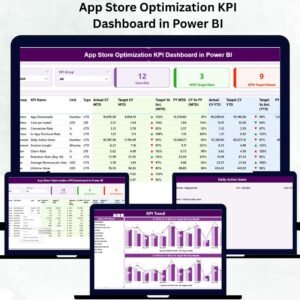
That’s where the Chiropractic Clinic KPI Dashboard in Power BI comes in. This powerful and interactive tool consolidates all essential performance metrics into one visual control panel. With real-time analytics, drill-through capabilities, and dynamic comparisons, it helps chiropractic clinics make smarter decisions, improve patient care, and boost overall efficiency.
✨ Key Features of the Chiropractic Clinic KPI Dashboard
-
📊 Summary Page for Quick Insights – View KPIs like patient visits, revenue, and staff utilization at a glance.
-
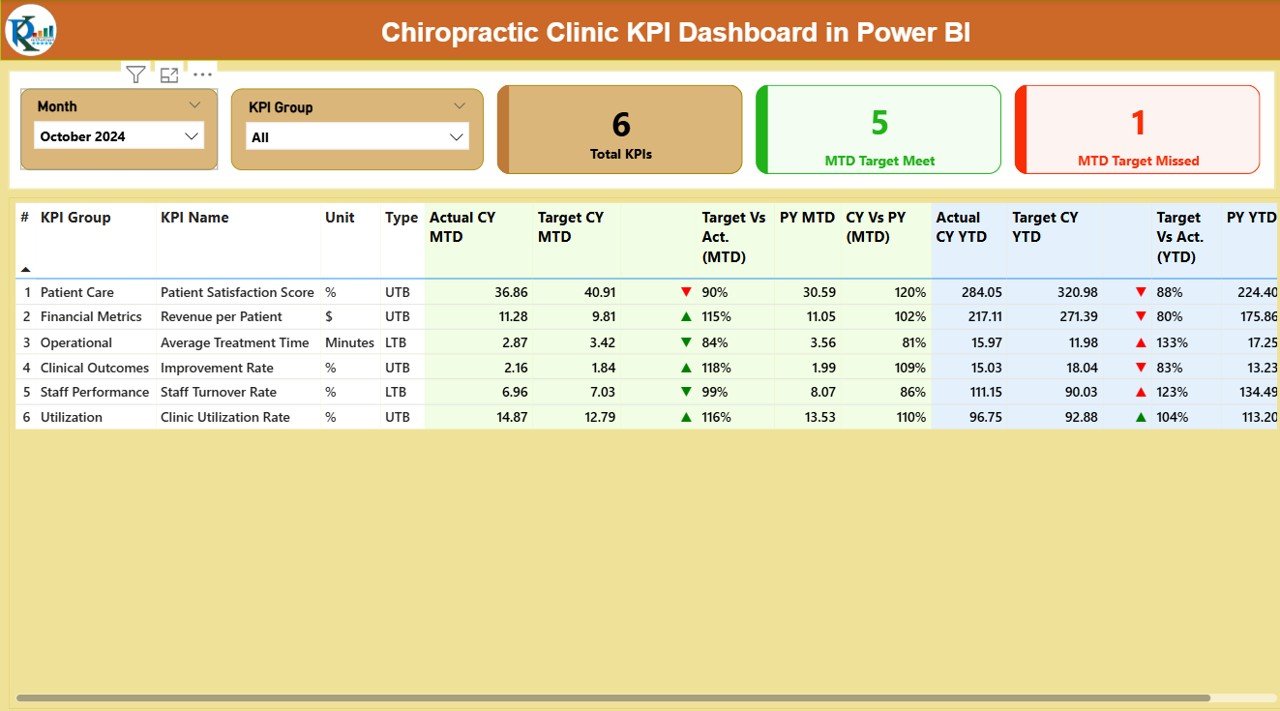
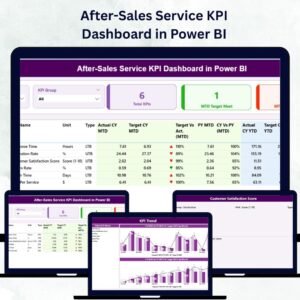
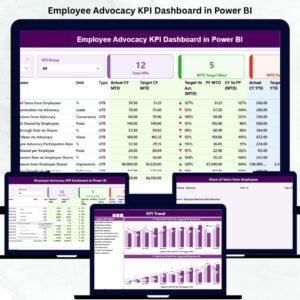
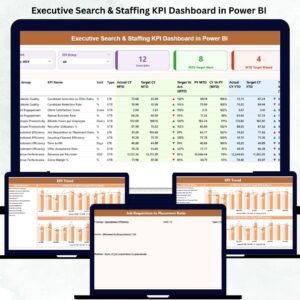
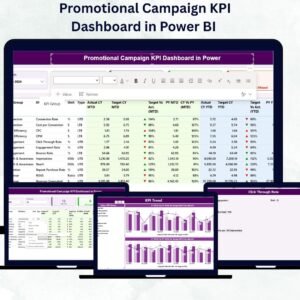
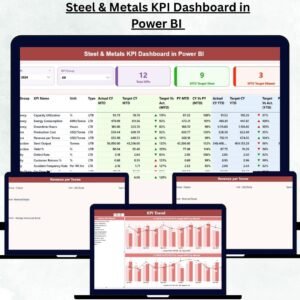
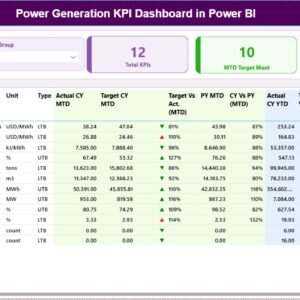
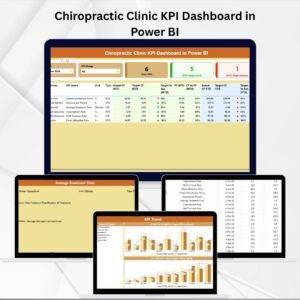
🎯 KPI Cards & Tables – Instantly see the total KPIs tracked, how many met targets, and where performance lags.
-
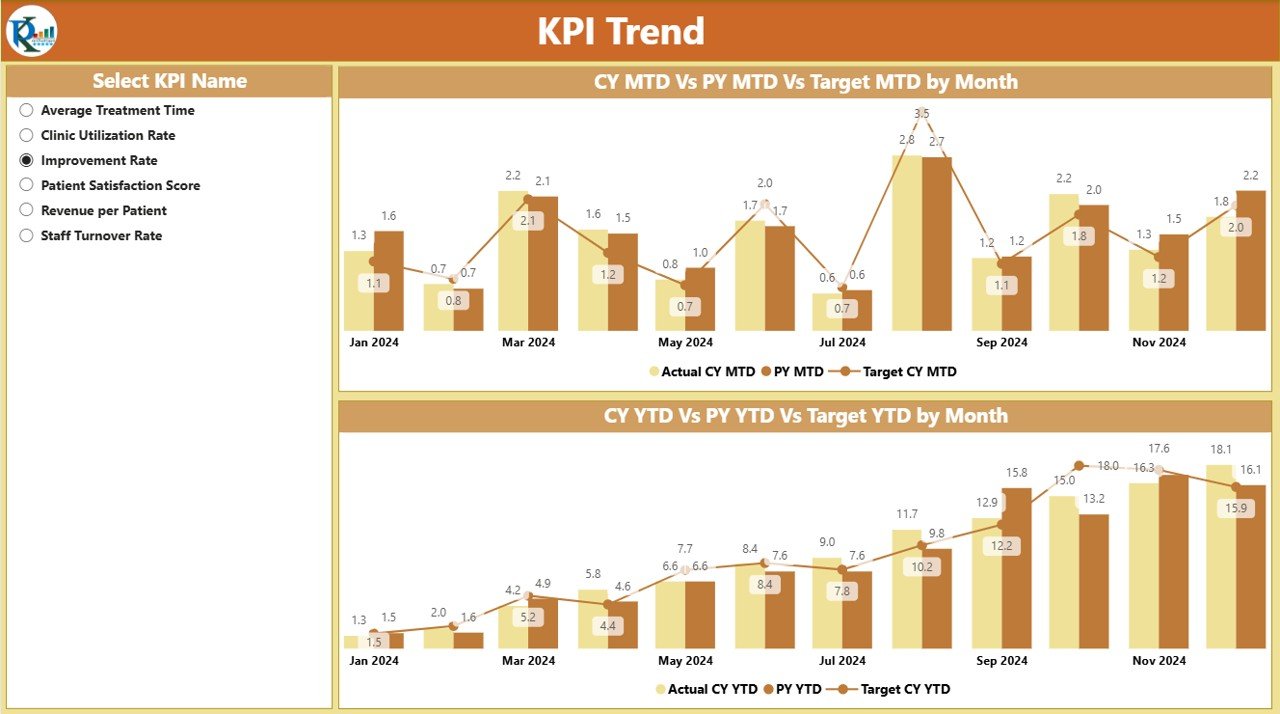
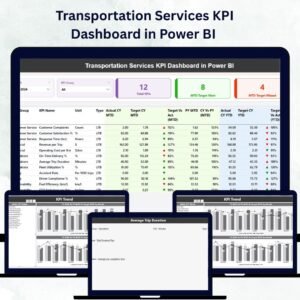
📈 KPI Trend Page – Track performance trends over time with combo charts for both Month-to-Date (MTD) and Year-to-Date (YTD).
-
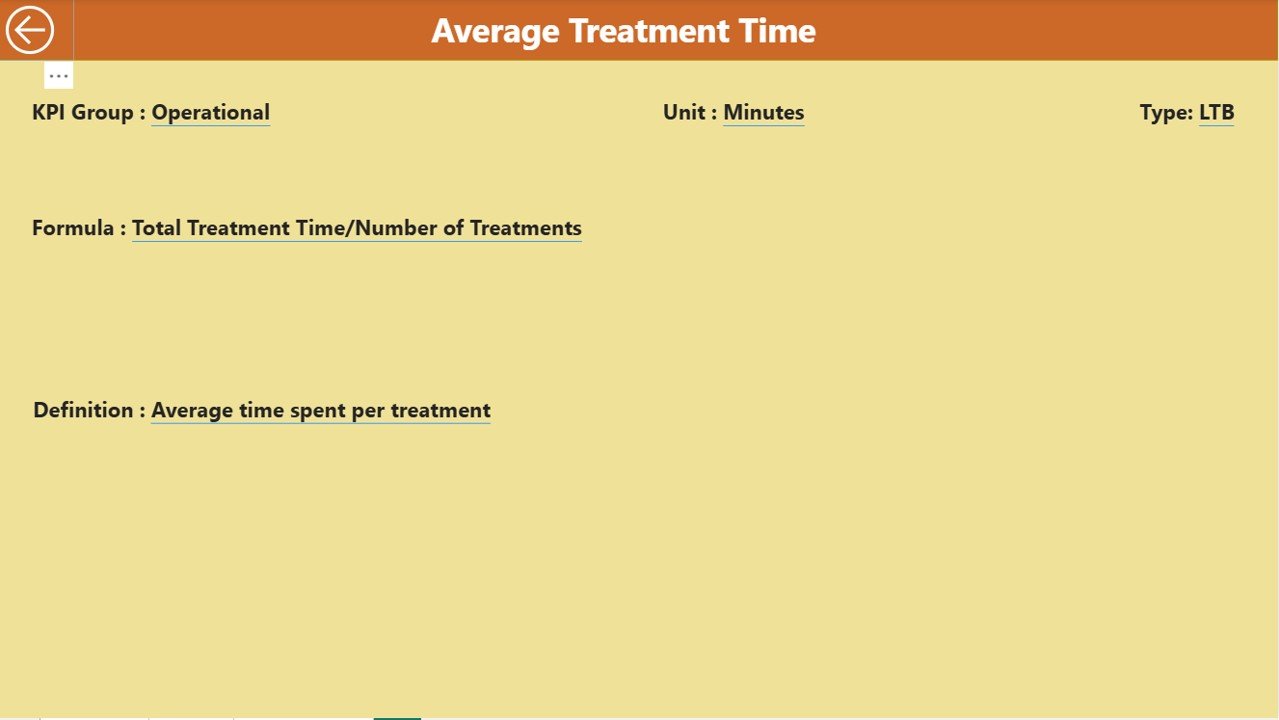
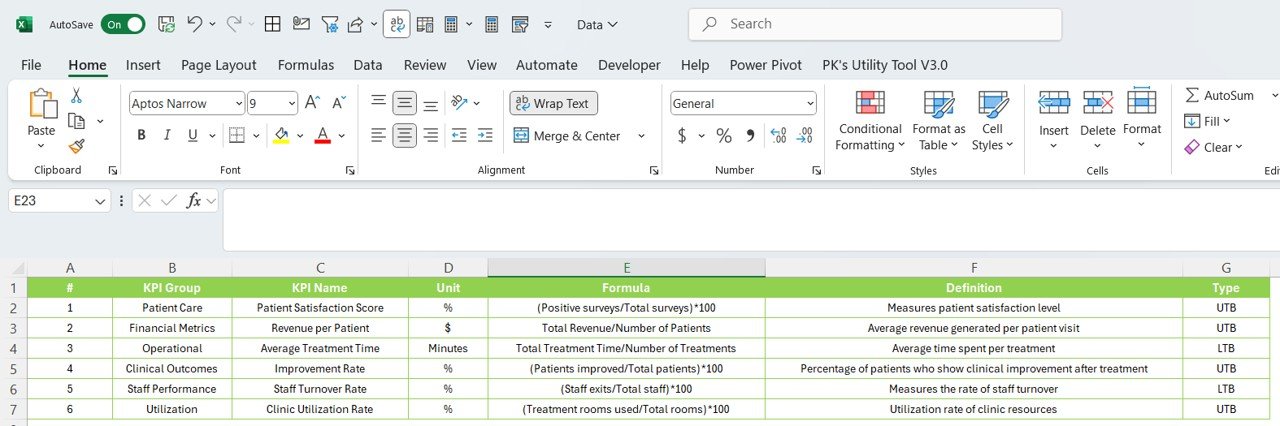
📑 KPI Definition Page – Drill through to detailed KPI definitions, including formulas, type (LTB/UTB), and calculation logic.
-
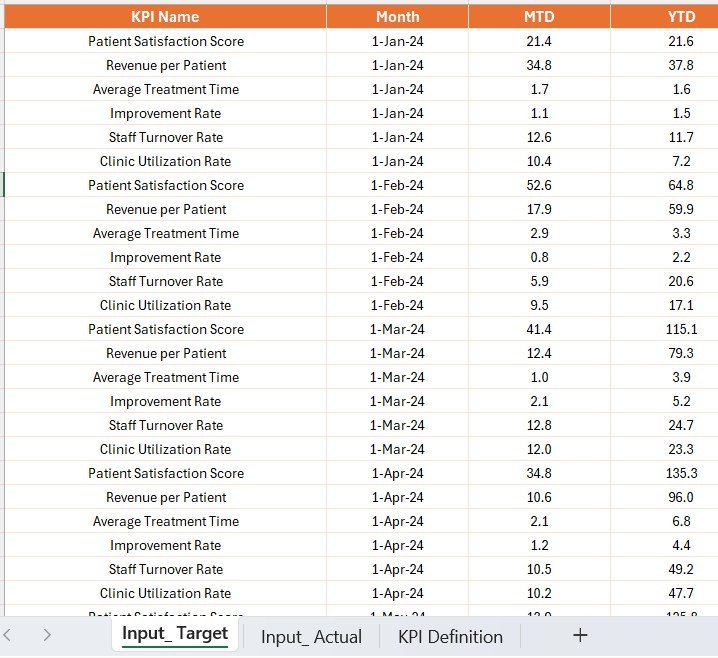
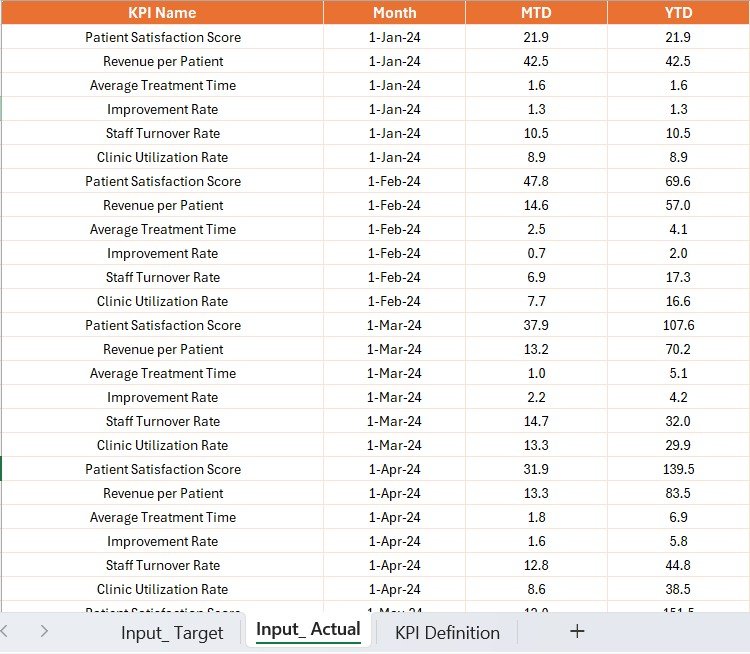
📥 Excel Data Source – Input actual, target, and previous year data in simple Excel sheets. The dashboard updates automatically.
-
🔄 Interactive Filters – Use slicers to analyze results by KPI group or time period.
-
✅ Visual Performance Indicators – Green ▲ for on-track KPIs and red ▼ for underperforming areas.
This structure makes it easy for clinic managers, doctors, and finance staff to stay aligned.
📦 What’s Inside the Dashboard
The Chiropractic Clinic KPI Dashboard in Power BI is organized into three main pages:
-
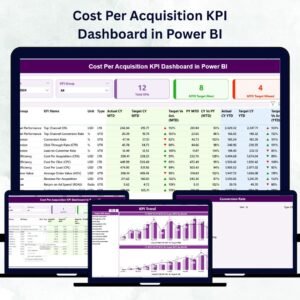
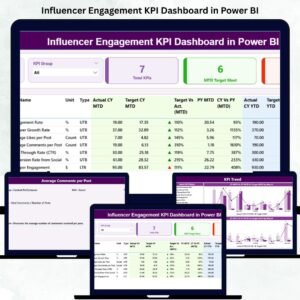
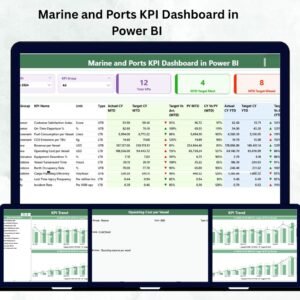
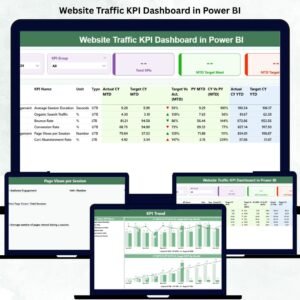
Summary Page – Displays KPI cards and detailed tables with comparisons of Actual vs Target, Current Year vs Previous Year, and progress icons.
-
KPI Trend Page – Shows historical performance trends for MTD and YTD values, helping clinics identify growth opportunities or recurring issues.
-
KPI Definition Page – A drill-through reference that explains every KPI with formula, unit, and type, ensuring clarity and transparency.
The data source is structured in Excel sheets:
-
Input_Actual– Fill in monthly actuals for KPIs. -
Input_Target– Define monthly and yearly targets. -
KPI Definition– Maintain KPI names, formulas, and definitions.
🛠️ How to Use the Chiropractic Clinic KPI Dashboard
-
Enter Actual Data – Update KPI performance numbers in the Excel
Input_Actualsheet. -
Set Targets – Record clinic goals in the
Input_Targetsheet. -
Update Definitions – Customize or add KPIs in the
KPI Definitionsheet. -
Load into Power BI – Refresh the dashboard to visualize updated data.
-
Analyze Trends – Use slicers and charts to explore performance by month, year, or KPI category.
-
Take Action – Use insights to reduce wait times, improve staff efficiency, or enhance revenue.
👥 Who Can Benefit from This Dashboard?
-
🩺 Clinic Owners – Monitor revenue, costs, and patient satisfaction.
-
👩⚕️ Doctors – Track treatment success rates and patient retention.
-
👨💼 Managers – Ensure staff productivity and reduce appointment no-shows.
-
📊 Finance Teams – Review revenue, insurance claims, and cost efficiency.
-
🧑💻 Operations Staff – Monitor resource allocation and inventory usage.
🎯 Advantages of the Chiropractic Clinic KPI Dashboard in Power BI
-
📍 Centralized View – One dashboard for all key metrics.
-
⚡ Real-Time Analytics – Get updated numbers instantly.
-
📈 Performance Comparisons – Track actual vs target and current vs previous year.
-
🎨 Interactive Visuals – Simplify complex data with easy-to-read visuals.
-
💡 Better Decision-Making – Spot trends early and act fast.
-
💲 Cost-Efficient – Built in Power BI with Excel inputs, reducing the need for expensive systems.
🚀 Opportunities for Improvement
Enhance your dashboard further by:
-
🔔 Adding automated alerts when KPIs fall below target.
-
📱 Optimizing for mobile to view on-the-go.
-
🤖 Using AI & predictive analytics to forecast patient visits or revenue.
-
🌐 Integrating directly with EMR or clinic management software.
-
💬 Incorporating patient survey data for deeper satisfaction insights.
🏆 Best Practices
-
Keep KPIs relevant and aligned with clinic goals.
-
Update Excel sheets regularly for accurate insights.
-
Train staff to understand KPI definitions and targets.
-
Review monthly performance in team meetings.
-
Balance patient care KPIs with financial and operational metrics.
🌍 Real-World Applications
-
Track patient retention rates to ensure long-term loyalty.
-
Monitor insurance claim approvals to improve financial flows.
-
Analyze average appointment duration for operational efficiency.
-
Compare revenue per patient across months or years.
-
Optimize staff utilization to reduce idle time.


Reviews
There are no reviews yet.