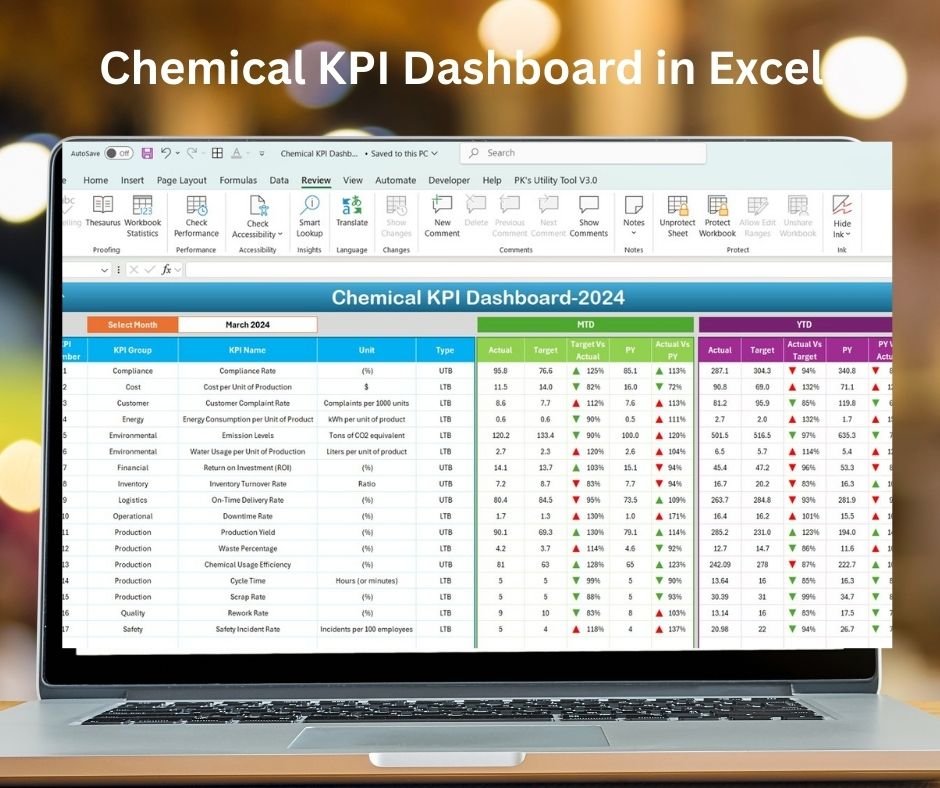
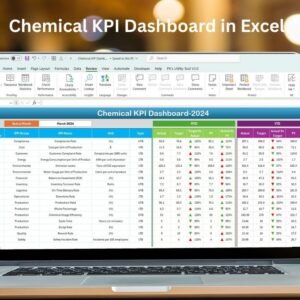
The Chemical KPI Dashboard in Excel is a specialized tool designed for businesses in the chemical industry to track and optimize key performance indicators (KPIs) that are crucial for maintaining operational efficiency and ensuring safety standards. Whether you’re managing a chemical plant, research lab, or manufacturing facility, this dashboard enables you to monitor vital metrics such as production efficiency, inventory levels, quality control, and safety compliance.
This Excel-based dashboard provides real-time insights into critical data, helping chemical industry professionals make data-driven decisions to improve productivity, reduce waste, and ensure compliance with industry regulations. With easy-to-read graphs, interactive charts, and customizable features, this tool is perfect for managers, production supervisors, and safety officers looking to improve operations.
Key Features of the Chemical KPI Dashboard in Excel:
📊 Comprehensive KPI Tracking
Track various KPIs including production efficiency, quality control, safety compliance, and inventory levels—all in one dashboard.
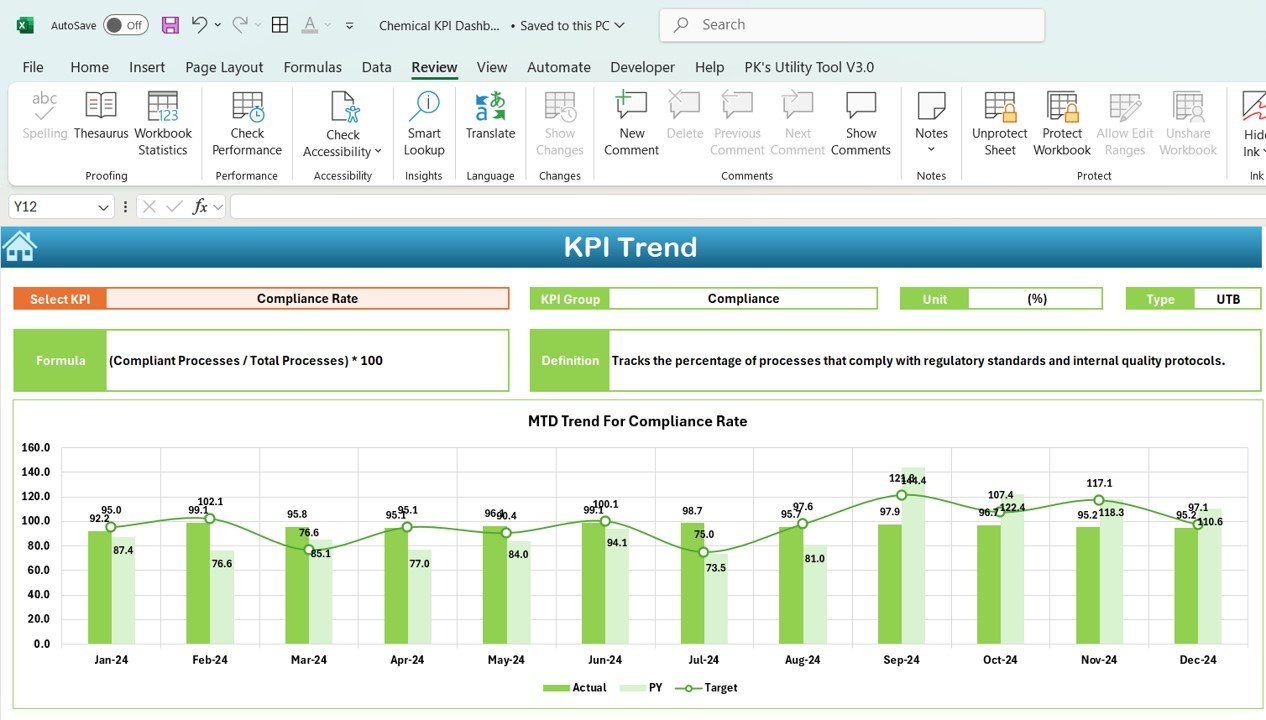
📈 Real-Time Performance Monitoring
Stay updated with real-time data on chemical production, safety incidents, and product quality to ensure smooth operations.
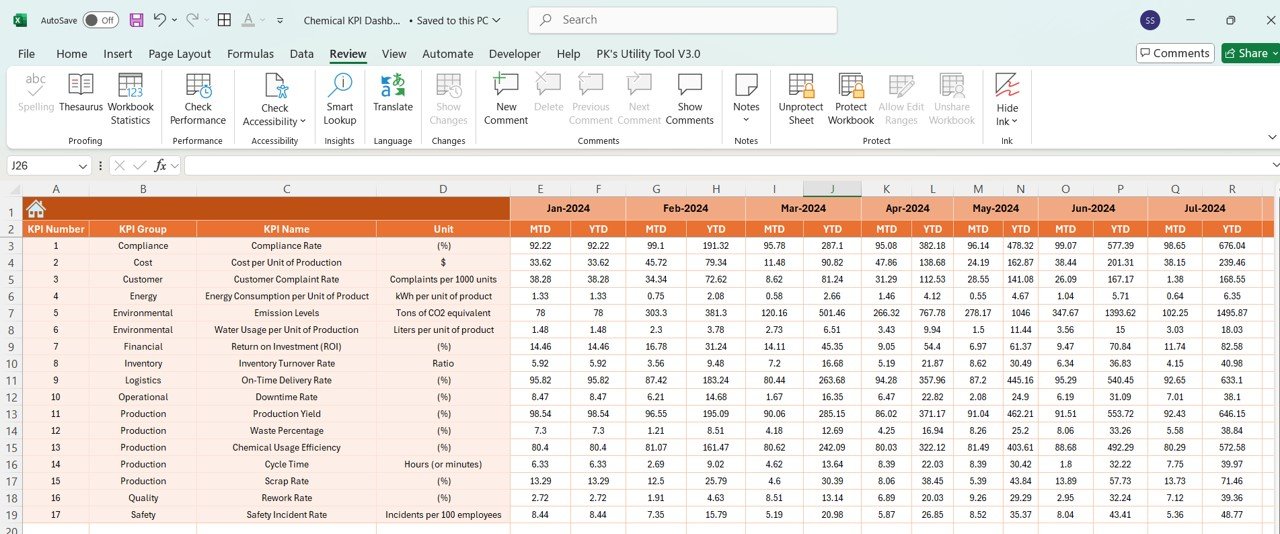
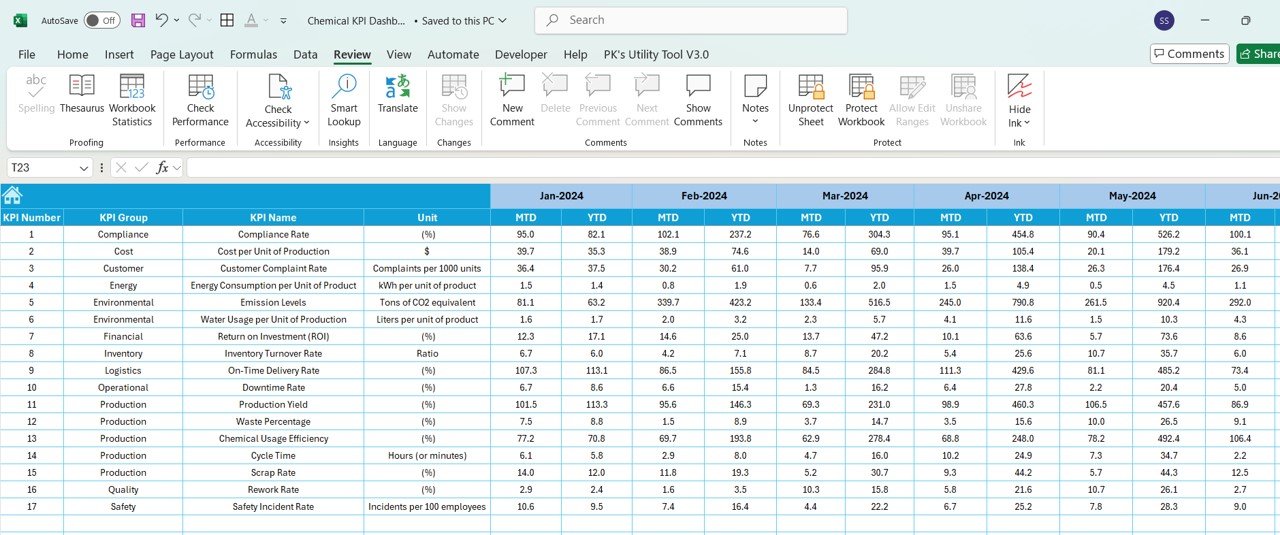
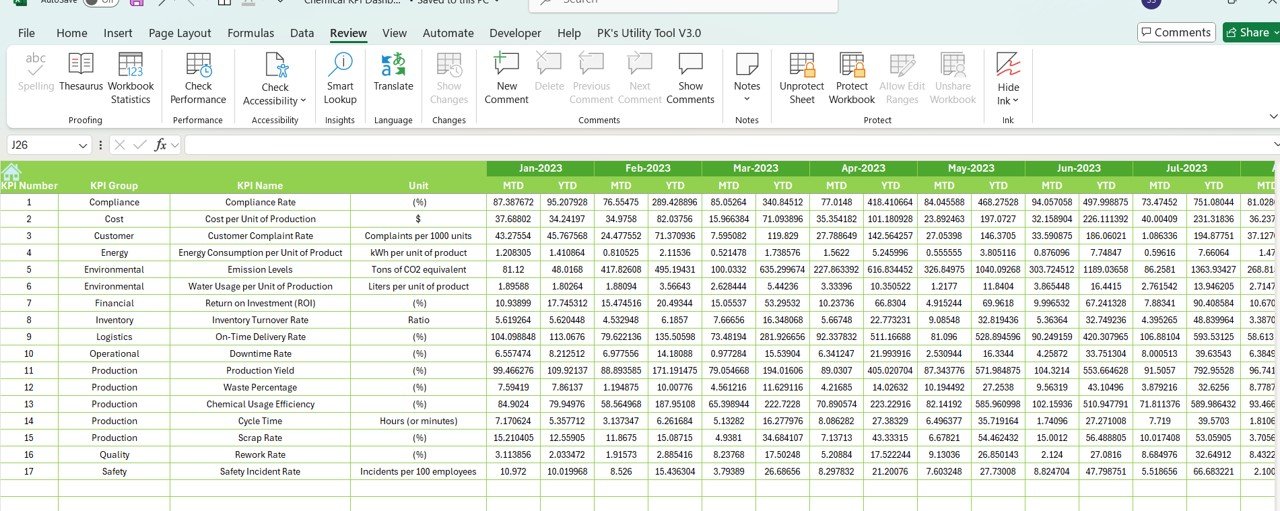
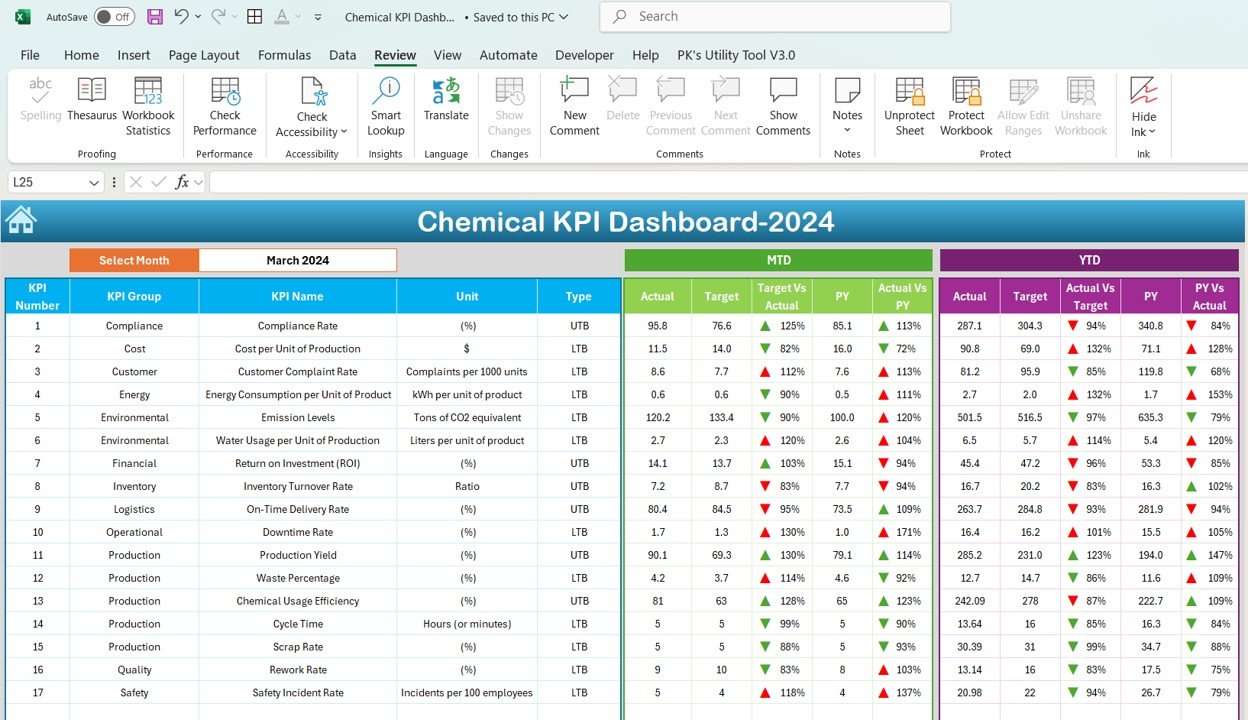
📅 Month-to-Date (MTD) and Year-to-Date (YTD) Comparison
Analyze performance across monthly and yearly periods to track long-term trends and identify areas for improvement.
🎯 Goal Setting and Performance Comparison
Set specific KPI targets for production volume, quality control, and safety measures and compare them with actual performance to ensure that your operations remain on track.
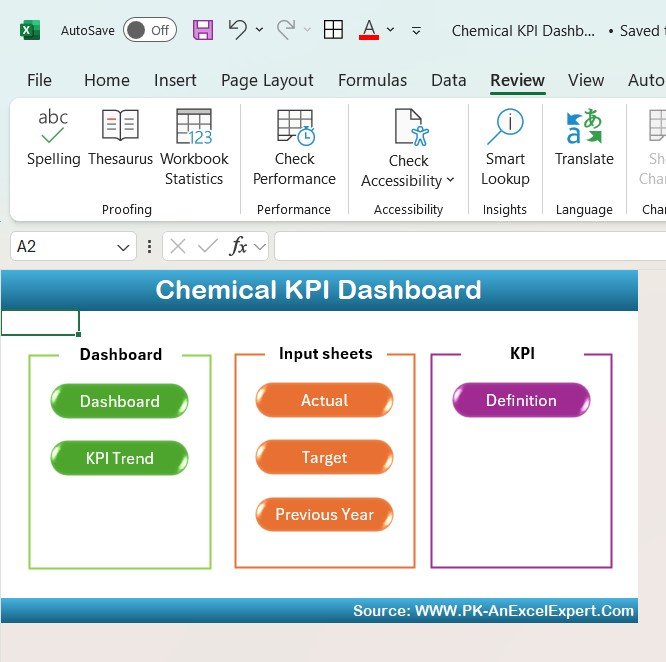
🛠 Customizable Inputs
Easily input your production data and adjust KPIs to reflect the unique needs of your chemical production processes, such as raw material usage, batch consistency, and product yield.
🔔 Conditional Formatting Alerts
Receive visual alerts for key performance indicators that require immediate attention, such as production delays, safety incidents, or quality issues, using color-coded indicators.
⚙️ Production Efficiency and Inventory Monitoring
Monitor how efficiently raw materials are used, track inventory levels, and ensure that production processes are running at optimal capacity.
🚀 Why You’ll Love the Chemical KPI Dashboard in Excel:
✅ Optimize Production Efficiency – Track critical production metrics in real time to ensure that your plant or facility operates at peak performance.
✅ Enhance Safety Compliance – Monitor safety KPIs and reduce incidents by staying up-to-date with compliance regulations and safety standards.
✅ Improve Quality Control – Ensure product consistency and quality by tracking quality-related KPIs and identifying potential issues early.
✅ User-Friendly Interface – The dashboard is designed for non-technical users, making it easy for anyone to input data and interpret performance metrics.
✅ Customizable for Chemical Businesses – Tailor the dashboard to meet the specific needs of your chemical production processes, ensuring it aligns with your operational goals.
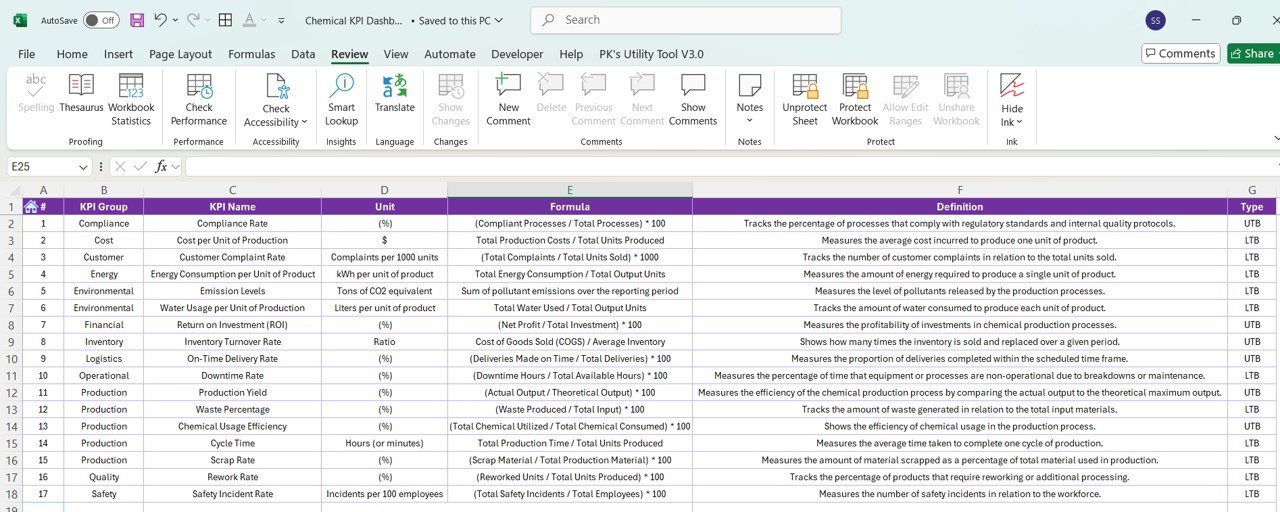
What’s Inside the Chemical KPI Dashboard in Excel:
- Production Efficiency KPI: Track production output against set targets to optimize manufacturing processes.
- Quality Control KPI: Measure the quality of products, including defect rates and batch consistency.
- Inventory Management KPI: Monitor raw material usage, inventory levels, and material waste to reduce excess stock and improve cost-efficiency.
- Safety Compliance KPI: Track safety incidents, compliance with safety protocols, and regulatory standards.
- Chemical Waste KPI: Monitor chemical waste production, disposal rates, and efficiency to ensure that waste management processes meet environmental standards.
- Cost Efficiency KPI: Measure operational costs relative to production volume to improve financial performance.
How to Use the Chemical KPI Dashboard in Excel:
1️⃣ Download the Template – Gain instant access to your Excel file upon purchase.
2️⃣ Input Your Data – Enter your chemical production data, including quantities, raw materials, and quality control results.
3️⃣ Set Targets – Define performance targets for production, safety, inventory, and quality control.
4️⃣ Track Progress – Monitor key metrics in real time and adjust strategies as needed to meet your business objectives.
5️⃣ Generate Reports – Use the dashboard to create performance reports for internal reviews, client meetings, or regulatory reporting.
Who Can Benefit from the Chemical KPI Dashboard in Excel:
- Chemical Plant Managers
- Production Supervisors
- Safety Officers
- Quality Control Managers
- Inventory Managers
- Environmental Compliance Officers
- Business Owners in the Chemical Industry
The Chemical KPI Dashboard in Excel is an essential tool for any chemical business aiming to improve production efficiency, maintain high product quality, and ensure safety compliance across operations.
Click here to read the Detailed blog post
https://www.pk-anexcelexpert.com/chemical-kpi-dashboard-in-excel/
Visit our YouTube channel to learn step-by-step video tutorials
Youtube.com/@PKAnExcelExpert


Reviews
There are no reviews yet.