
Change is one of the toughest challenges every organization faces. Whether it’s adopting new technology, improving processes, or handling market shifts, businesses must adapt quickly. But without the right tools, change efforts often fail. That’s why we created the Change Management KPI Dashboard in Excel – a ready-to-use, structured, and powerful solution to monitor change performance and ensure success.
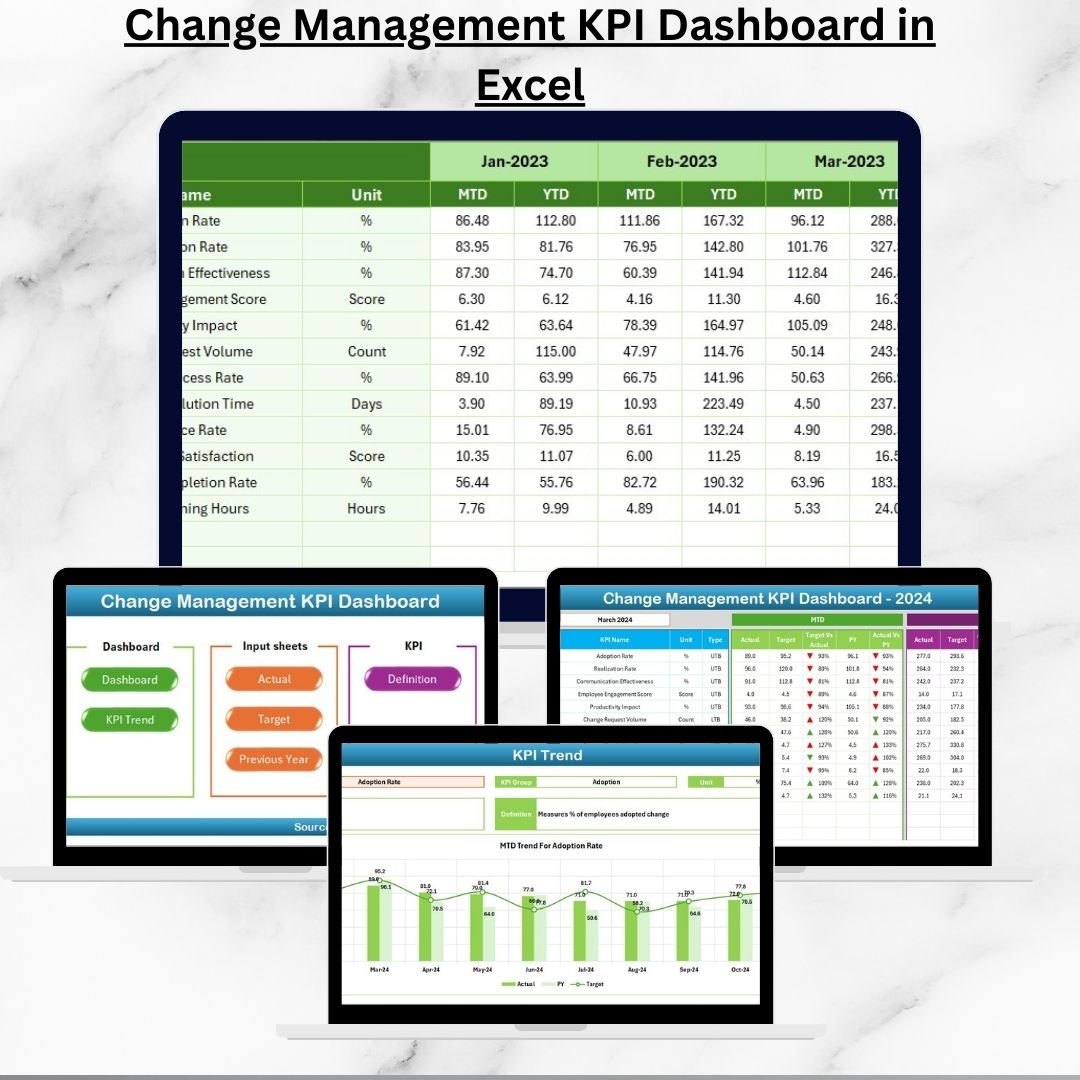
This Excel-based dashboard consolidates all your Key Performance Indicators (KPIs) into one place, so leaders, managers, and teams can track adoption, training, communication, and timelines with ease. It saves hours of manual reporting and gives you real-time insights into how change is actually happening across your organization.
With automated formulas, dynamic visuals, and a user-friendly layout, this dashboard turns complexity into clarity – helping you manage transitions, reduce resistance, and achieve results faster.
✨ Key Features of Change Management KPI Dashboard in Excel
-
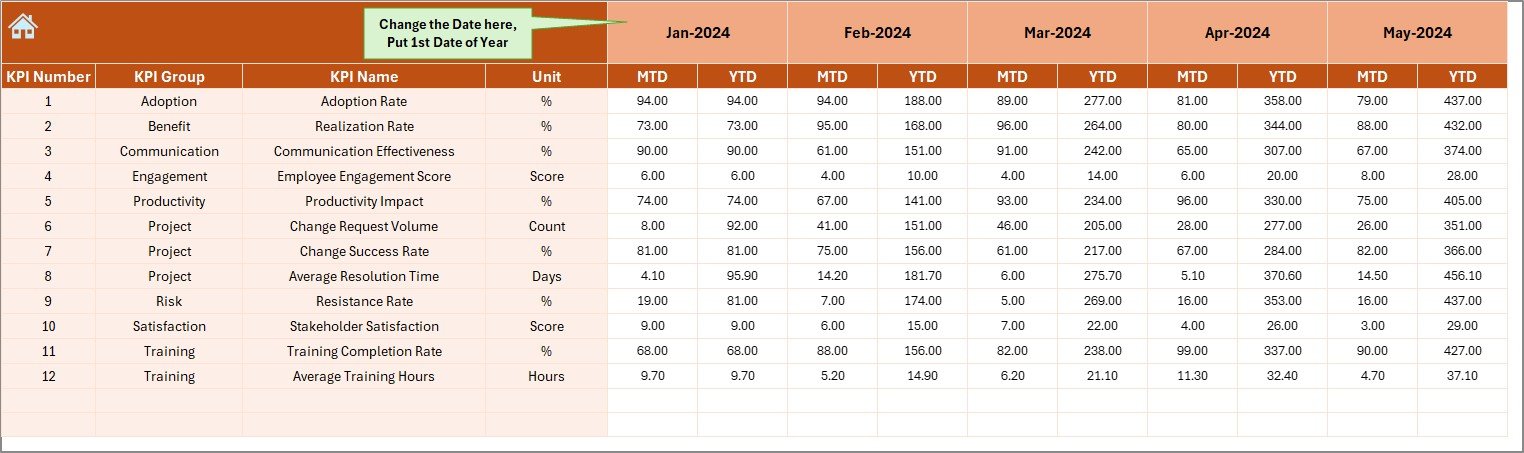
📊 All-in-One Dashboard – View adoption, training, communication, and implementation performance in one place.
-
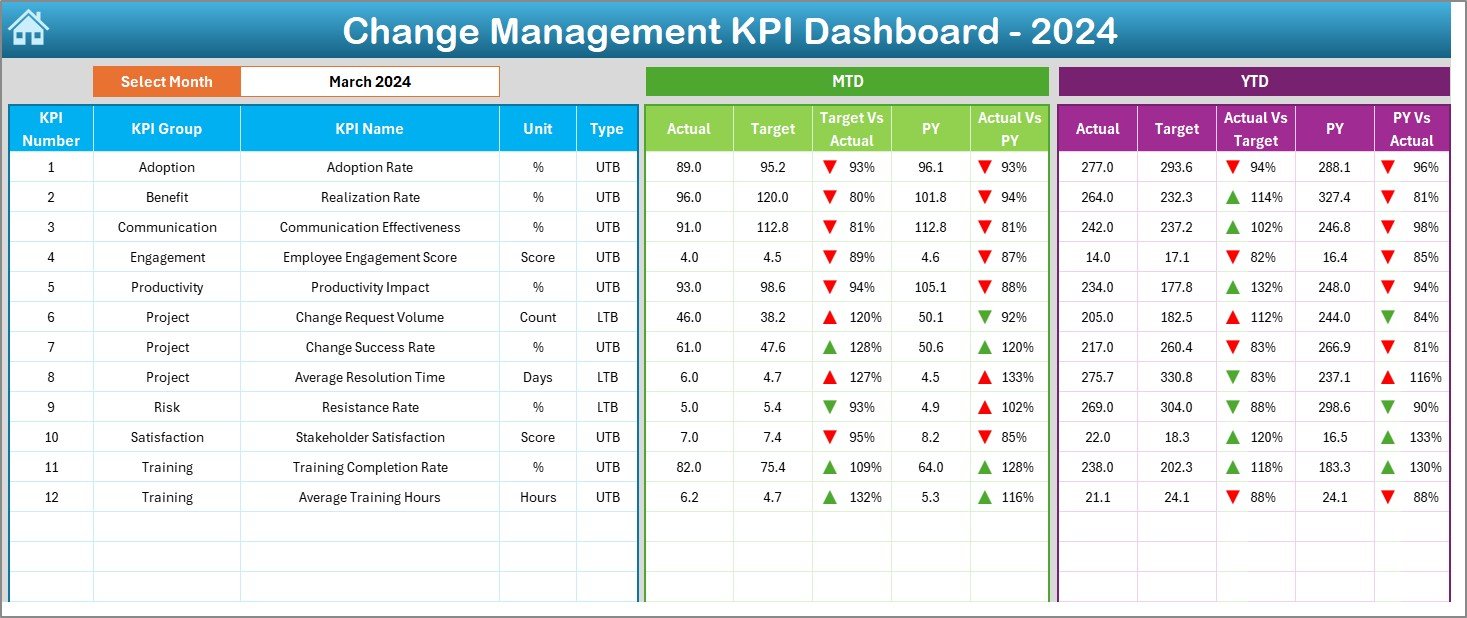
⏱️ Month & Year Selector – Switch between Month-to-Date (MTD) and Year-to-Date (YTD) results with a simple drop-down.
-
📈 Visual Performance Indicators – Target vs. Actual comparisons, color-coded arrows, and trend charts for instant insights.
-
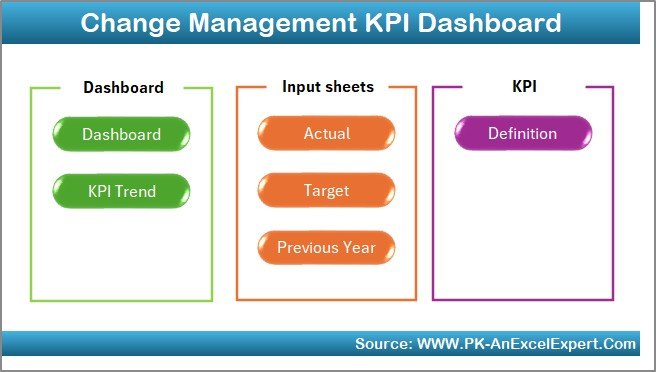
🗂️ Structured Worksheets – Includes Home, Dashboard, KPI Trend, Actual Numbers, Targets, Previous Year Data, and KPI Definitions.
-
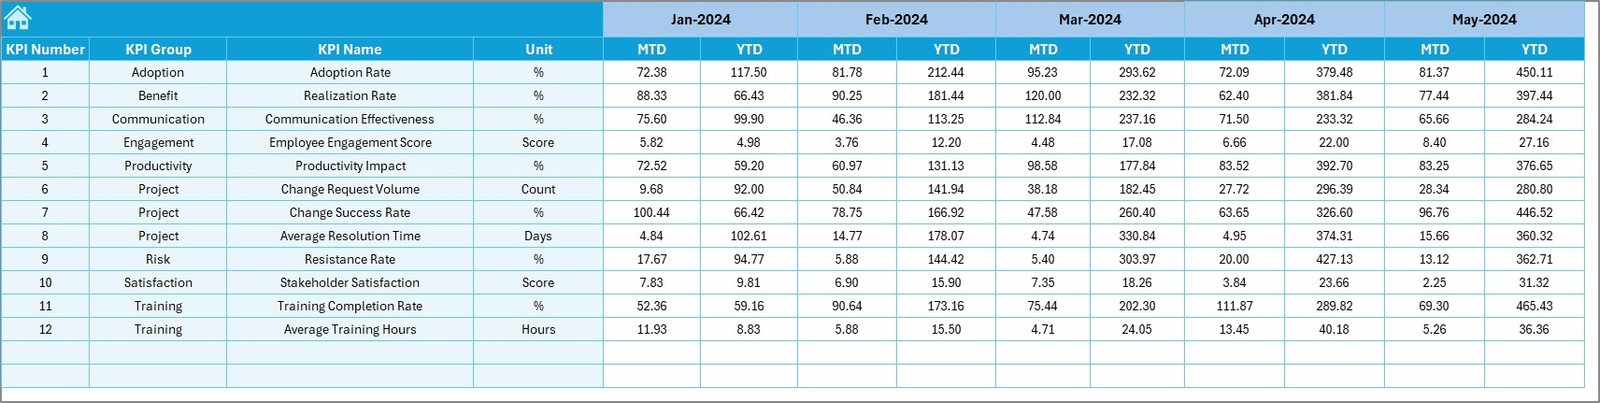
🔄 Historical Comparison – Measure current performance against past years to track progress.
-
🛠️ Fully Customizable – Add, edit, or remove KPIs to match your organization’s specific change goals.
-
⚡ Time-Saving Automation – No more manual calculations—everything updates instantly when you enter new data.

📦 What’s Inside the Change Management KPI Dashboard
-
Home Sheet – Quick navigation with 6 shortcut buttons.
-
Dashboard Sheet – Comprehensive view of all KPIs with interactive month selection.
-
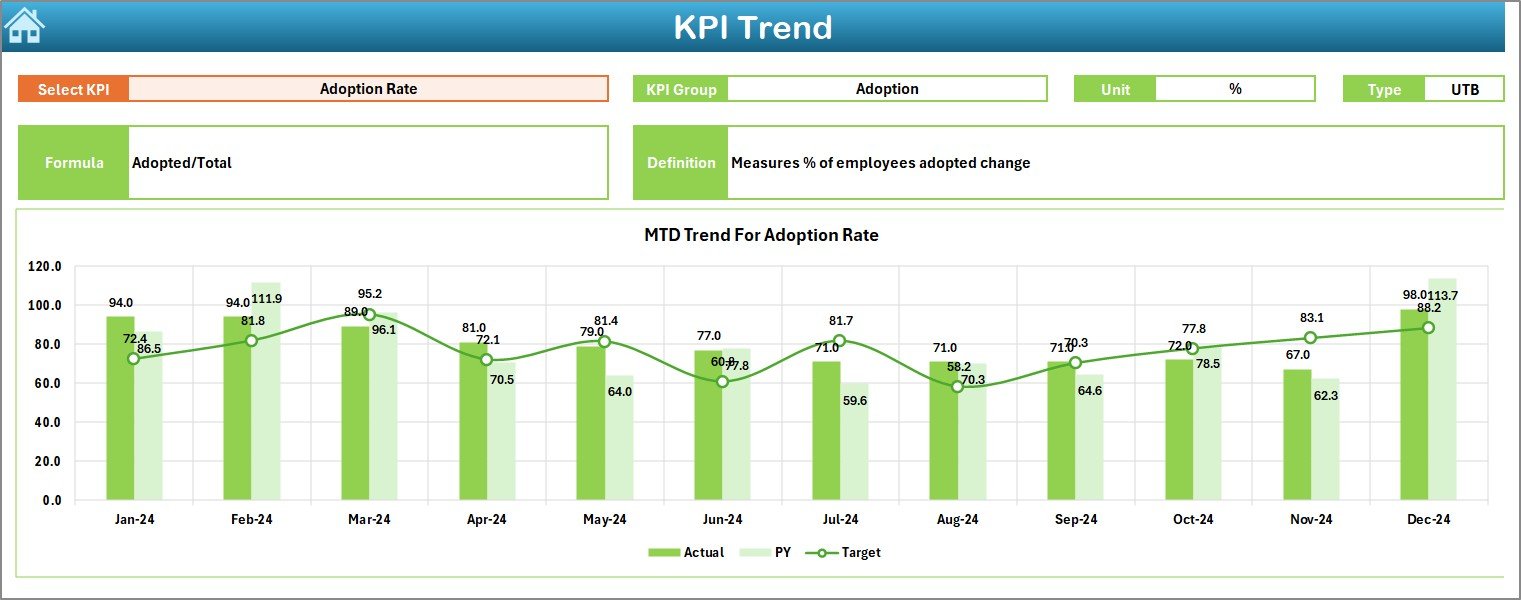
KPI Trend Sheet – Drop-down based analysis of individual KPIs with charts and comparisons.
-
Actual Numbers Input Sheet – Record monthly actual performance with structured fields.
-
Target Sheet – Define realistic benchmarks for both MTD and YTD values.
-
Previous Year Numbers Sheet – Store and compare last year’s performance.
-
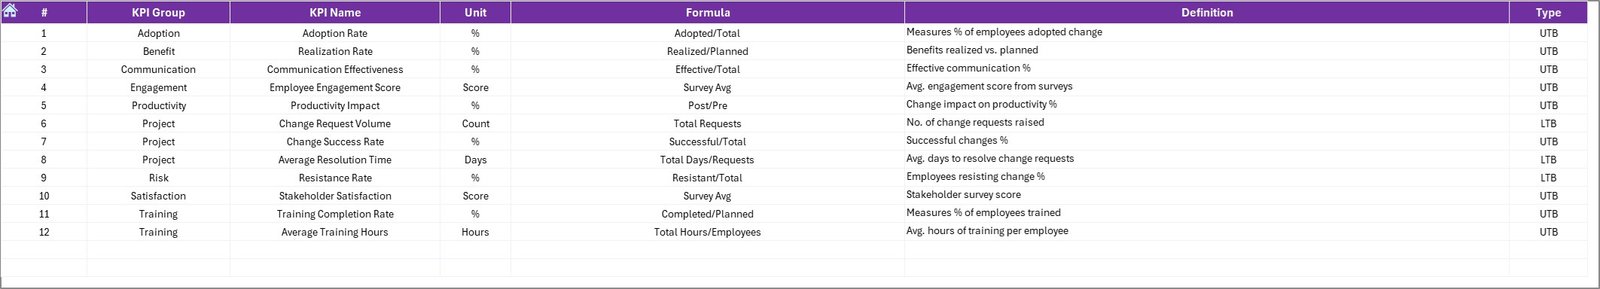
KPI Definition Sheet – A reference guide explaining each KPI’s formula, unit, and type.
🛠️ How to Use the Change Management KPI Dashboard
-
Enter Your Data – Input actual performance figures in the “Actual Numbers” sheet.
-
Set Benchmarks – Define targets in the “Target Sheet” to measure progress.
-
Track KPIs – Switch between MTD and YTD data on the Dashboard tab to see performance instantly.
-
Analyze Trends – Use the KPI Trend sheet to evaluate adoption, training, or communication over time.
-
Make Data-Driven Decisions – Compare current vs. past performance to identify risks and take corrective actions early.
👥 Who Can Benefit from This Dashboard?
-
🏢 Business Leaders & Managers – Get a transparent view of change adoption across the organization.
-
💻 IT Teams – Track new software or system rollouts effectively.
-
🧑💼 HR Departments – Measure policy implementation, training completion, and employee engagement.
-
📊 Finance Teams – Ensure compliance with new reporting standards.
-
🛠️ Operations & Manufacturing – Monitor automation adoption and process improvements.
-
🎯 Consultants & Change Experts – Provide clients with professional-grade performance tracking tools.
With the Change Management KPI Dashboard in Excel, you’ll never have to guess how change is performing. Instead, you’ll have reliable, easy-to-read data that helps you spot risks early, improve communication, and achieve smoother transitions.
Take control of your organizational change journey today with this must-have Excel template!
Click here to read the Detailed blog post
Watch the step-by-step video tutorial:
Visit our YouTube channel to learn step-by-step video tutorials 👉 PKAnExcelExpert YouTube Channel


Reviews
There are no reviews yet.