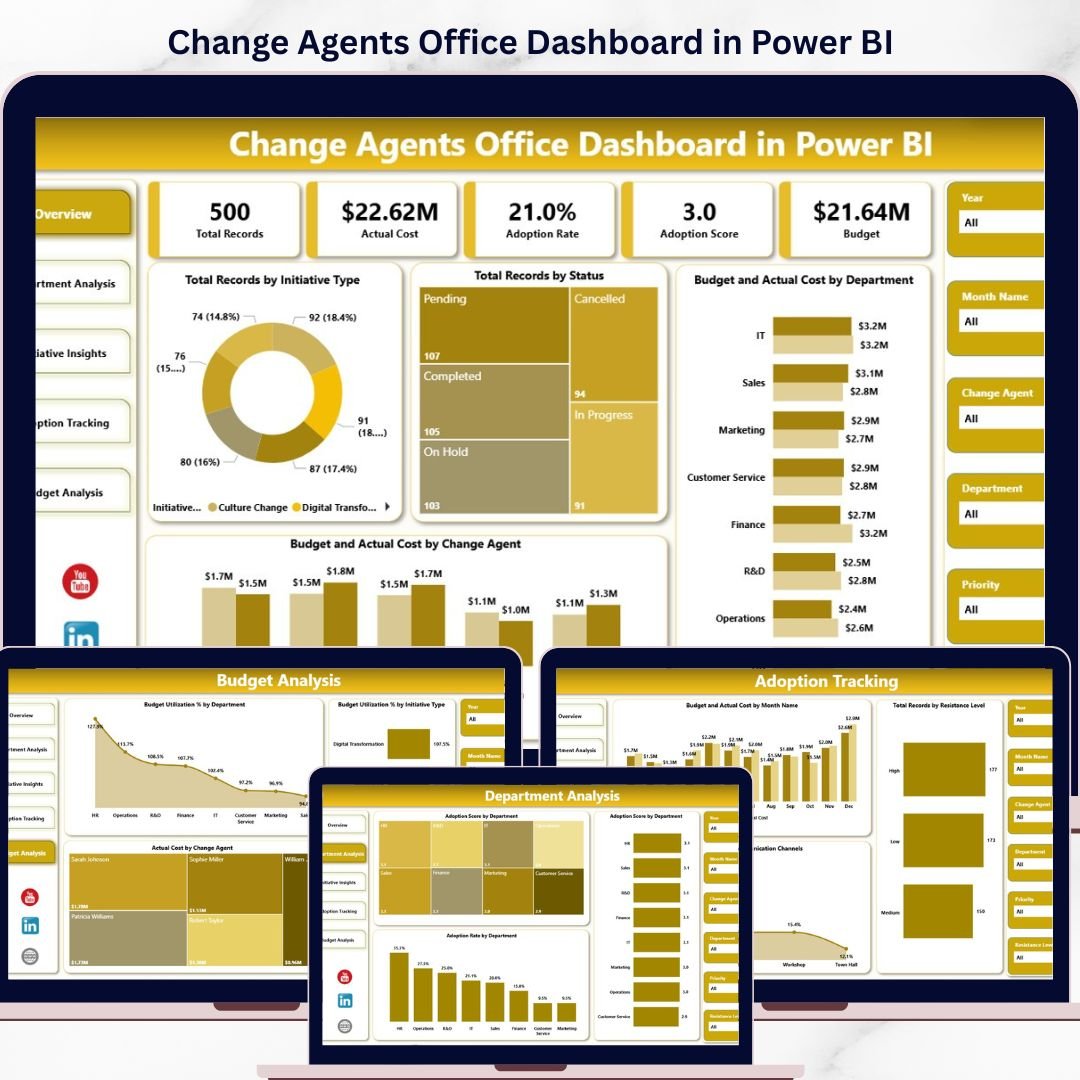
Change Agents Office Dashboard in Power BI is the ultimate analytics solution for organizations that want to drive transformation with data-driven precision. Whether you are overseeing change initiatives, monitoring adoption rates, tracking budget utilization, or evaluating change agent performance, this interactive Power BI dashboard puts every critical metric at your fingertips in real time.
If your change management data is scattered across spreadsheets and disconnected reports, it is time for a smarter approach. The Change Agents Office Dashboard in Power BI consolidates your entire transformation ecosystem into one dynamic, filterable, and visually compelling Power BI dashboard — no complex setup, no IT tickets, and no steep learning curve. Just connect your data, refresh, and your change management command center is live.
🔑 Key Features of Change Agents Office Dashboard in Power BI
📊 Dynamic KPI Cards — Monitor Total Budget, Total Actual Cost, Total Records, Total Stakeholders, and Total Training Sessions instantly from one centralized overview.
📈 5 Interactive Dashboard Pages — From high-level overview to deep department analysis, initiative insights, adoption tracking, and budget analysis, every page delivers focused, targeted insights for decision makers.
🎯 Powerful Slicers and Filters — Slice data by department, initiative type, status, change agent, resistance level, communication channel, and more to get the exact view you need instantly.
⚡ Real-Time Data Refresh — Connect your Excel, database, or cloud source and hit Refresh to update all visuals across every page automatically.
🔄 Budget vs Actual Cost Tracking — Identify cost overruns, optimize resource allocation, and keep your change program financially on track with visual comparisons by department and change agent.
📅 Adoption Rate Monitoring — Measure adoption scores, resistance levels, stakeholder engagement, and training effectiveness to understand whether change is truly being embraced across the organization.
🎨 Professional Visual Design — Clean, modern chart layouts with consistent color coding make this dashboard perfect for executive presentations and leadership updates.
🧩 Fully Customizable — Modify charts, colors, KPIs, and data connections to match your specific change management reporting needs.
📦 What’s Inside the Change Agents Office Dashboard in Power BI
📋 Page 1 — Overview Page
Your high-level command center displaying KPI cards for Total Budget, Total Actual Cost, Total Records, Total Stakeholders, and Total Training Sessions. Charts include Total Budget vs Total Actual Cost by Department, Total Records by Initiative Type, Total Records by Status, and Total Budget vs Total Actual Cost by Change Agent — all backed by interactive slicers for instant filtering.
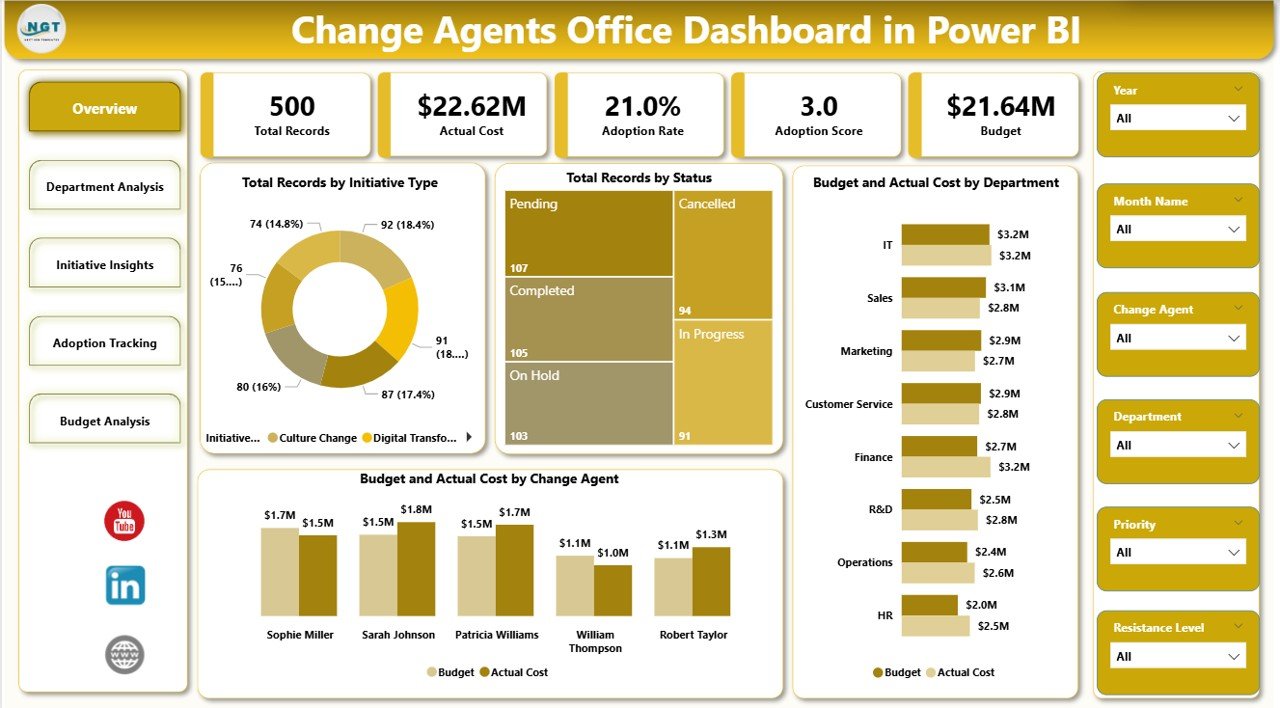
Overview Page
📋 Page 2 — Department Analysis
Drill into department-level performance across all key change metrics. Charts cover Total Stakeholders by Department, Total Training Sessions by Department, Avg. Adoption Score by Department, and Total Budget by Initiative Type — giving leaders a clear view of which departments are most engaged and best resourced for change.
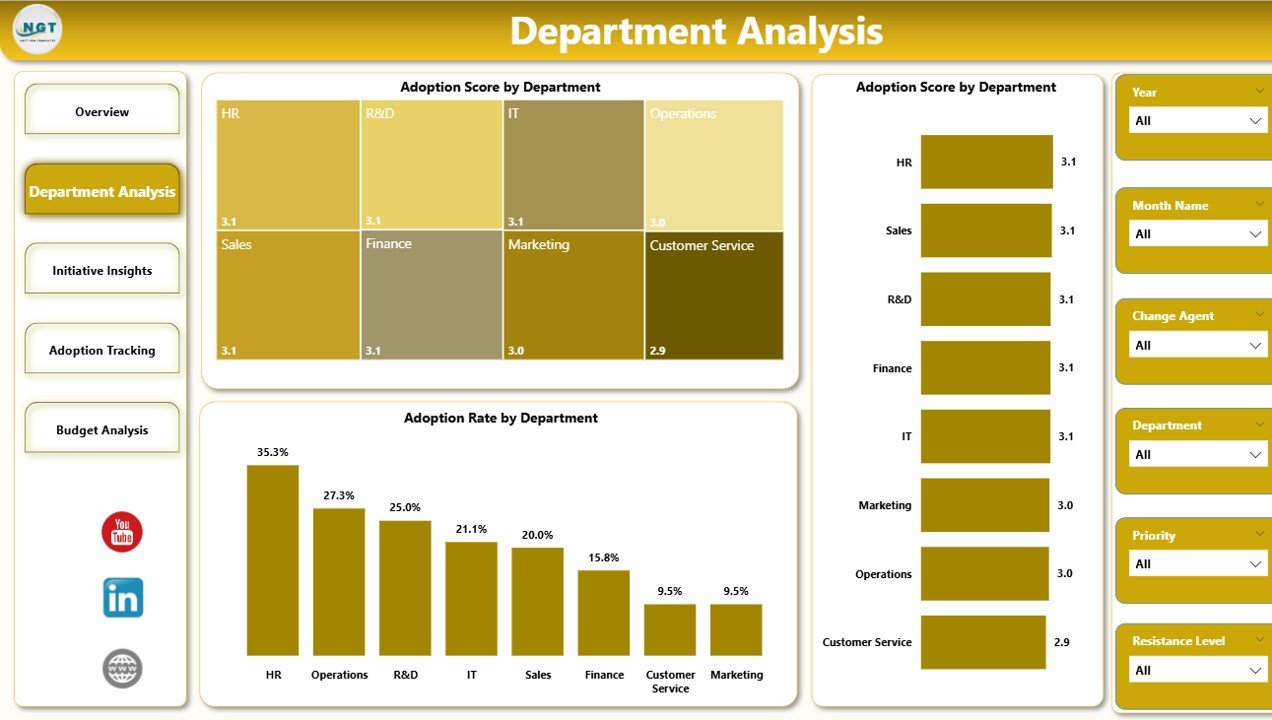
Department Analysis
📋 Page 3 — Initiative Insights
Explore the health, priority, and adoption performance of every change initiative. Charts include Total Records by Priority, Avg. Adoption Score by Initiative Type, Total Records by Stakeholder Group, and Adoption Rate % by Month — providing program managers a complete picture of initiative momentum and adoption trends over time.
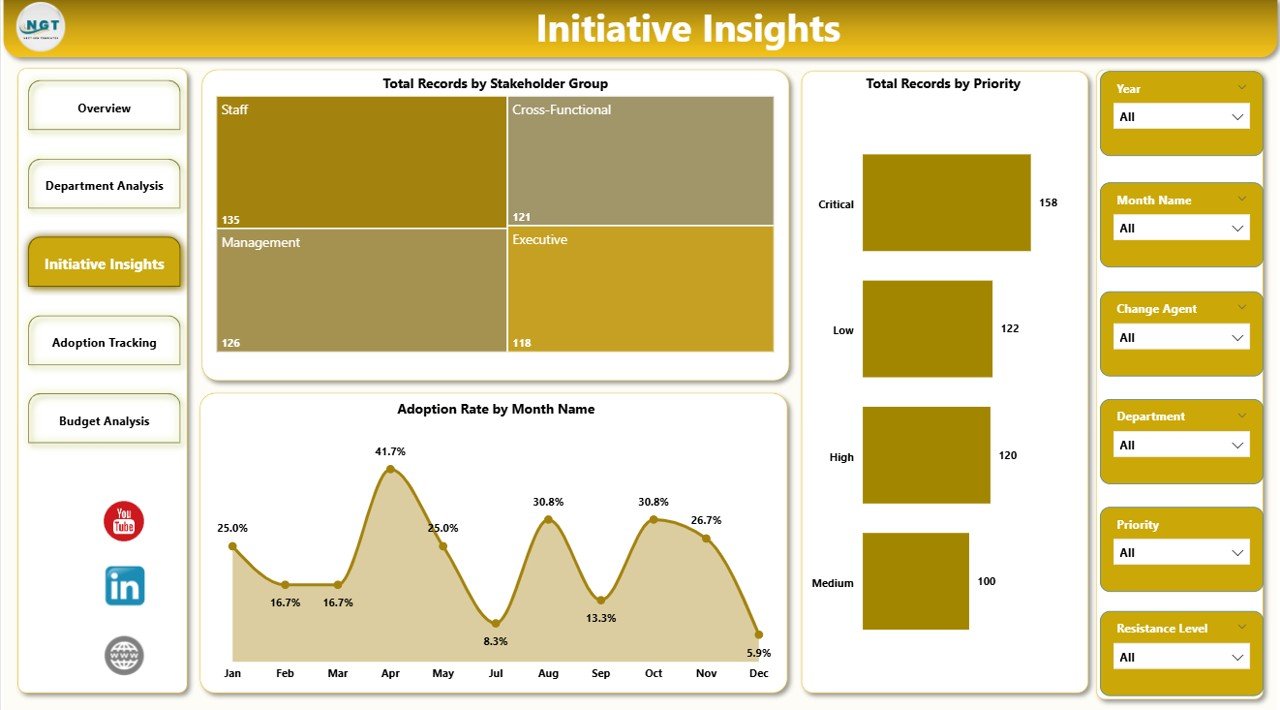
Initiative Insights
📋 Page 4 — Adoption Tracking
Measure resistance, communication effectiveness, and adoption quality across the organization. Charts include Total Records by Resistance Level, Total Records by Communication Channels, Avg. Adoption Score by Impact Level, and Total Budget vs Total Actual Cost by Month — the metrics that reveal whether change is actually being embraced on the ground.
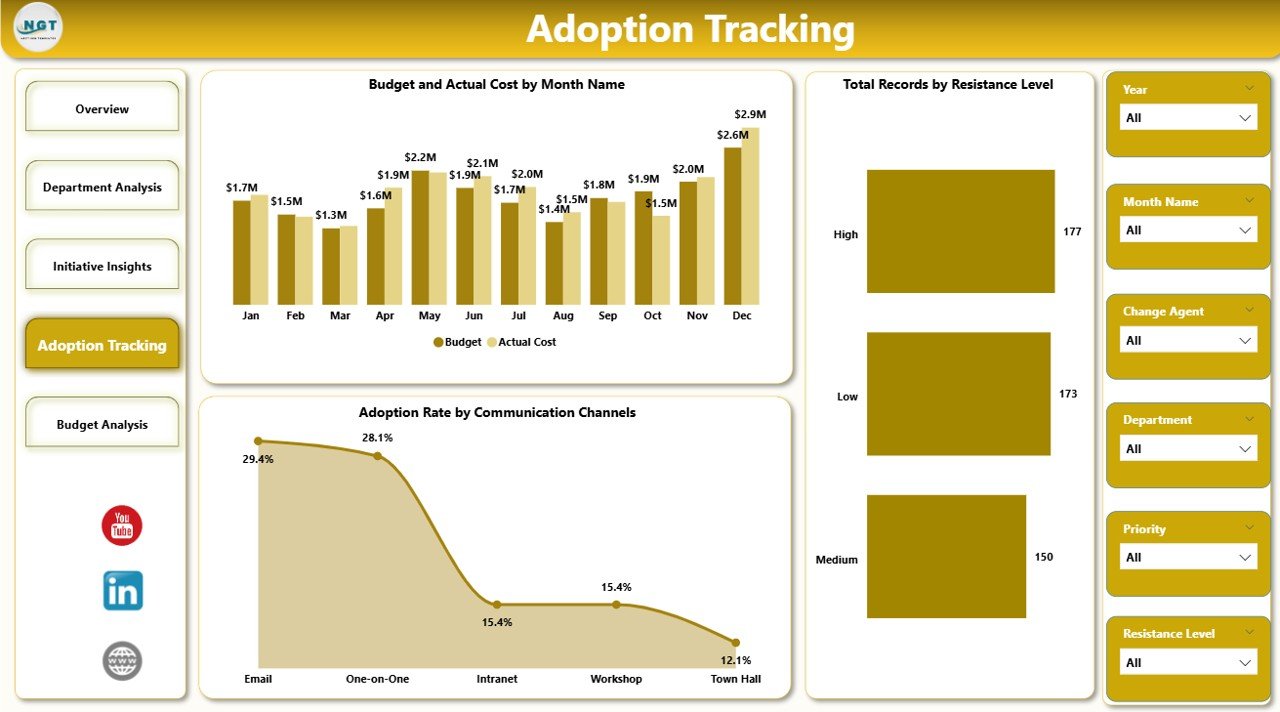
Adoption Tracking
📋 Page 5 — Budget Analysis
Keep full control over change program spending. Charts include Budget Utilization % by Department, Budget Utilization % by Initiative Type, and Total Actual Cost by Change Agent — enabling finance teams and program directors to identify overspend, reallocate resources, and ensure the program stays within budget.
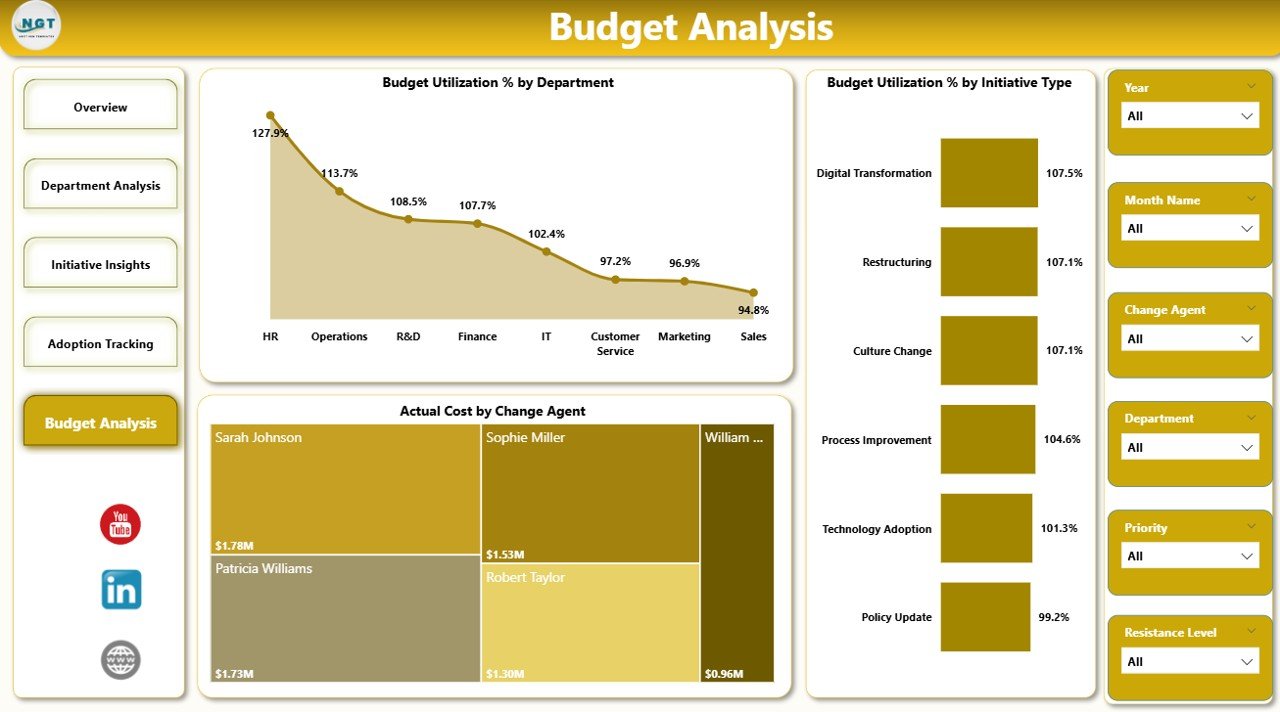
Budget Analysis
⚙️ How to Use the Change Agents Office Dashboard in Power BI
1️⃣ Download the .zip file and extract the Power BI (.pbix) file
2️⃣ Open the file in Microsoft Power BI Desktop
3️⃣ Navigate to the data source settings and connect your own change management dataset
4️⃣ Ensure your data columns match the template’s expected fields
5️⃣ Click Refresh to load your data into all 5 dashboard pages
6️⃣ Use the slicers and filters on each page to explore department, initiative, and budget insights
7️⃣ Share the .pbix file or publish to Power BI Service for team-wide access and live reporting
👥 Who Can Benefit from This Change Agents Office Dashboard in Power BI
🔹 Change Management Professionals managing organizational transformation programs across departments
🔹 Operations Managers overseeing cross-functional change initiatives and tracking progress
🔹 HR Leaders tracking training sessions, adoption scores, and stakeholder engagement metrics
🔹 Finance Teams monitoring budget utilization, actual cost variance, and resource allocation
🔹 Project Managers monitoring initiative priorities, timelines, and resistance levels
🔹 C-Suite Executives requiring quick, clear visibility into enterprise-wide transformation progress
🔹 Consultants managing client-facing organizational change programs and delivering data-driven reports
📖 Click here to read the Detailed Blog Post
🎥 Visit our YouTube channel to learn step-by-step video tutorials
👉 YouTube.com/@NextGenTemplates


Reviews
There are no reviews yet.