Car Rental Services KPI Dashboard in Excel is the ultimate performance-tracking tool designed for car rental companies that want complete visibility, faster decision-making, and total control over daily operations. Whether you manage a small fleet or a multi-location car rental business, this dashboard gives you powerful insights across booking trends, fleet availability, revenue, profits, customer satisfaction, and maintenance activities — all inside one simple Excel file.
Running a car rental business involves constant movement — vehicles going in and out, reservations changing, customers arriving, delays happening, and unexpected costs appearing. Without structured data, you lose clarity and your business performance suffers. This dashboard solves that problem instantly by turning raw numbers into beautiful charts, KPI cards, and interactive visuals.
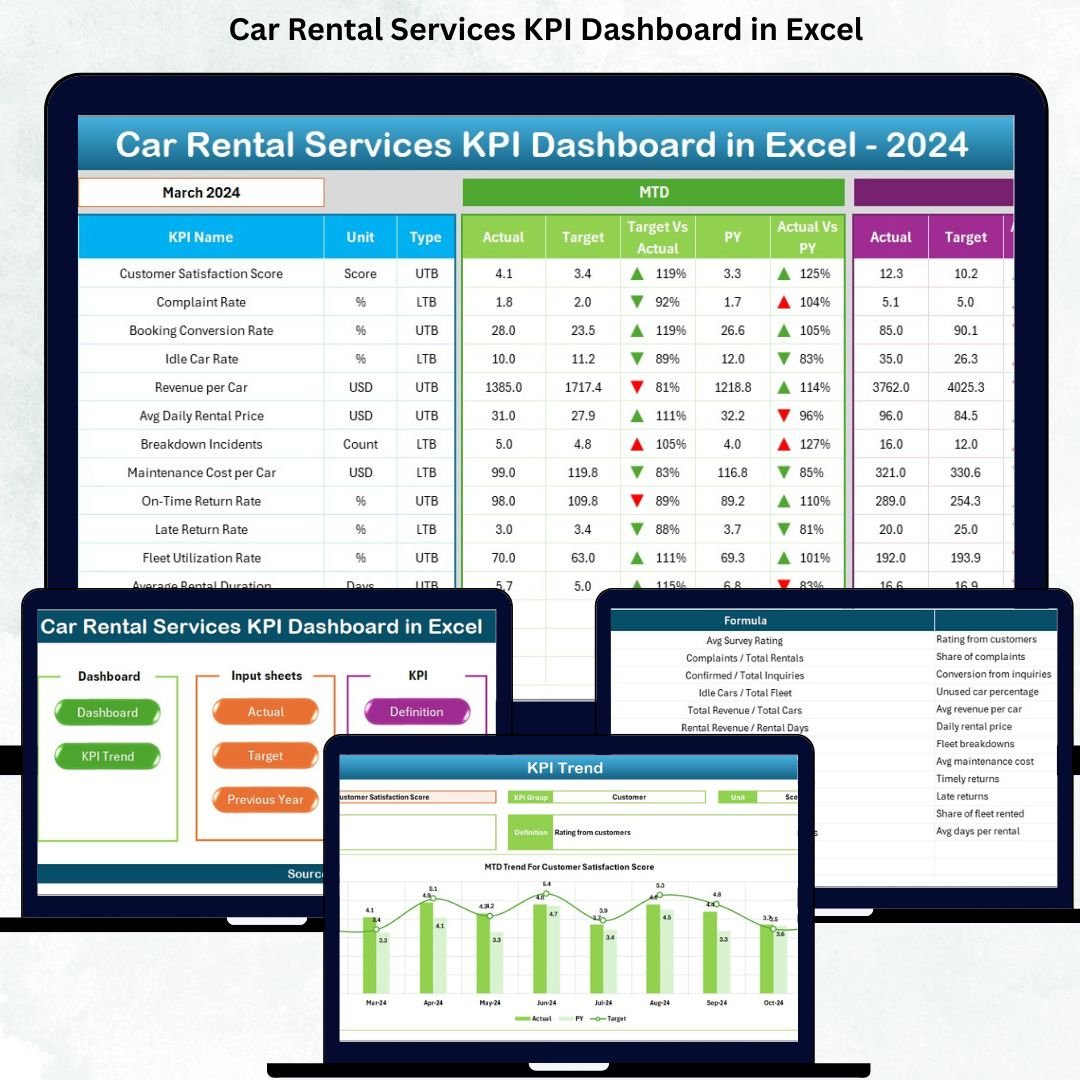
It gives you everything you need to compare MTD, YTD, Target, and Previous Year data with automatic arrows and conditional formatting so you always know whether performance is improving or declining. No complex software. No expensive subscriptions. Just clean insights and real results.Car Rental Services KPI Dashboard in Excel
🚀 Key Features of the Car Rental Services KPI Dashboard in Excel
📊 1. Complete KPI Tracking
Track all essential KPIs such as Fleet Utilization, Revenue per Vehicle, Average Rental Duration, Downtime Hours, On-Time Return %, Maintenance Cost, Customer Satisfaction Score, Bookings, Cancellations, and more.
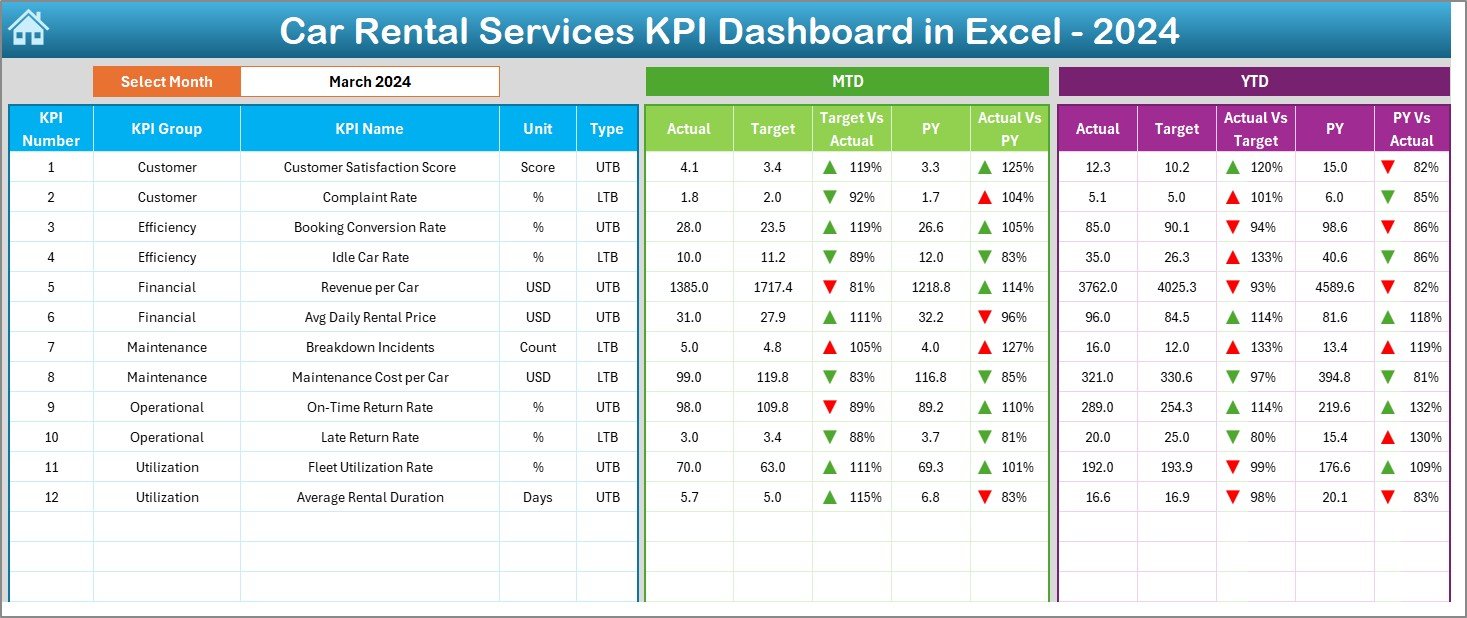
📈 2. Month Selection with Auto-Refresh
Select any month from a drop-down menu and the entire dashboard updates instantly. No manual filtering. No extra effort.
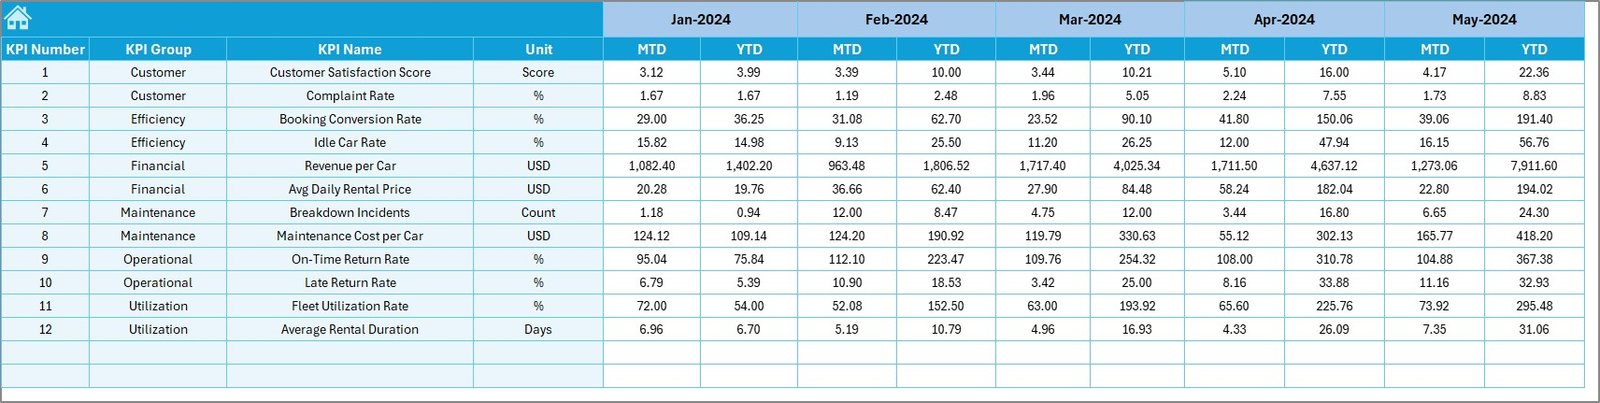
📉 3. MTD & YTD Comparisons
View MTD/YTD Actual vs Target vs Previous Year along with up/down arrows for quick insights.
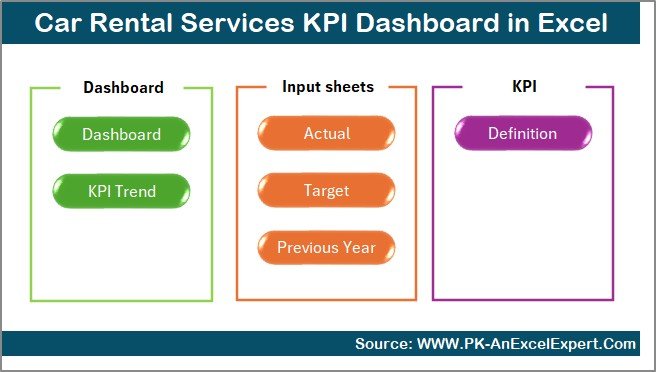
🧩 4. Seven Fully Structured Worksheets
Includes Summary Page, Dashboard, Trend Analysis, Actuals Input, Target Sheet, Previous Year Data, and KPI Definitions — neatly organized for professional use.
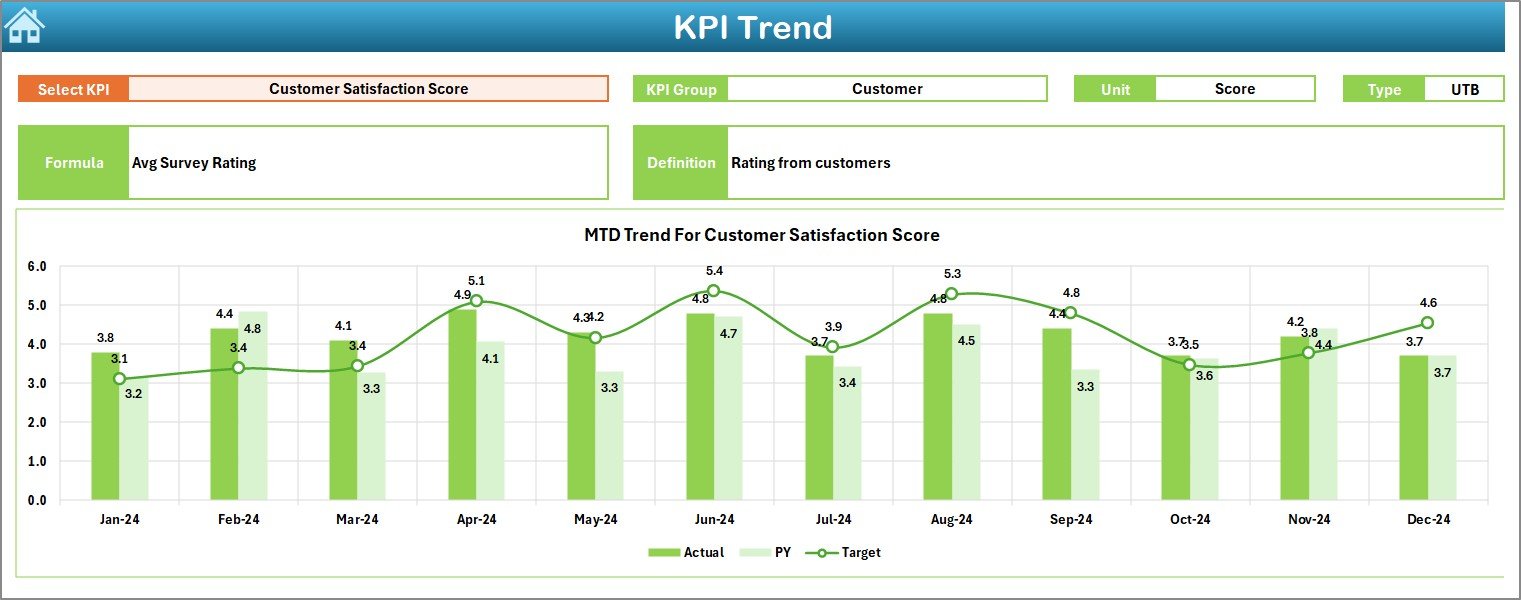
🎯 5. Trend Charts for Deep Analysis
Analyze performance patterns with MTD and YTD trend lines that compare Actual, Target, and PY numbers.
⚙️ 6. Fully Customizable
Add more vehicles, locations, KPIs, or formulas — the dashboard adapts to your business.
📦 What’s Inside the Car Rental Services KPI Dashboard in Excel
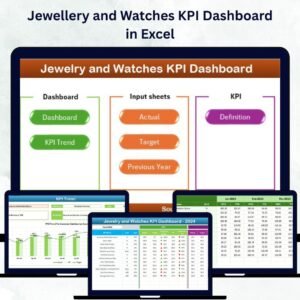
You get a professionally designed 7-sheet Excel system built for efficiency:
1️⃣ Summary Page
A clean navigation center with buttons that take you to each analysis sheet instantly.
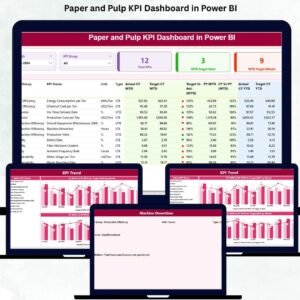
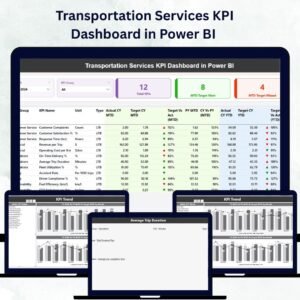
2️⃣ KPI Dashboard
The heart of your performance tracking — includes KPI cards, charts, trends, arrows, and comparisons for the selected month.
3️⃣ Trend Sheet
Choose any KPI and instantly view its formula, definition, KPI type (UTB/ LT B), and side-by-side MTD/YTD chart analysis.
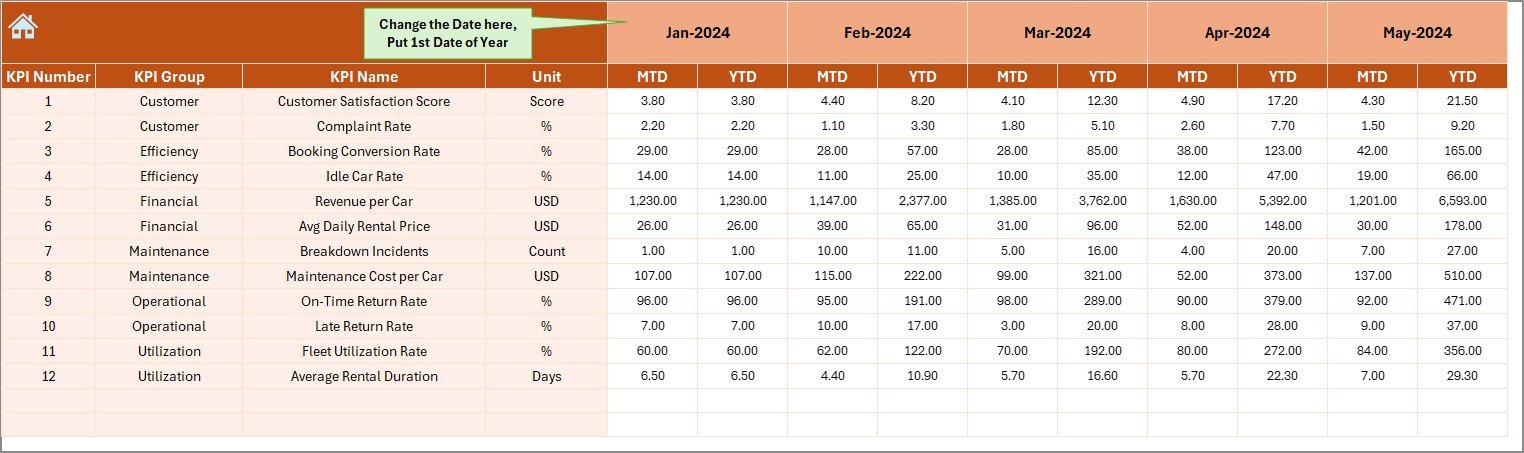
4️⃣ Actual Numbers Input Sheet
Enter MTD & YTD numbers for each month. One change updates the entire dashboard.
5️⃣ Target Sheet
Set performance expectations for the full year — both MTD & YTD targets.
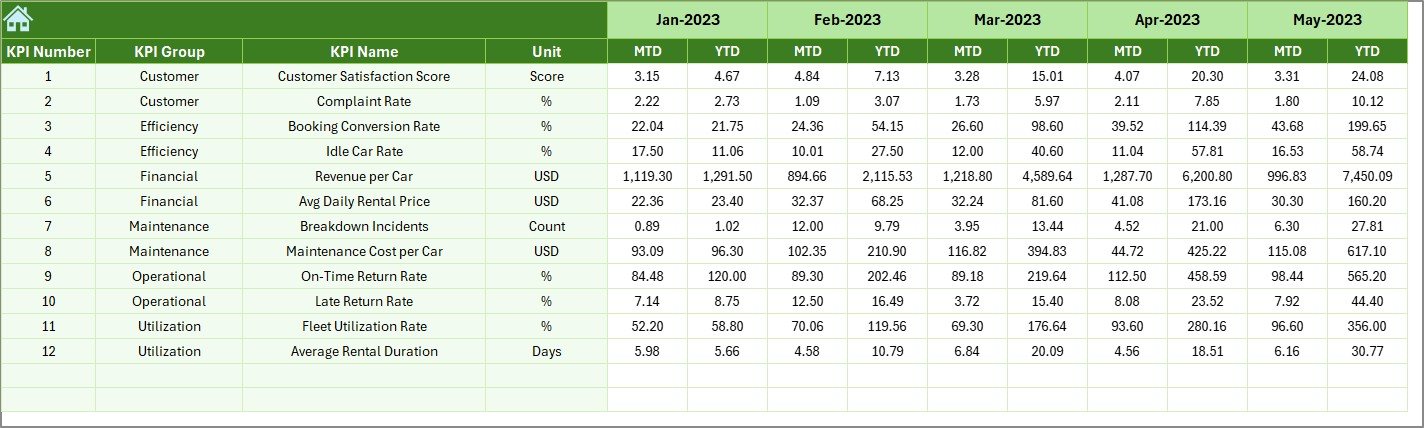
6️⃣ Previous Year Numbers
Track past performance to compare improvements, seasonal trends, and declines.
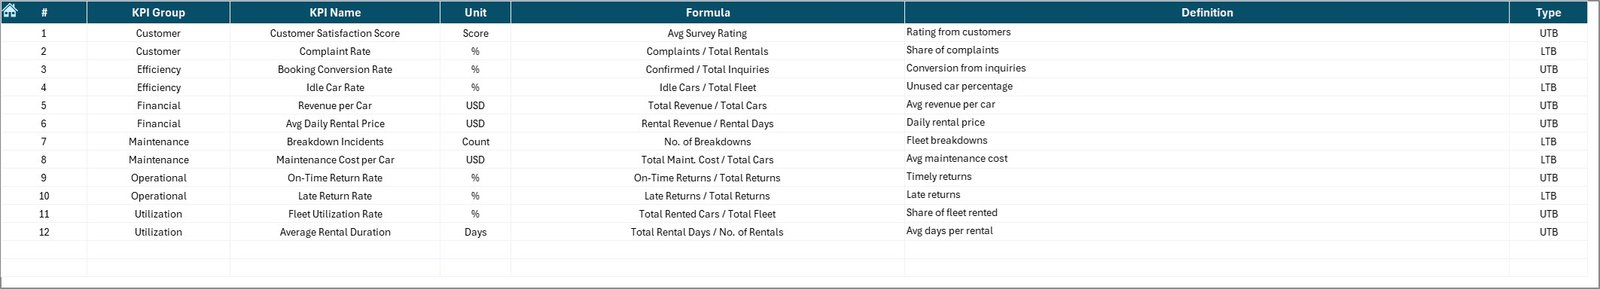
7️⃣ KPI Definition Sheet
A complete dictionary that explains each KPI clearly for your team.Car Rental Services KPI Dashboard in Excel
🛠️ How to Use the Car Rental Services KPI Dashboard in Excel
📥 Step 1: Enter Actual Numbers
Update monthly MTD & YTD performance in the input sheet.
🎯 Step 2: Enter Targets
Define MTD & YTD targets for each KPI in the target sheet.
📊 Step 3: Select the Month
Choose a month from the drop-down — the dashboard updates instantly.
📈 Step 4: Review KPIs & Trends
Analyze actual performance vs target vs last year.
📘 Step 5: Use Trend Charts
Identify improvement areas, season patterns, and performance gaps.
💡 Step 6: Customize if Needed
Add more KPIs, Car Rental Services KPI Dashboard in Excel data columns, or business units as your company grows.
👥 Who Can Benefit from This Dashboard
🚗 Car Rental Business Owners
Track profitability, fleet performance, and monthly trends effortlessly.
📍 Operations Managers
Monitor usage rates, booking patterns, and maintenance efficiency.
💰 Finance Teams
Analyze revenue, costs, and YTD performance in one simple view.
📊 Data Analysts
Get structured insights and ready-to-use KPI dictionary for reporting.
📈 Multi-Location Rental Companies
Compare year vs year, target vs actual, and branch-wise performance.
### Click here to read the Detailed blog post
Watch the step-by-step video tutorial:


Reviews
There are no reviews yet.