Key Features of Camping Resorts Dashboard
Introducing the Camping Resorts Dashboard, a ready-to-use, dynamic Excel dashboard designed specifically for camping resort businesses to track, analyze, and optimize their performance effortlessly. With just a simple data update in the Data sheet and a refresh from the Excel Ribbon, your entire dashboard refreshes automatically, providing real-time insights instantly.
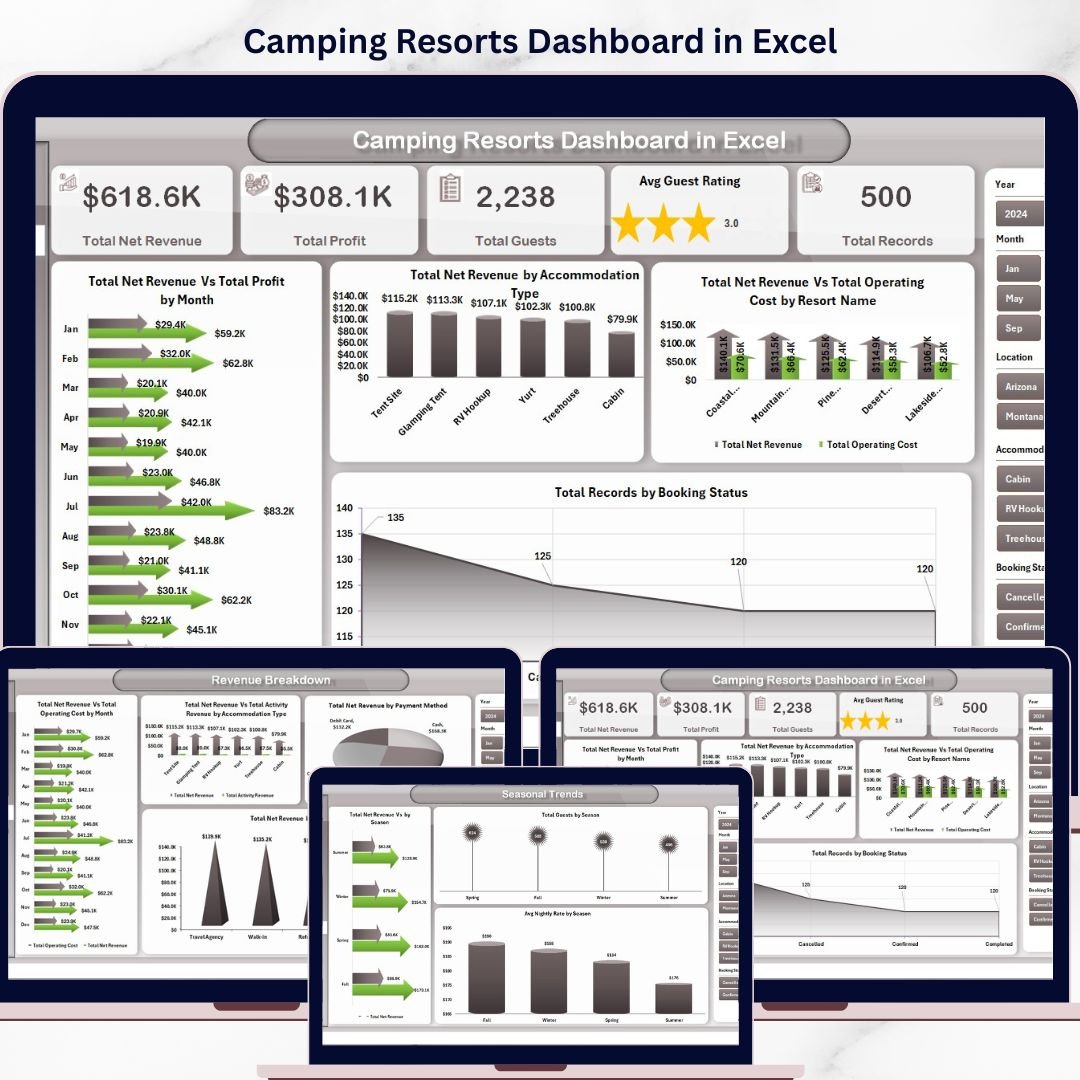
Explore multiple interactive pages, each crafted to deliver crucial metrics and visualizations:
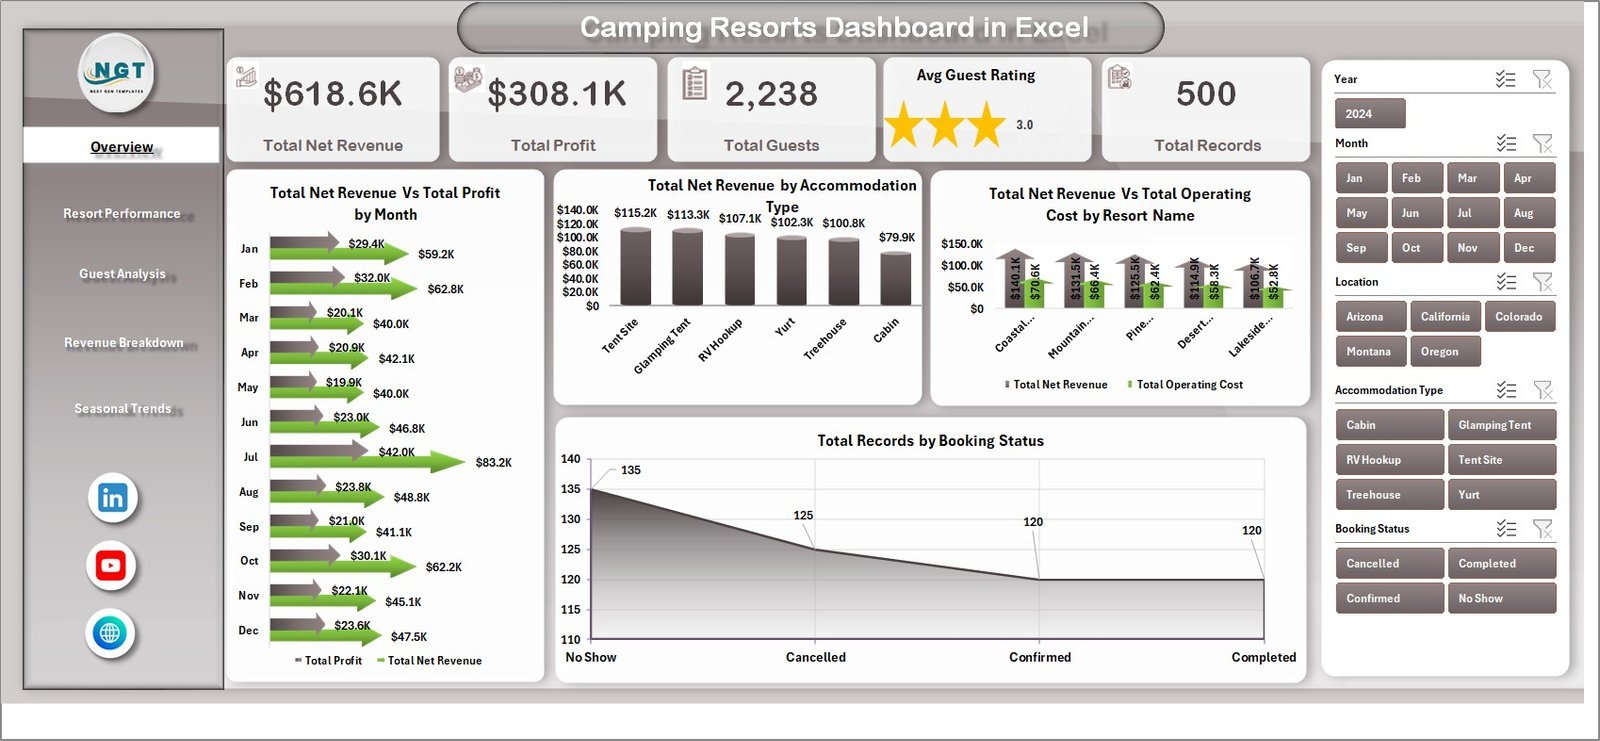
- 📊 Overview Page: High-level cards display essential KPIs such as Total Net Revenue, Total Profit, Total Guests, Average Guest Rating, and Total Records. Advanced charts analyze Net Revenue and Profit by Month, Net Revenue by Accommodation Type, Net Revenue and Operating Cost by Resort Name, and Booking Status distribution. Easily slice and dice data with multiple filters for quick, customized views.
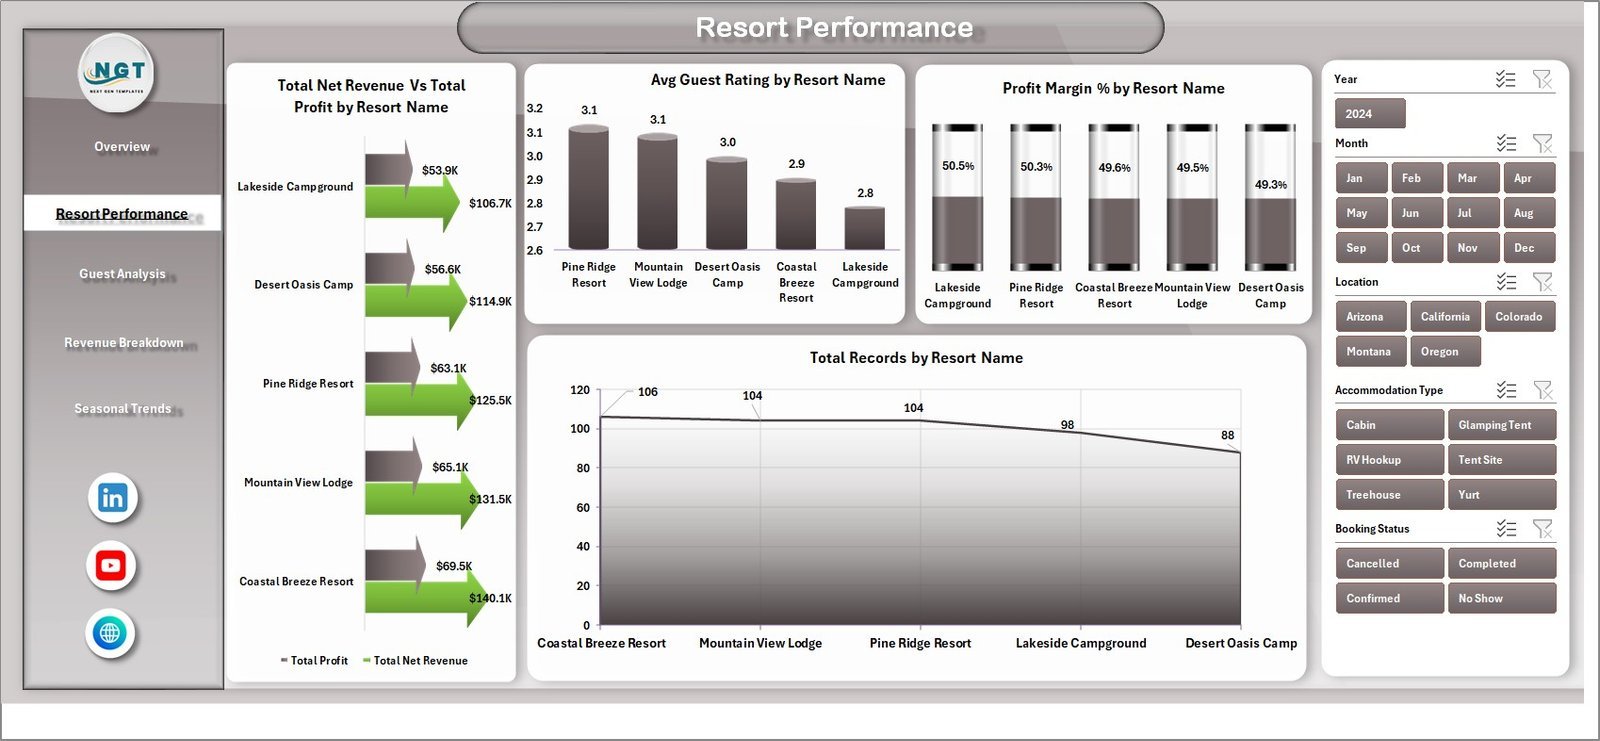
- 📈 Resort Performance: Dive deep into individual resort analytics including Net Revenue and Profit by Resort Name, Average Guest Rating, Profit Margin Percentage, and Total Records. These metrics help you pinpoint top-performing resorts and areas needing improvement.
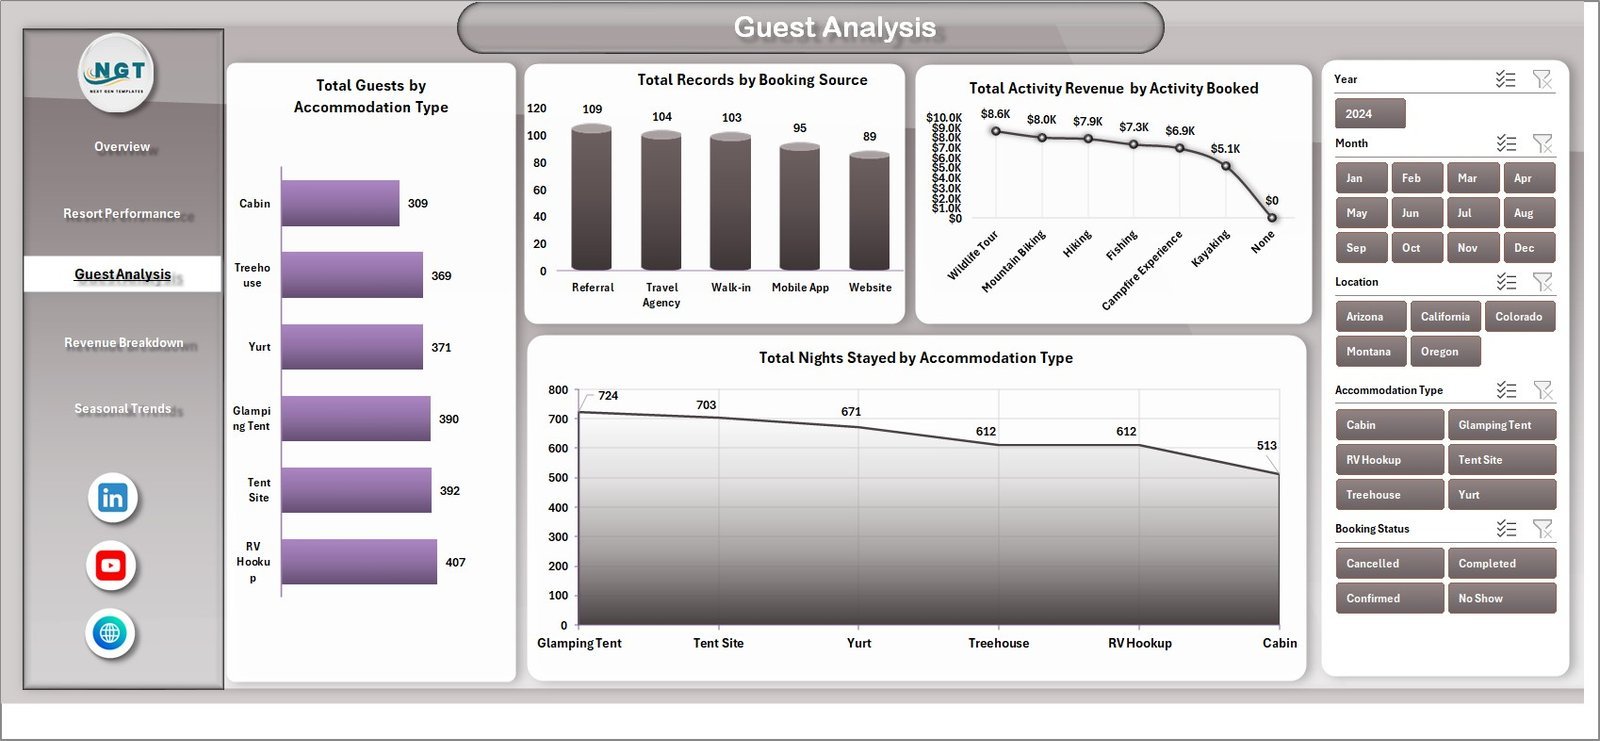
- 👥 Guest Analysis: Understand your guests better with insights such as Number of Guests by Accommodation Type, Booking Source analysis, Activity Revenue by Booked Activities, and Average Stay Duration by accommodation type.
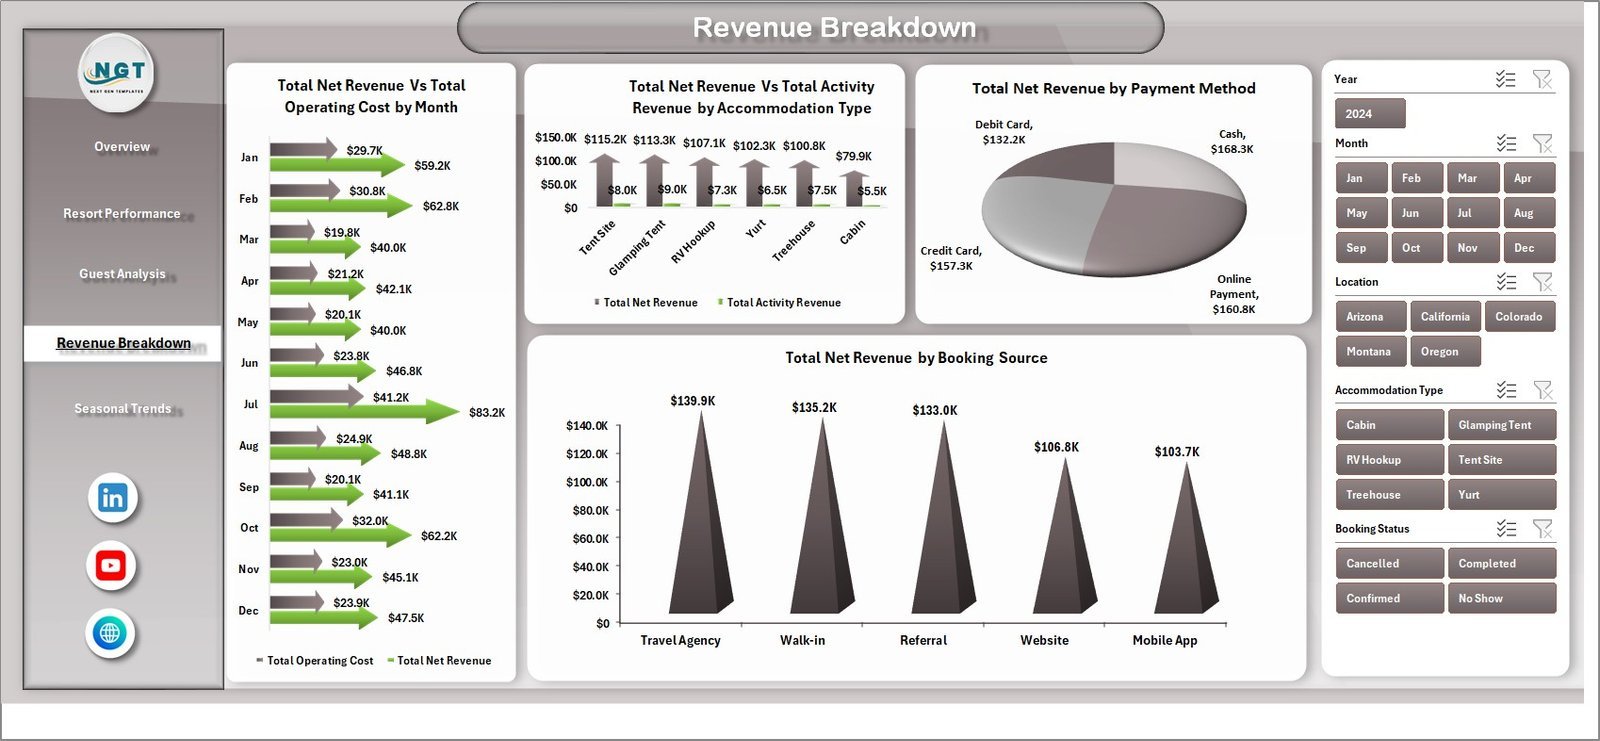
- 💰 Revenue Breakdown: Analyze your income streams with charts for Net Revenue and Operating Cost by Month, Revenue by Accommodation Type and Activity, Payment Methods, and Booking Sources – enabling smarter financial decisions.
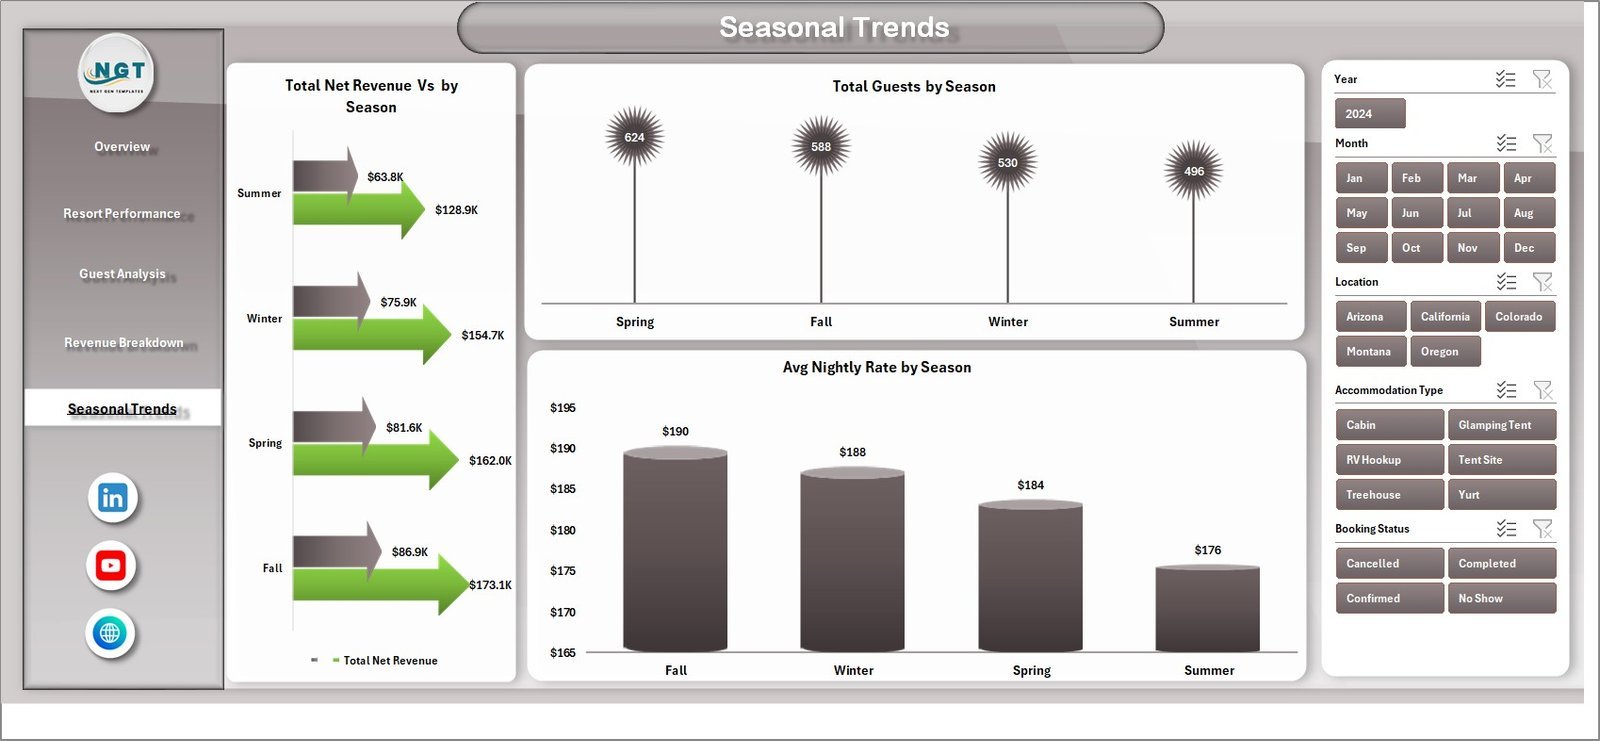
- 🌞 Seasonal Trends: Track performance variations across seasons by Total Net Revenue, Total Guests, and Average Nightly Rate, helping optimize pricing and marketing strategies according to seasonal demand.
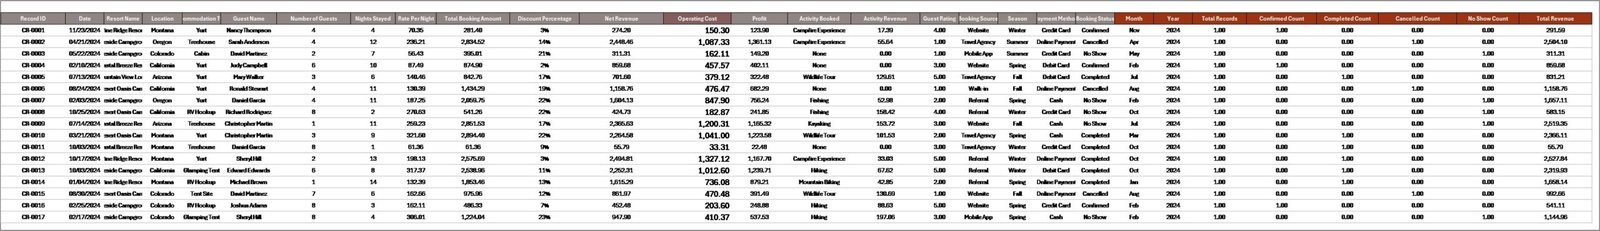
- 🗂️ Data Sheet Tab: The backbone of your dashboard where all raw data is entered in a structured format, ensuring accuracy and consistency.
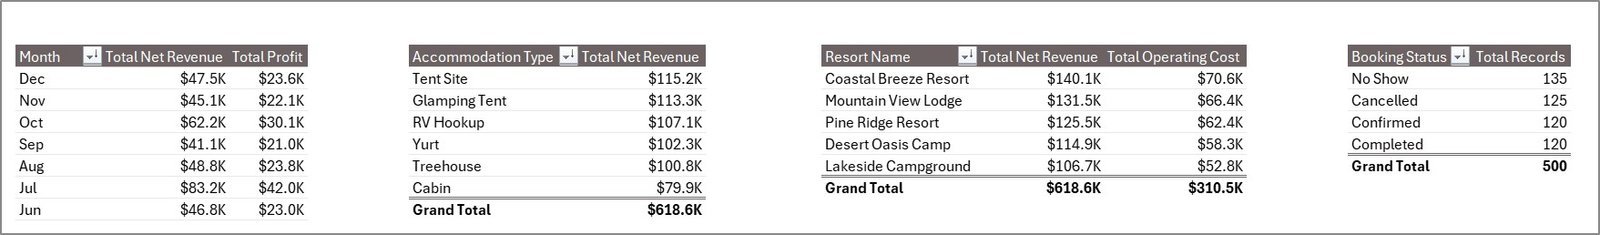
- 🔧 Support Sheet Tab: Houses multiple pivot tables powering the dashboard’s dynamic functionality. Simply refresh all pivots after updating data to instantly see updated analytics. This sheet can be kept hidden for smooth user experience.
What’s Inside the Camping Resorts Dashboard
This comprehensive Excel dashboard package includes:
- 🔹 Multiple interactive sheets for Overview, Resort Performance, Guest Analysis, Revenue Breakdown, Seasonal Trends, Data Input, and Support
- 🔹 Dynamic pivot tables that update charts and KPIs with a single click
- 🔹 Visual cards and charts designed for quick data consumption and decision-making
- 🔹 User-friendly slicers and filters for customizable data views
- 🔹 Well-organized and formatted Excel workbook optimized for easy data entry and refresh
- 🔹 Clear, intuitive layout suitable for both beginners and advanced users
How to Use the Camping Resorts Dashboard
Getting started is fast and simple:
-
- 📝 Step 1: Enter your resort data in the Data Sheet tab, maintaining the same format as provided to ensure compatibility.
- 🔄 Step 2: Navigate to the Data tab in the Excel Ribbon and click on Refresh All. This action will update all pivot tables and charts across the dashboard.
- 📊 Step 3: Explore each dashboard sheet to analyze key performance metrics, apply filters via slicers for tailored insights, and make informed business decisions.
- 🛠️ Step 4: Use the Support Sheet tab if you need to troubleshoot or want to see the underlying pivot tables (optional and can be hidden).
With this simple workflow, you can keep your resort data up-to-date and visualize performance trends without any technical hassle.
Who Can Benefit from This Camping Resorts Dashboard
The Camping Resorts Dashboard is a must-have for:
- 🏕️ Resort Owners & Managers: Gain actionable insights to improve profitability, guest satisfaction, and operational efficiency.
- 📈 Marketing Teams: Understand guest demographics, booking sources, and seasonal trends to create targeted campaigns.
- 💼 Financial Analysts: Track revenue streams, profit margins, and cost structures with ease for accurate budgeting and forecasting.
- 👨💻 Business Consultants: Use the dashboard to deliver data-driven recommendations to camping resort clients.
- 🎯 Decision Makers: Quickly assess overall business health and make strategic adjustments based on real-time data.
- 📊 Data Enthusiasts & Excel Users: Leverage this pre-built dashboard to save time on report creation and focus on insights.
Click here to read the Detailed blog post.
Visit our YouTube channel to learn step-by-step video tutorials.


Reviews
There are no reviews yet.