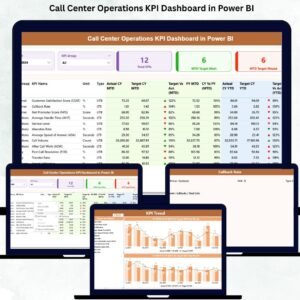
Running a call center means dealing with constant pressure — high call volumes, urgent customer needs, and performance targets that change every day. Managers need fast access to accurate insights, agents need clarity, and leadership needs real-time reporting. With so many moving parts, manual tracking becomes slow and unreliable. That’s exactly why the Call Center Operations KPI Dashboard in Power BI is the ultimate solution.Call Center Operations KPI Dashboard in Power BI
This professionally designed dashboard gives you instant clarity, real-time performance insights, and easy reporting, even if you have zero technical knowledge. It connects directly to a simple Excel dataset and transforms raw data into powerful visuals that guide better decisions every day.
✨ Key Features of the Call Center Operations KPI Dashboard in Power BI
This dashboard is built to simplify call center performance tracking. Here’s what makes it powerful:Call Center Operations KPI Dashboard in Power BI
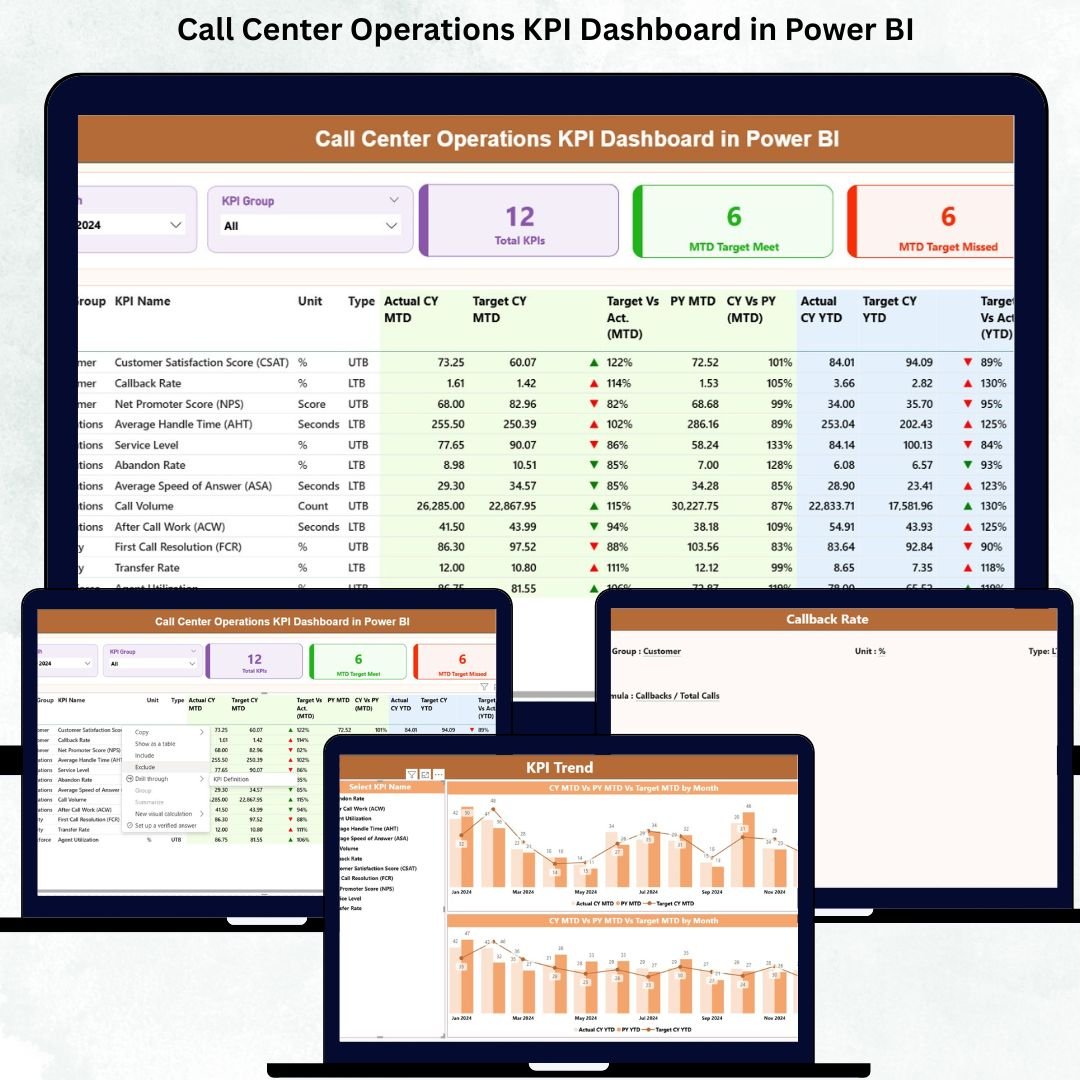
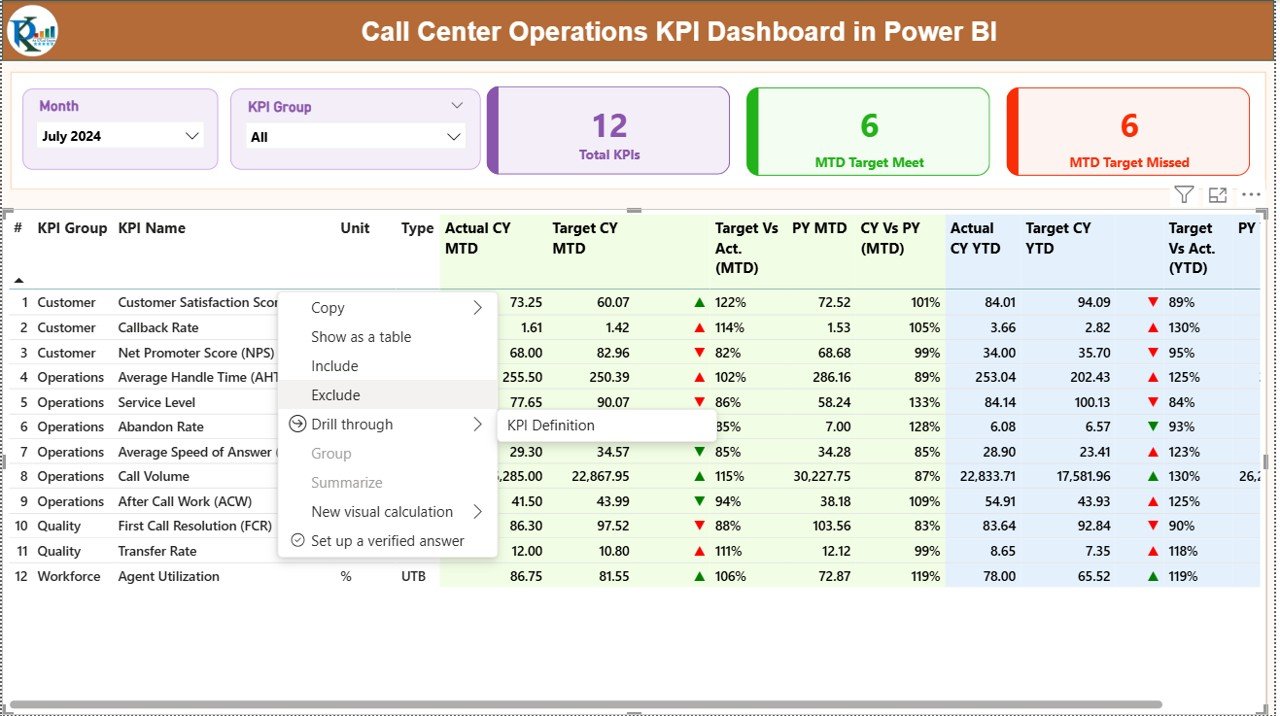
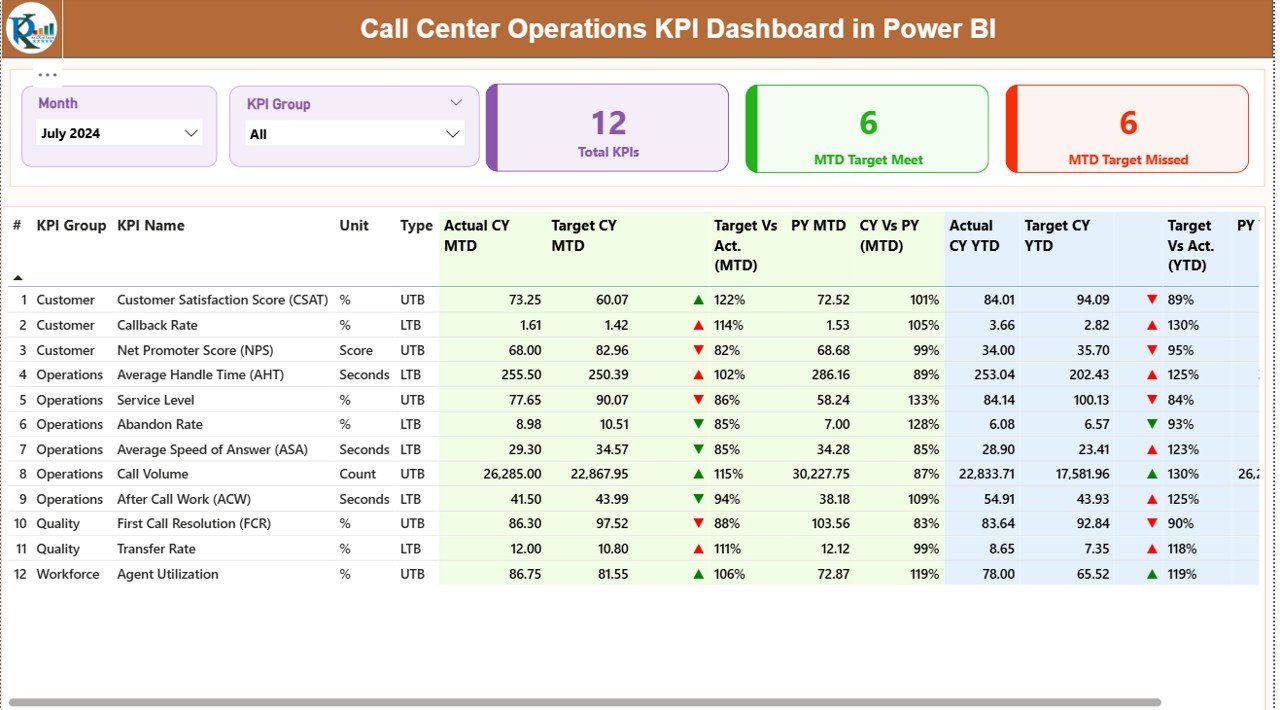
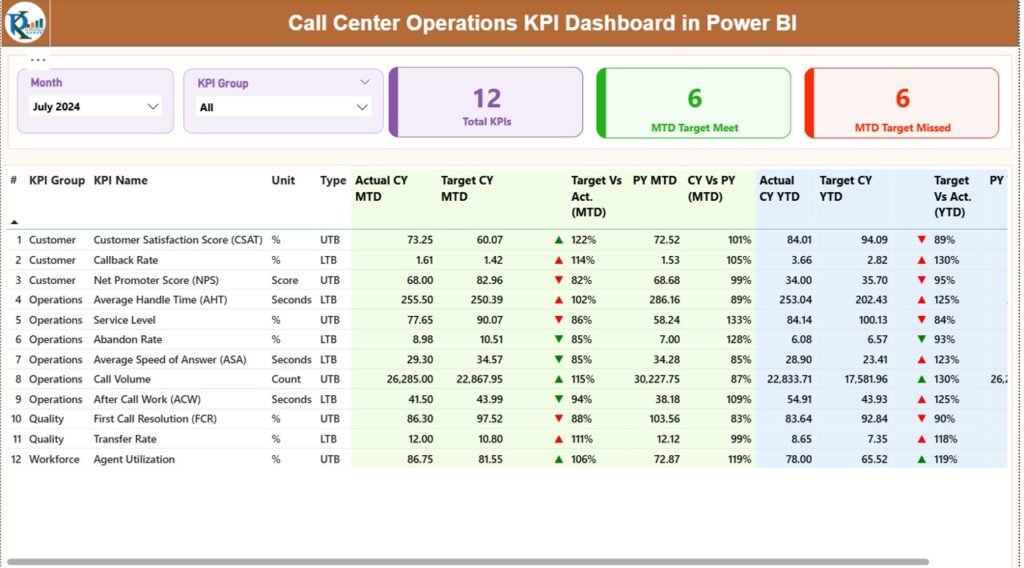
📌 1. Summary Page – Your Main Command Center
The Summary Page brings all KPIs together in one clean view. With dynamic slicers, performance cards, and detailed KPI tables, you can analyze call center efficiency with a single click.
-
Month Slicer updates all visuals instantly
-
KPI Group Slicer lets you filter KPIs by category
-
Smart KPI Cards show Total KPIs, MTD Target Met, and Target Missed
-
Detailed KPI Table displays MTD, YTD, PY comparisons, status icons, variance %, and more
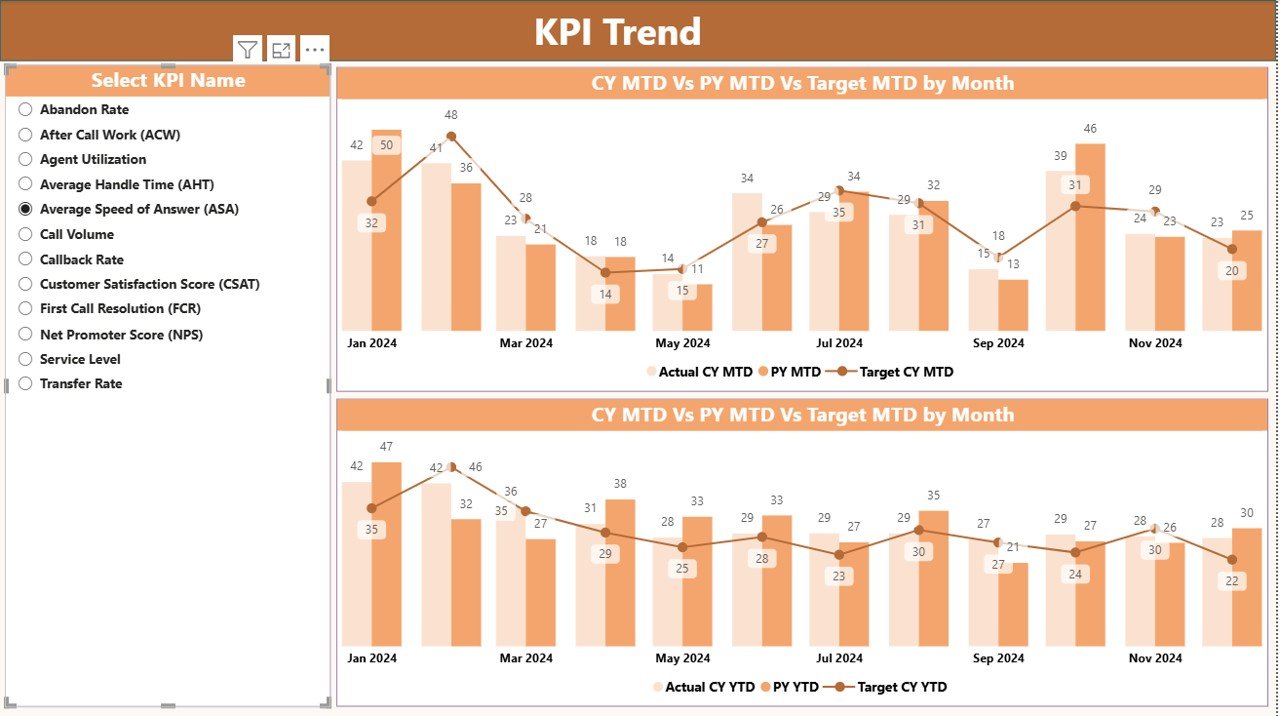
📌 2. KPI Trend Page – Clear Performance Visualization
This page makes trend analysis effortless.
-
Choose any KPI using the slicer
-
View crystal-clear MTD and YTD trends
-
Compare Current Year, Previous Year, and Targets
Perfect for management presentations and review meetings.
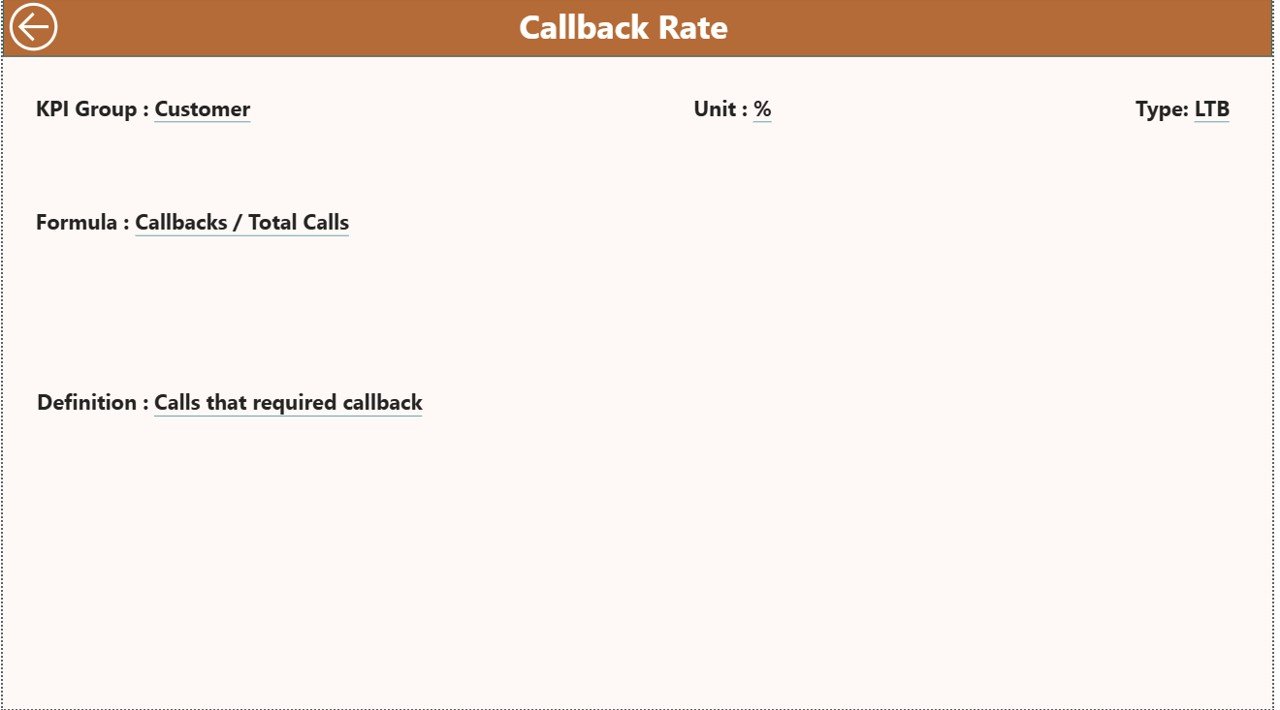
📌 3. KPI Definition Page – Complete KPI Reference
Drill through any KPI to see its formula, definition, type (LTB/UTB), and calculation method. Ideal for training new agents and aligning teams on performance expectations.Call Center Operations KPI Dashboard in Power BI
📘 What’s Inside the Call Center Operations KPI Dashboard in Power BI
This downloadable product includes everything you need to run a highly organized reporting system:
📄 Power BI Dashboard File (PBIX)
A fully designed and automated performance dashboard with all visuals, slicers, trend charts, and indicators.
📊 Excel Dataset (Source File)
Includes three structured sheets:
-
Input_Actual – Enter Actual MTD & YTD values
-
Input_Target – Enter Target MTD & YTD values
-
KPI Definition – Store KPI formulas, units, descriptions, and types
📘 User Guide (Instructions File)
A step-by-step guide showing how to update data, add new KPIs, and customize the dashboard.
🛠️ How to Use the Call Center Operations KPI Dashboard in Power BI
Using this dashboard is extremely simple — no coding or advanced Power BI skills are required.
✔ Step 1: Update Excel Actual Data
Enter the latest monthly figures in the Input_Actual sheet.
✔ Step 2: Update KPI Targets
Fill the Input_Target sheet with MTD and YTD targets.
✔ Step 3: Load the Excel File in Power BI
Power BI refreshes automatically and updates all visuals.
✔ Step 4: Use Slicers to Analyze Performance
Select month, KPI group, or specific KPI to review trends.
✔ Step 5: Use Drill-Through for Deep Insights
Click on any KPI to open the detailed KPI Definition page.
That’s it — the dashboard handles everything else.
🎯 Who Can Benefit from This Call Center Operations KPI Dashboard?
This dashboard is designed for anyone involved in call center performance tracking:
👨💼 Call Center Managers
Monitor KPIs, spot issues early, and improve team efficiency.
👩💼 Team Leaders & Supervisors
Track agent metrics, identify training needs, and stay aligned with targets.
📊 Business Analysts
Analyze trends, prepare performance reports, and measure YoY improvement.
🏢 BPOs & Customer Support Centers
Improve service quality, reduce handling time, and increase customer satisfaction.
👨🏫 Trainers & Quality Teams
Use KPI definitions for onboarding, evaluation, and audits.
Anyone who wants fast, accurate, and automated reporting will love this dashboard.
### Click here to read the Detailed blog post
Watch the step-by-step video tutorial:


Reviews
There are no reviews yet.