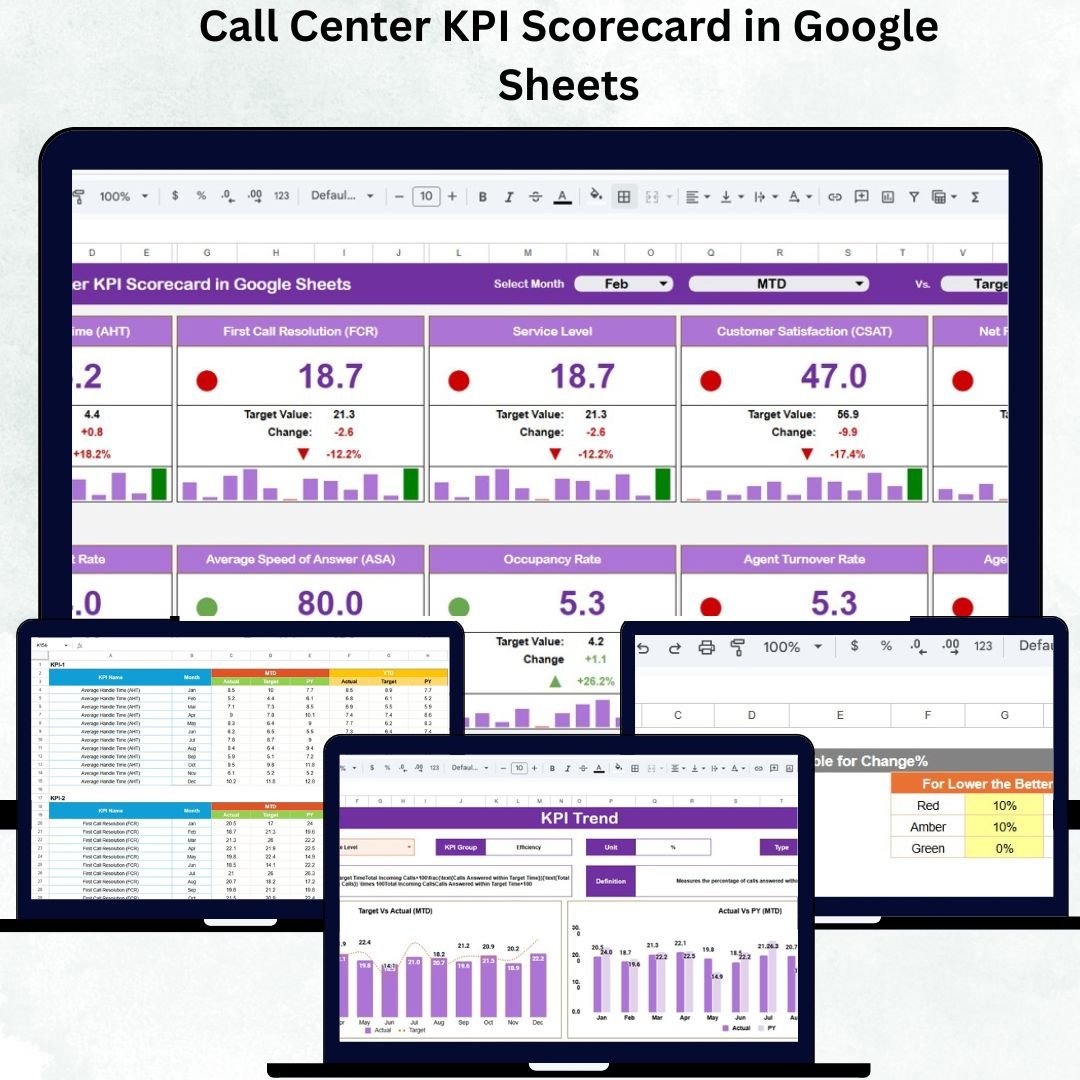
Customer satisfaction begins with efficient communication — and every call matters. The Call Center KPI Scorecard in Google Sheets is a powerful, ready-to-use solution designed to track performance, improve agent productivity, and maintain service quality. Whether you manage a small support desk or a large call center operation, this dynamic scorecard helps monitor critical metrics in real time.
Built entirely in Google Sheets, the scorecard provides visual dashboards, automatic color indicators, and trend analysis to measure your call center’s efficiency with zero coding or software setup.
📘 What Is a Call Center KPI Scorecard in Google Sheets?
A Call Center KPI Scorecard is a performance management tool that captures, tracks, and visualizes call center data. It empowers supervisors to make data-driven decisions by analyzing service levels, agent utilization, and customer satisfaction.
With built-in formulas, dropdown selectors, and automated visuals, it provides both MTD (Month-to-Date) and YTD (Year-to-Date) summaries for instant insights into team performance.
This tool is ideal for operations managers, team leads, and performance analysts seeking a transparent, easy-to-use performance reporting system.
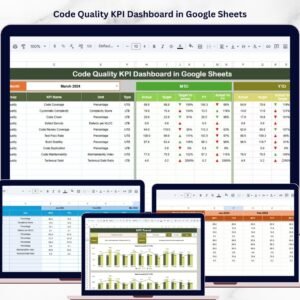
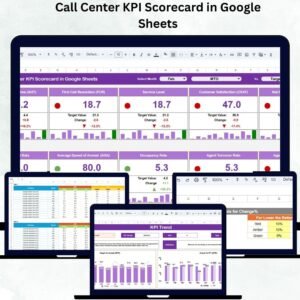
🧭 Scorecard Sheet Tab Overview
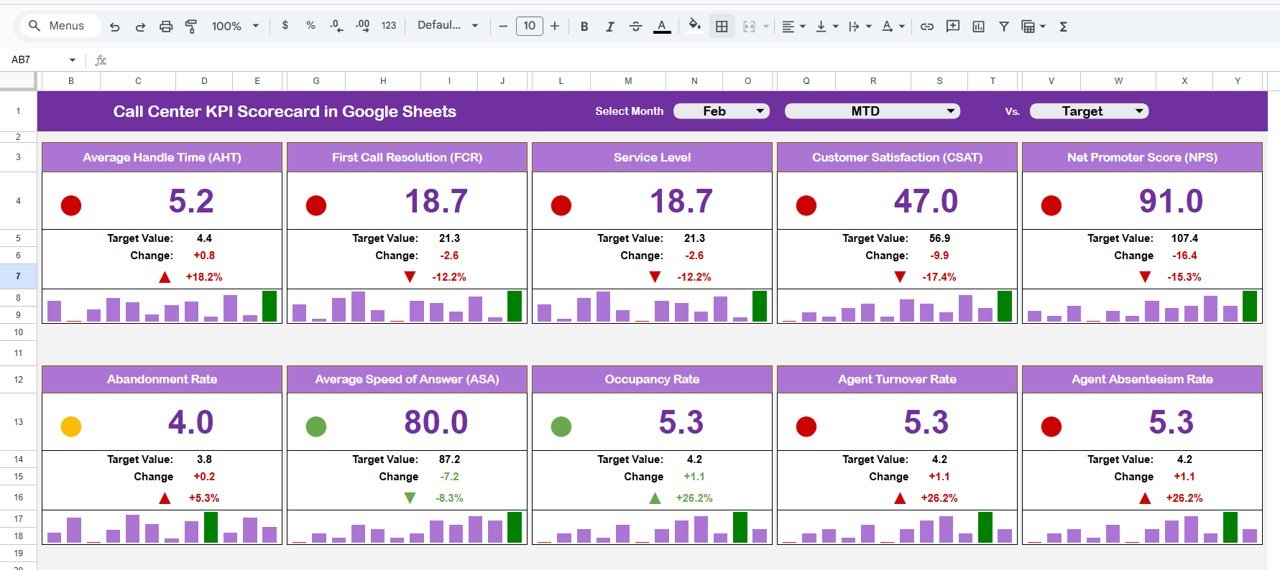
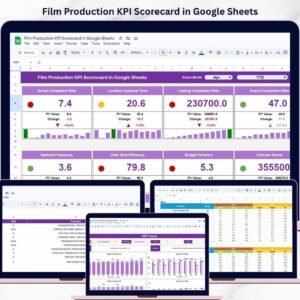
The Scorecard Sheet is the core of the dashboard. It presents KPIs in one unified interface with color-coded visuals and dynamic updates.
✨ Key Features
Month Dropdown Selector:
Choose any month to review its KPIs — the sheet auto-updates all metrics and charts instantly.
MTD & YTD Toggle Buttons:
-
MTD (Month-to-Date): View performance for the selected month.
-
YTD (Year-to-Date): Get a cumulative overview of annual performance.
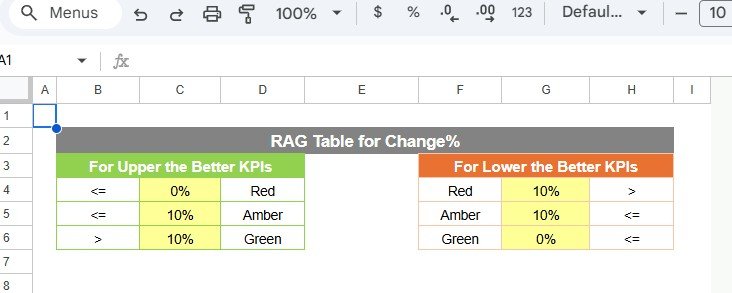
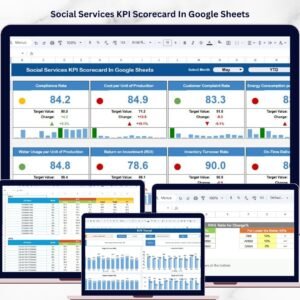
Traffic Light Indicators:
Color-coded visuals make performance evaluation simple:
🟢 Green – Target achieved or exceeded
🟡 Yellow – Slightly below target
🔴 Red – Needs improvement
Up/Down Arrows & Variance %:
Each KPI displays directional arrows and variance percentages, highlighting performance changes from the previous period.
📊 Example KPIs Included
The scorecard tracks 10 essential call center metrics, such as:
-
Average Handling Time (AHT)
-
First Call Resolution (FCR)
-
Customer Satisfaction (CSAT)
-
Call Abandonment Rate
-
Agent Utilization Rate
-
Average Wait Time
-
Call Answer Rate
-
Net Promoter Score (NPS)
-
Call Transfer Rate
-
Total Calls Handled
Each KPI includes Actual, Target, and Variance (%) fields for clear performance comparisons.
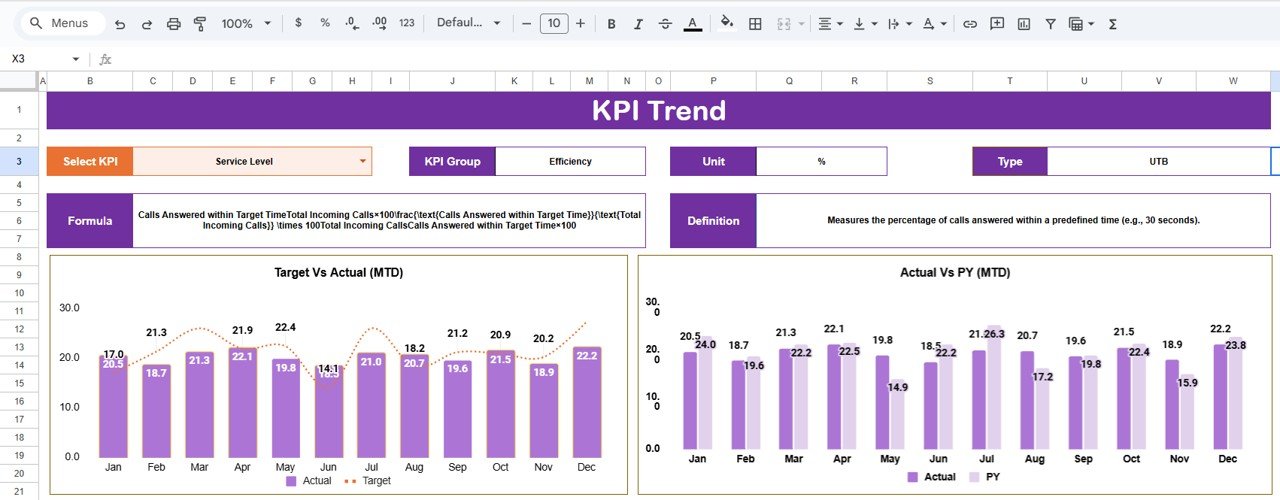
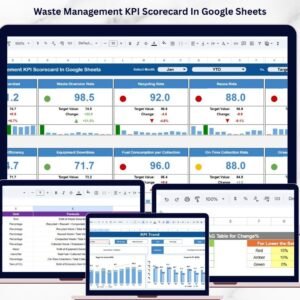
📈 Trend Sheet Tab
The Trend Sheet helps identify long-term progress.
-
Select any KPI using the dropdown (cell C3).
-
The chart updates automatically to display historical trends across months.
-
Use this to evaluate consistency, detect dips, and forecast performance outcomes.
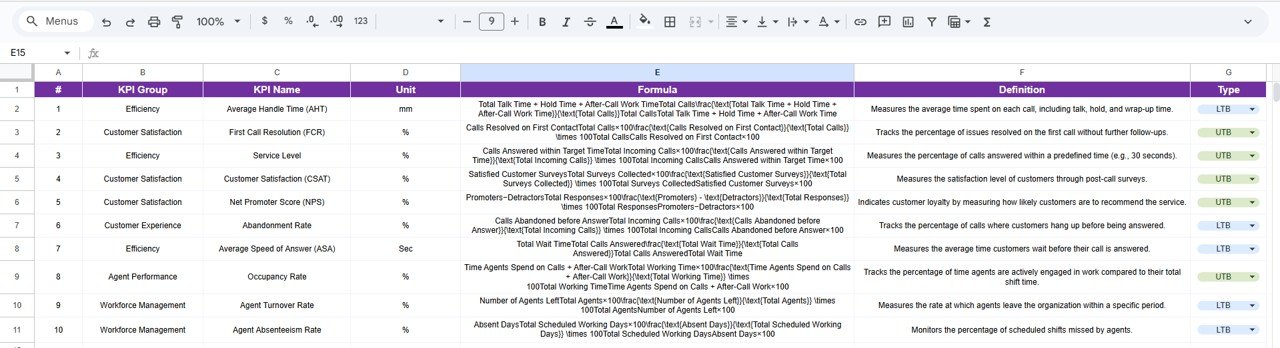
📑 KPI Definition Sheet Tab
This sheet acts as your reference guide, ensuring clarity and consistency.
Columns Include:
-
KPI Group (Efficiency, Quality, Customer Experience)
-
KPI Name
-
Unit (%, Minutes, or Count)
-
Formula (calculation logic)
-
Definition (short explanation)
-
Type (UTB – Upper the Better / LTB – Lower the Better)
This standardization ensures every stakeholder interprets metrics correctly.
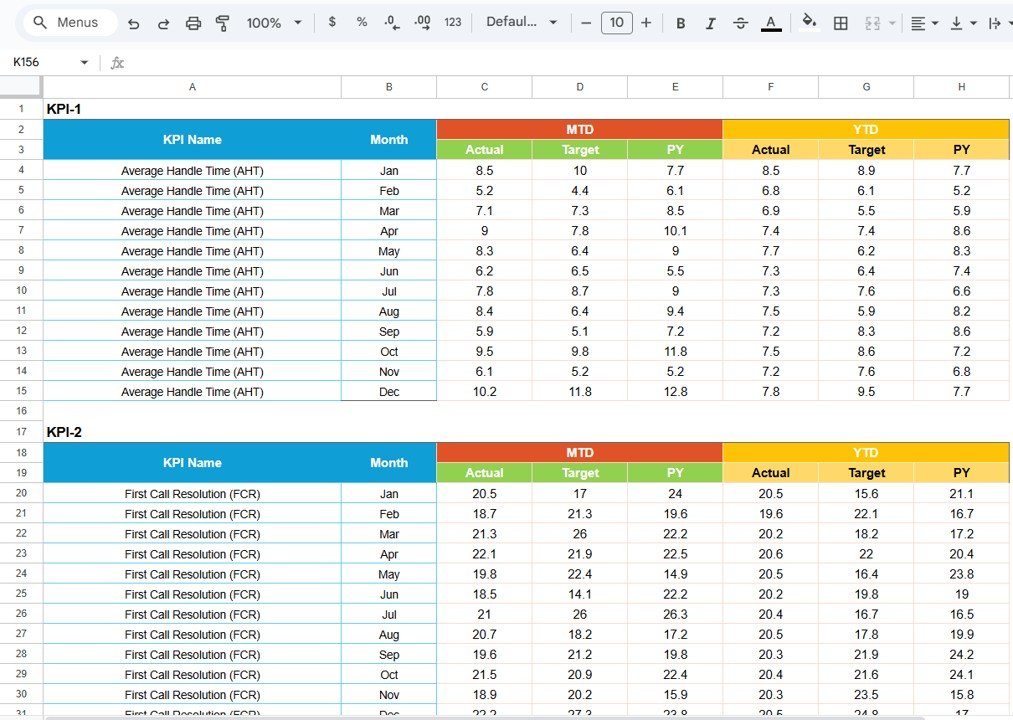
📅 Data Input Sheet Tab
The Data Input Sheet is the data engine of this scorecard.
Columns Include:
-
Month
-
KPI Name
-
Actual Value
-
Target Value
-
Previous Month Value
-
Year-To-Date Value
Once you input the data, all visuals, KPIs, and charts automatically update across the dashboard.
🌟 Advantages of the Call Center KPI Scorecard
-
📊 Real-Time KPI Monitoring: Evaluate team performance instantly.
-
⚙️ Interactive Dashboard: Switch between months or YTD views with a click.
-
🎯 Automated Alerts: Traffic lights and arrows provide quick visual feedback.
-
👥 Team Alignment: Keep agents and managers focused on shared targets.
-
📈 Trend Insights: Visualize progress and identify recurring issues.
-
🌍 Google Sheets-Based: 100% cloud, collaborative, and easy to share.
-
🧮 Error-Free Automation: Built-in formulas remove manual calculations.
🚀 Opportunities for Improvement
Enhance this dashboard even further with optional features:
-
💬 Email Alerts: Use Google Apps Script to send notifications for underperforming KPIs.
-
📊 Drill-Down Analytics: Add filters for agent or team-level insights.
-
🔗 CRM Integration: Connect to Zendesk, Freshdesk, or Salesforce via Zapier.
-
📆 Weekly Reports: Add a separate sheet for week-over-week analysis.
-
🗒️ Action Plan Notes: Add columns for manager comments beside KPIs.
💡 Best Practices for Using the Scorecard
✅ Update data monthly for accurate reports.
✅ Use consistent KPI units (% or minutes).
✅ Review trend charts quarterly for improvement tracking.
✅ Protect critical data by setting permissions.
✅ Automate where possible using built-in scripts.
✅ Share dashboards during team reviews for transparency.
👥 Who Can Use This Scorecard
-
Call Center Managers: To review performance and manage KPIs.
-
Supervisors: For tracking individual or team progress.
-
Executives: For quick insights into operational performance.
-
QA Teams: To measure service quality and resolution rates.
✅ Conclusion
The Call Center KPI Scorecard in Google Sheets is your all-in-one tool for tracking performance, improving service quality, and enhancing team accountability. With automated visuals, real-time tracking, and user-friendly navigation, it simplifies performance management while driving results.
Whether you manage inbound, outbound, or blended operations — this scorecard gives you the visibility, precision, and control you need to keep customers happy and teams performing at their best.


Reviews
There are no reviews yet.