Turn your raw business data into powerful insights with the Business Intelligence (BI) Dashboard in Excel 🚀. In today’s data-driven world, companies generate massive amounts of information daily. However, when this data is scattered, decision-making becomes slow and inefficient.
That’s where this ready-to-use Excel BI Dashboard becomes a game-changing solution.
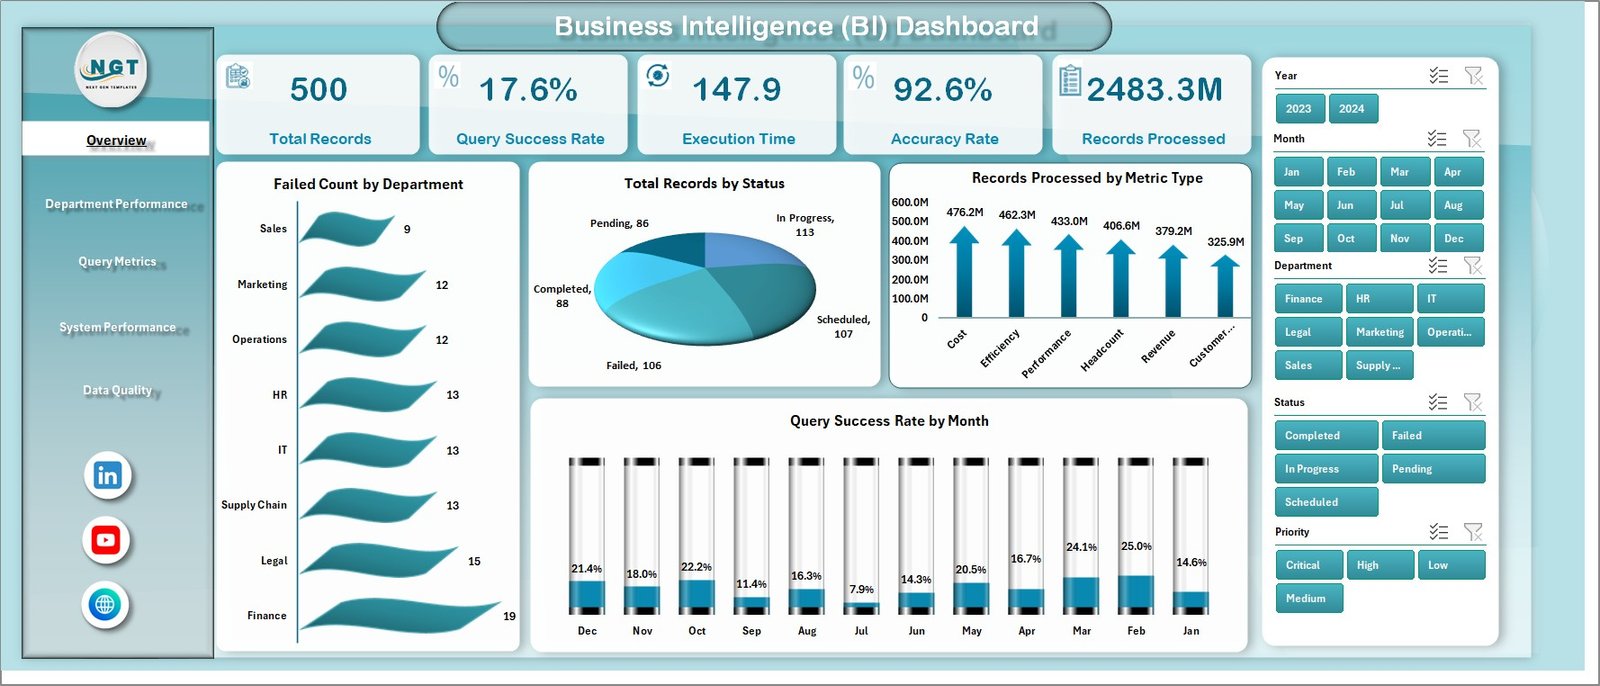
It transforms complex datasets into interactive visuals, KPI cards, and actionable insights, helping you make faster, smarter, and data-driven decisions—all in one place.
🚀 Key Feature of Business Intelligence (BI) Dashboard in Excel
✅ 📊 Interactive Excel Dashboard
Visualize business data using charts, slicers, and KPIs.
✅ 📈 Real-Time KPI Monitoring
Track performance metrics across departments instantly.
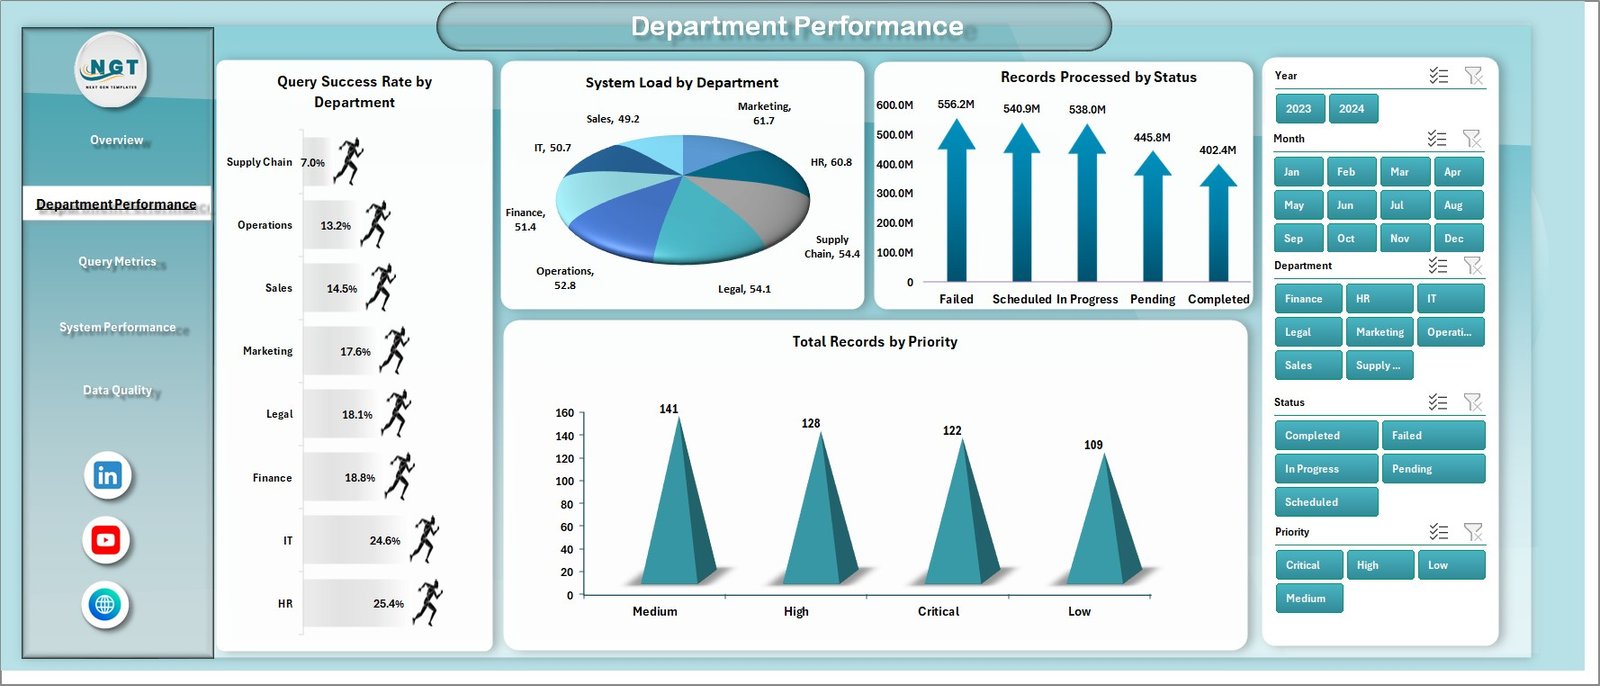
✅ 🏢 Multi-Department Analysis
Compare efficiency and output across business units.
✅ ⚙️ System & Query Performance Tracking
Monitor processing efficiency and system performance.
✅ 📊 Data Quality Insights
Ensure accuracy and reliability of your data.
✅ 🔍 Smart Filtering with Slicers
Customize analysis dynamically.
✅ 📂 Structured Data Model
Separate Data and Support sheets for smooth functionality.
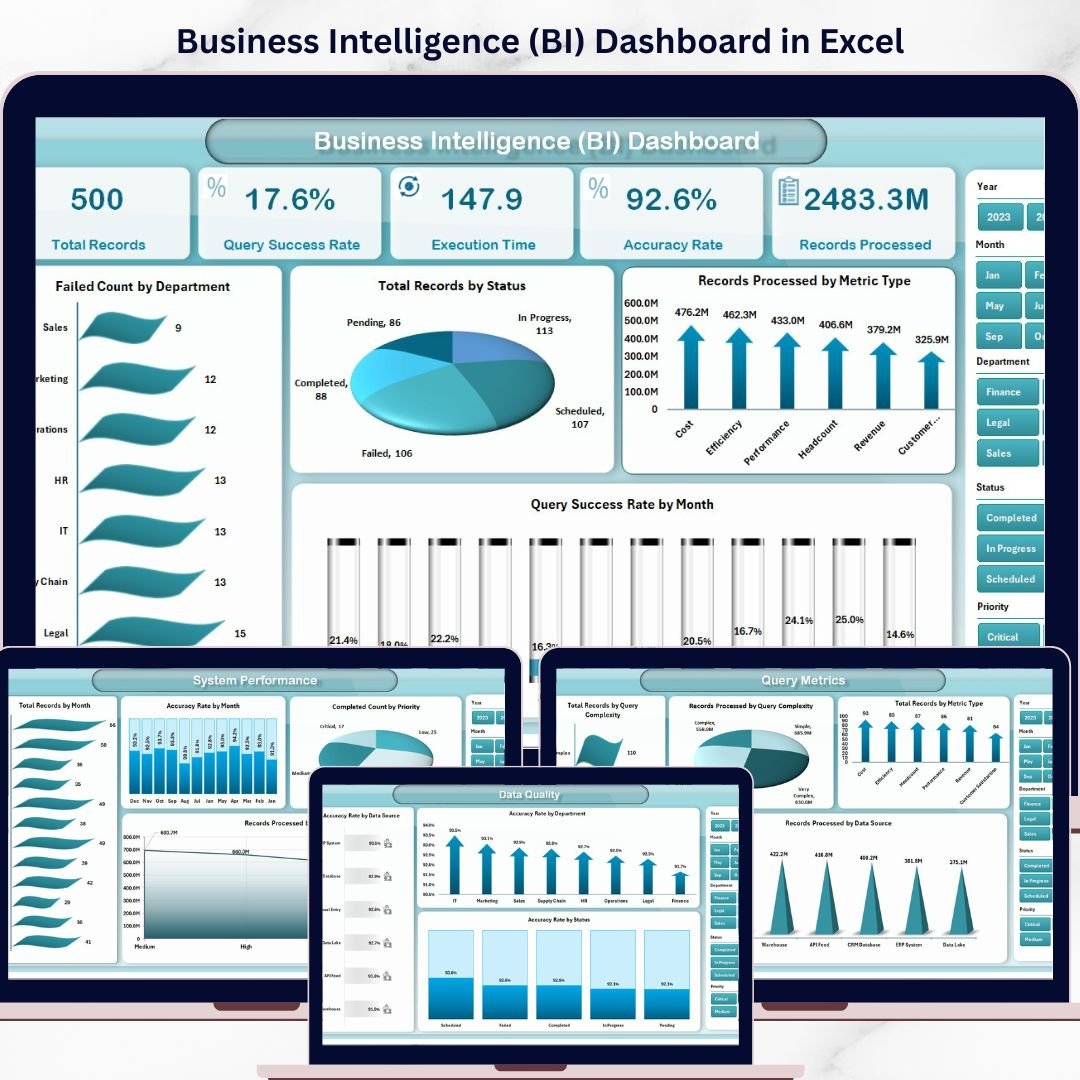
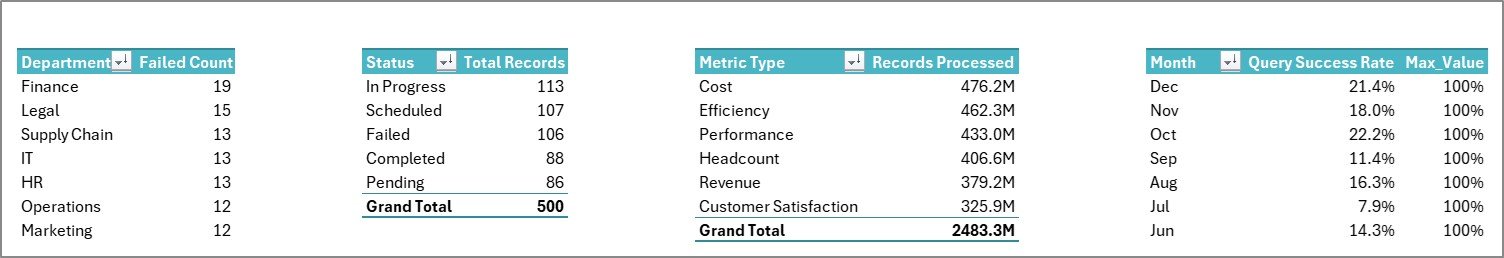
📦 What’s Inside the BI Dashboard in Excel
This dashboard includes 5 powerful analytical pages:
📊 Overview Page – Snapshot of overall business performance
🏢 Department Performance – Compare team efficiency
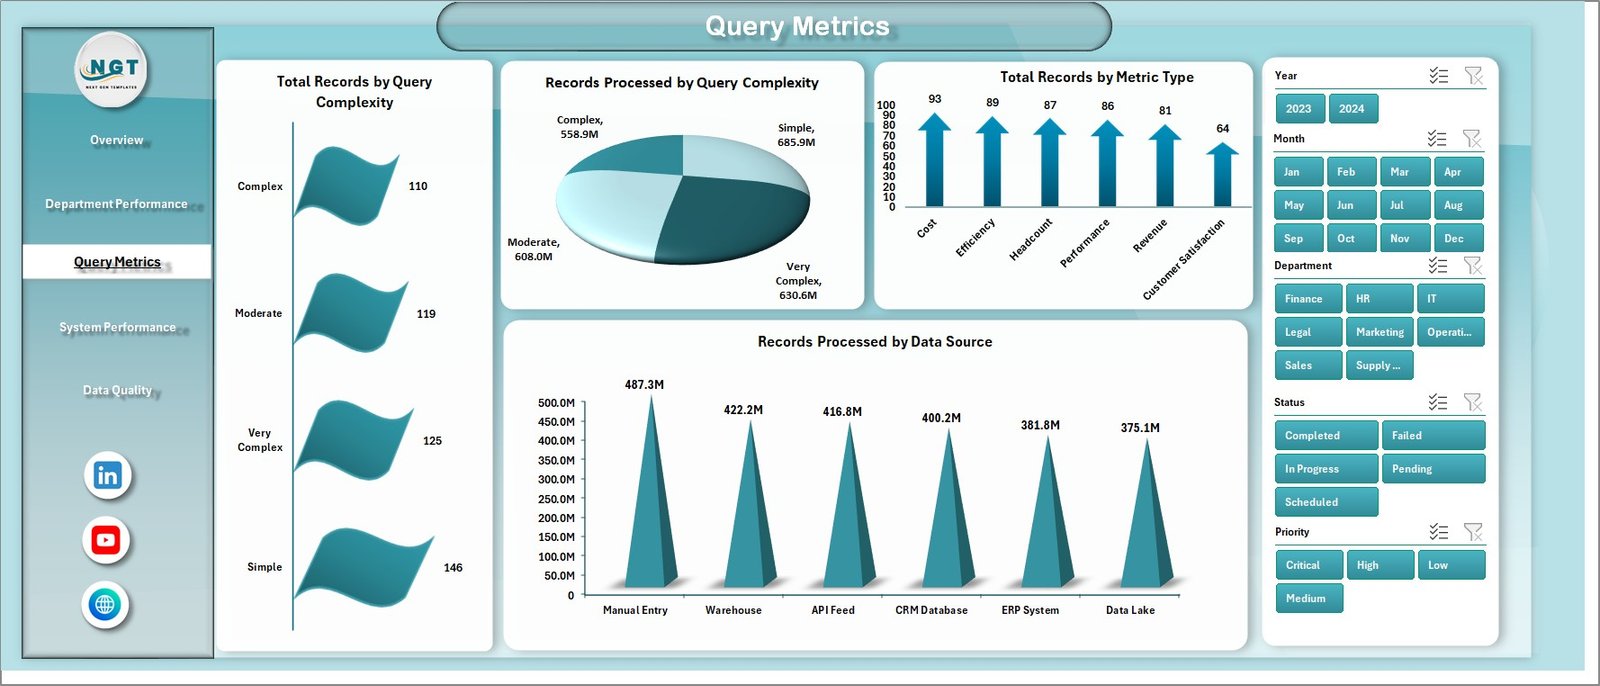
🔍 Query Metrics – Analyze data processing performance
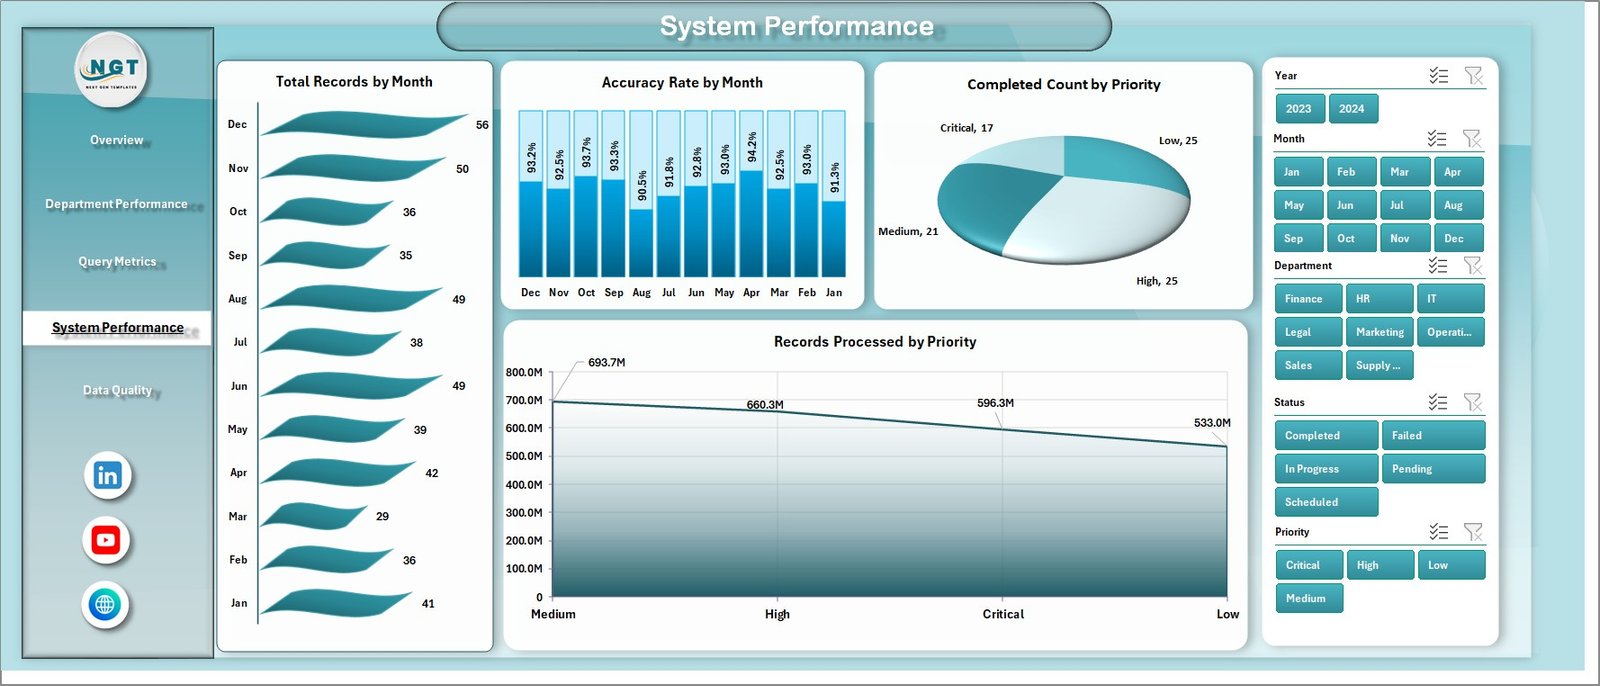
⚙️ System Performance – Monitor operational efficiency
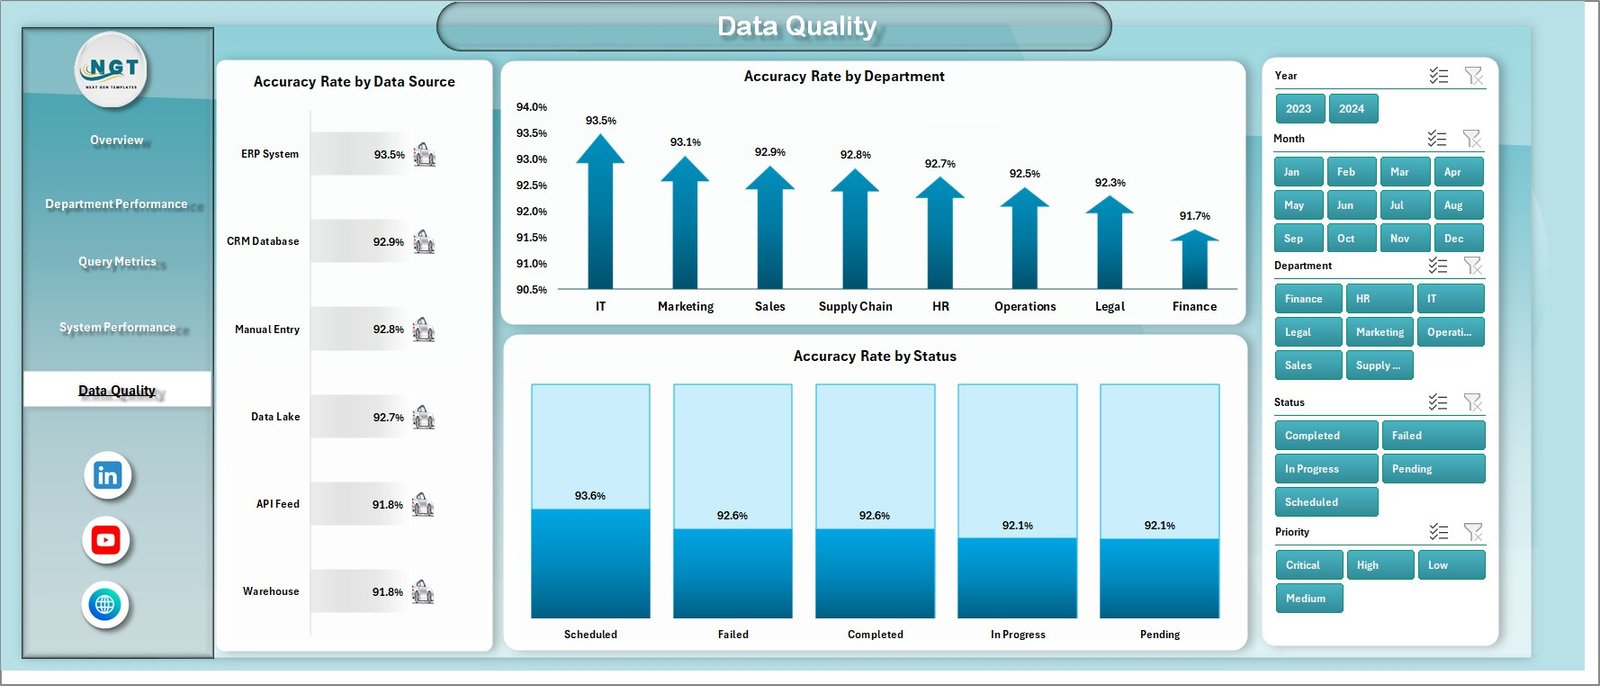
🧪 Data Quality Page – Ensure accuracy and reliability
📂 Additional Sheets:
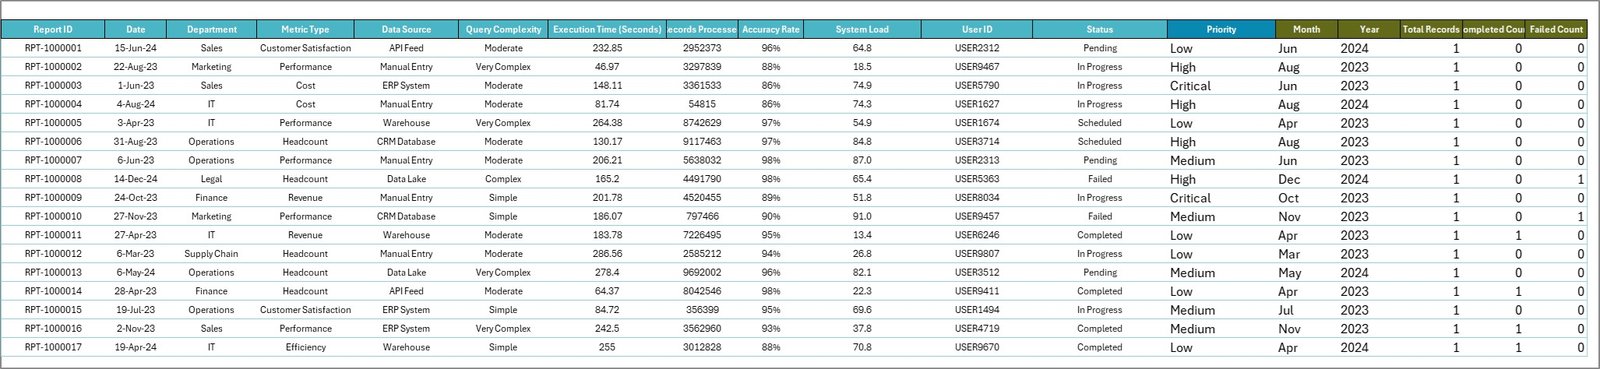
- Data Sheet – Stores raw business data
- Support Sheet – Pivot tables powering visuals
👉 Together, these components provide a complete 360° view of your business performance.
⚙️ How to Use the Business Intelligence Dashboard in Excel
Getting started is simple:
👉 Enter your data into the Data Sheet
👉 Refresh pivot tables and charts
👉 Use slicers to filter by department, priority, or time
👉 Analyze KPI cards and visuals
👉 Take data-driven actions
Within minutes, you can transform raw data into meaningful insights 📊.
👨💼 Who Can Benefit from This BI Dashboard in Excel
This dashboard is ideal for:
👨💼 Business Managers – Monitor performance and KPIs
📊 Data Analysts – Generate insights and reports
🏢 Operations Teams – Improve efficiency
💻 IT Professionals – Track system performance
📈 Consultants – Deliver data-driven strategies
👉 Anyone working with business data and analytics will benefit from this tool.
🔗 Click hare to read the Detailed blog post
Explore the full guide with features, advantages, and best practices.
👉 Visit our YouTube channel to learn step-by-step video tutorials:
https://youtube.com/@PKAnExcelExpert