
Boost your business development performance with this Business Development KPI Dashboard in Power BI — a smart, ready-to-use reporting solution designed to help teams track leads, deals, conversions, revenue, and growth KPIs effortlessly. If your team still depends on manual reports, scattered Excel sheets, or inconsistent tracking methods, this dashboard will completely transform the way you monitor performance and make decisions.
This powerful dashboard brings all KPI data into one interactive visual platform. It updates instantly when you refresh your Excel file, gives real-time insights, and helps you understand your performance clearly—without spending hours on manual work. Whether you are managing daily activities, monthly reviews, or yearly business targets, this dashboard becomes your all-in-one command center.
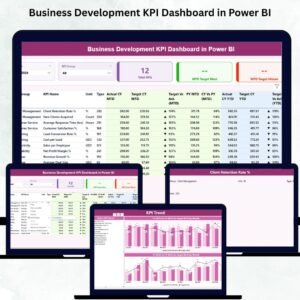
✨ Key Features of the Business Development KPI Dashboard in Power BI
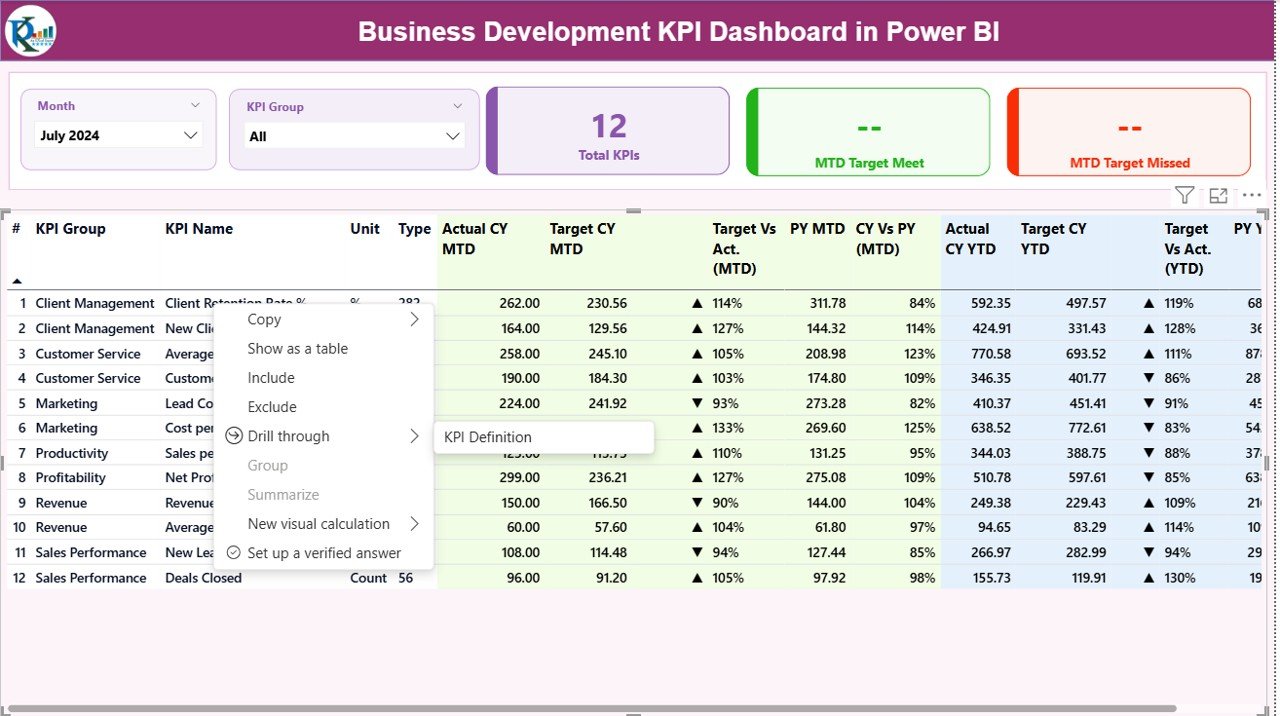
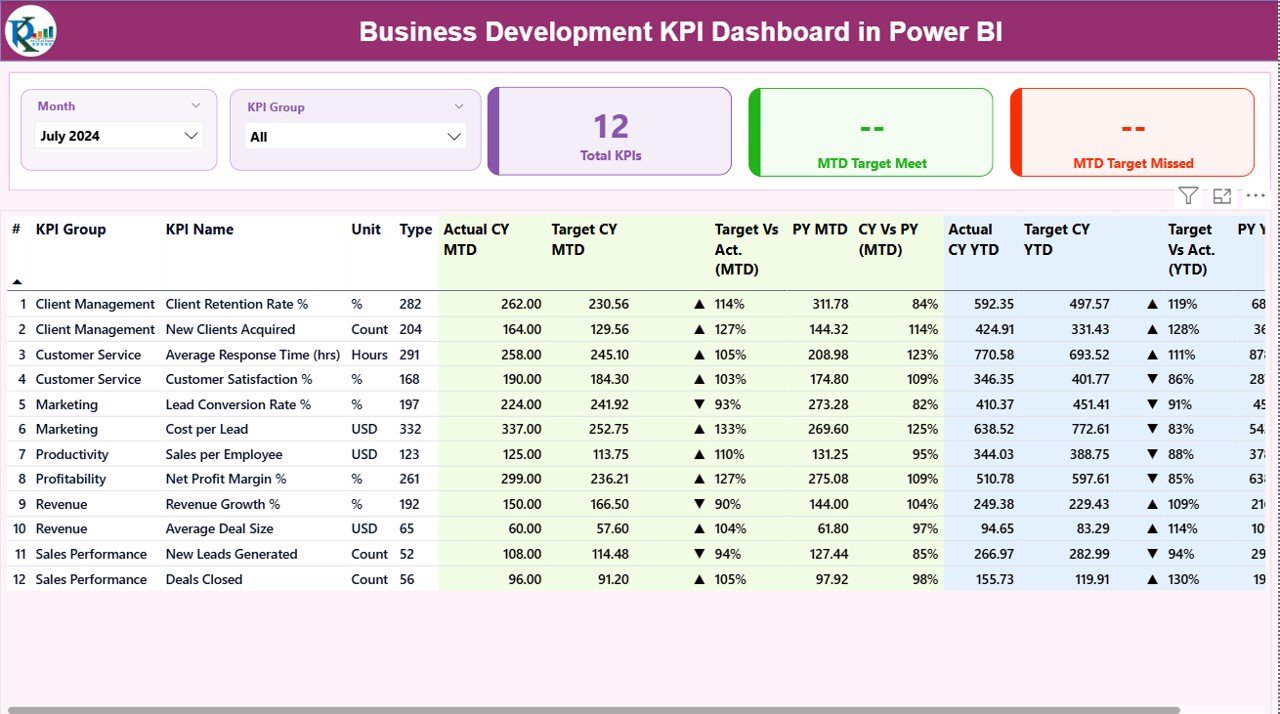
📊 Real-Time Performance Monitoring
Instantly compare MTD (Month-to-Date), YTD (Year-to-Date), and Previous Year metrics.
Track target achievement using intuitive green ▲ and red ▼ icons.
🎯 KPI Group & Month Filters
Analyze data the way you want using slicers for:
-
Month
-
KPI Group
-
KPI Name
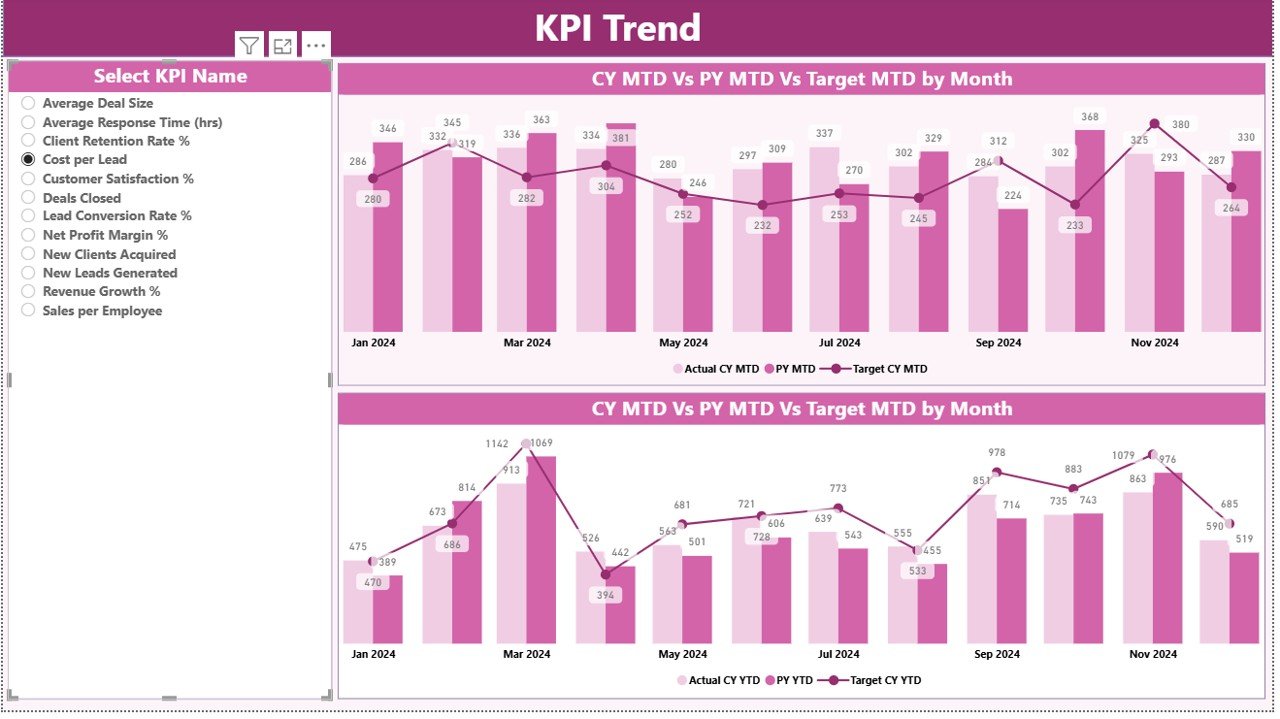
📈 Trend Charts (MTD & YTD)
Visualize month-by-month performance using:
-
MTD Trend Combo Chart
-
YTD Trend Combo Chart
See improvement patterns, compare YoY data, and spot growth opportunities instantly.
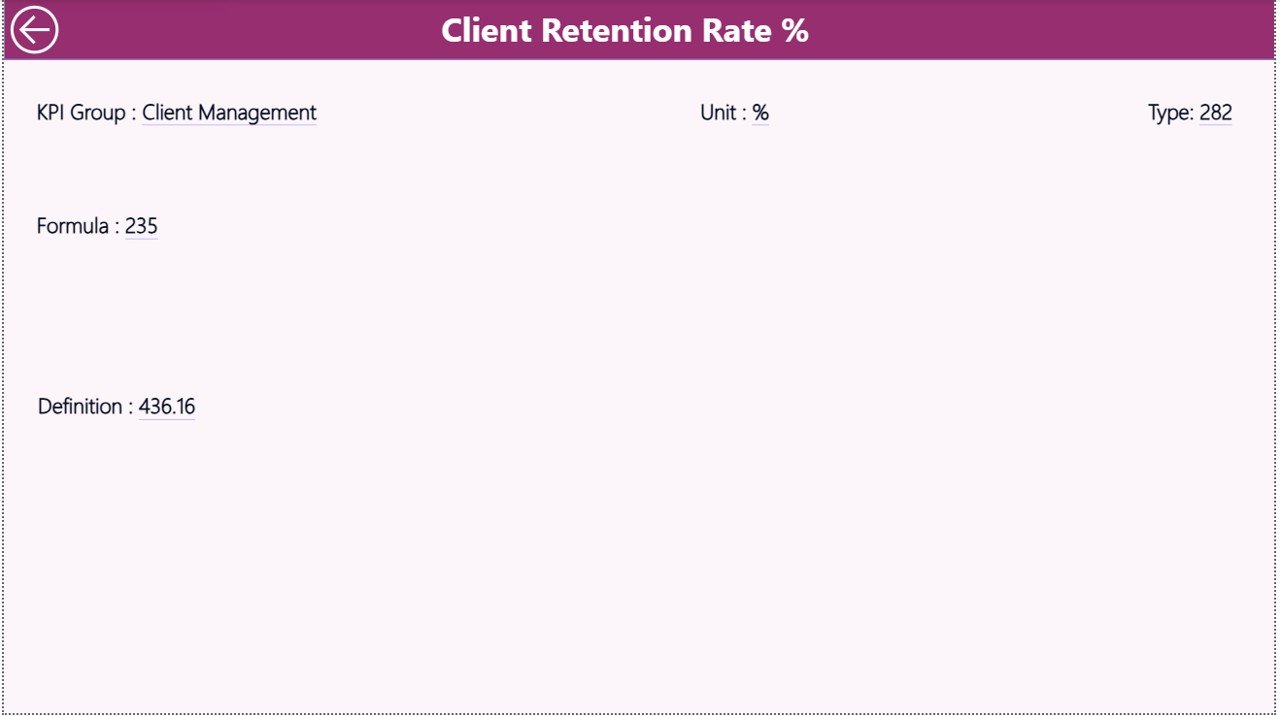
📘 Drill-Through KPI Definition Page
Understand each KPI clearly with:
-
Definition
-
Formula
-
Unit
-
KPI Type (UTB/LTB)
-
KPI Group
📥 Excel-Based Data Source
Easily update KPIs using three structured sheets:
-
Input_Actual
-
Input_Target
-
KPI Definition
Just update Excel → Refresh Power BI → Dashboard updates automatically.
📦 What’s Inside the Business Development KPI Dashboard?
This product includes:
🖥️ Power BI Dashboard File
Three powerful pages:
-
Summary Page (Main performance view)
-
KPI Trend Page (MTD/YTD visuals)
-
KPI Definition Page (Drill-through details)
📁 Excel Data Input File
Pre-structured templates for entering:
-
Actual MTD & YTD values
-
Monthly targets
-
KPI definitions
📄 Complete KPI Framework
Includes:
-
KPI numbering
-
KPI groups
-
Units
-
Formulas
-
Definitions
-
KPI type classification
📘 User-Friendly Navigation
Includes back buttons, slicers, and easy drill-through options.
This digital product is designed so even a beginner can operate it without any Power BI expertise.
🛠️ How to Use the Business Development KPI Dashboard in Power BI
Using this dashboard is extremely simple:
1️⃣ Update Data in Excel
Enter your latest KPI values in:
-
Actual sheet
-
Target sheet
-
KPI definition sheet
2️⃣ Refresh Power BI
Open Power BI → Click Refresh → Dashboard updates in seconds.
3️⃣ Use Slicers to Explore
Filter by:
-
Month
-
KPI group
-
KPI name
4️⃣ Analyze Trend Charts
Check how KPIs change month-by-month and year-by-year.
5️⃣ Drill Through for Clarity
Click any KPI → Drill-through → View formula, type & full details.
6️⃣ Share Insights with Your Team
Export visuals, share PBIX file, or publish through Power BI service.
👥 Who Can Benefit from This Business Development KPI Dashboard?
This template is designed for professionals who rely on data-driven insights:
💼 Business Development Teams
Track leads, meetings, conversions, revenue, and pipeline faster.
📈 Sales Managers & Executives
Monitor targets, performance, and monthly progress clearly.
🏢 Company Founders & Leadership Teams
Understand growth patterns and make smarter decisions.
📊 Strategy & Operations Teams
Use YoY and MoM trends to plan targets and align actions.
🧩 CRM, Marketing & Lead Management Teams
Gain visibility into performance across the entire funnel.
Whether you manage a small team or a large organization, this dashboard brings clarity, accuracy, and speed to your reporting workflow.
### Click here to read the detailed blog post
Watch the step-by-step video tutorial:


Reviews
There are no reviews yet.