Managing bridge inspections and maintenance data manually? That’s risky and inefficient 😓
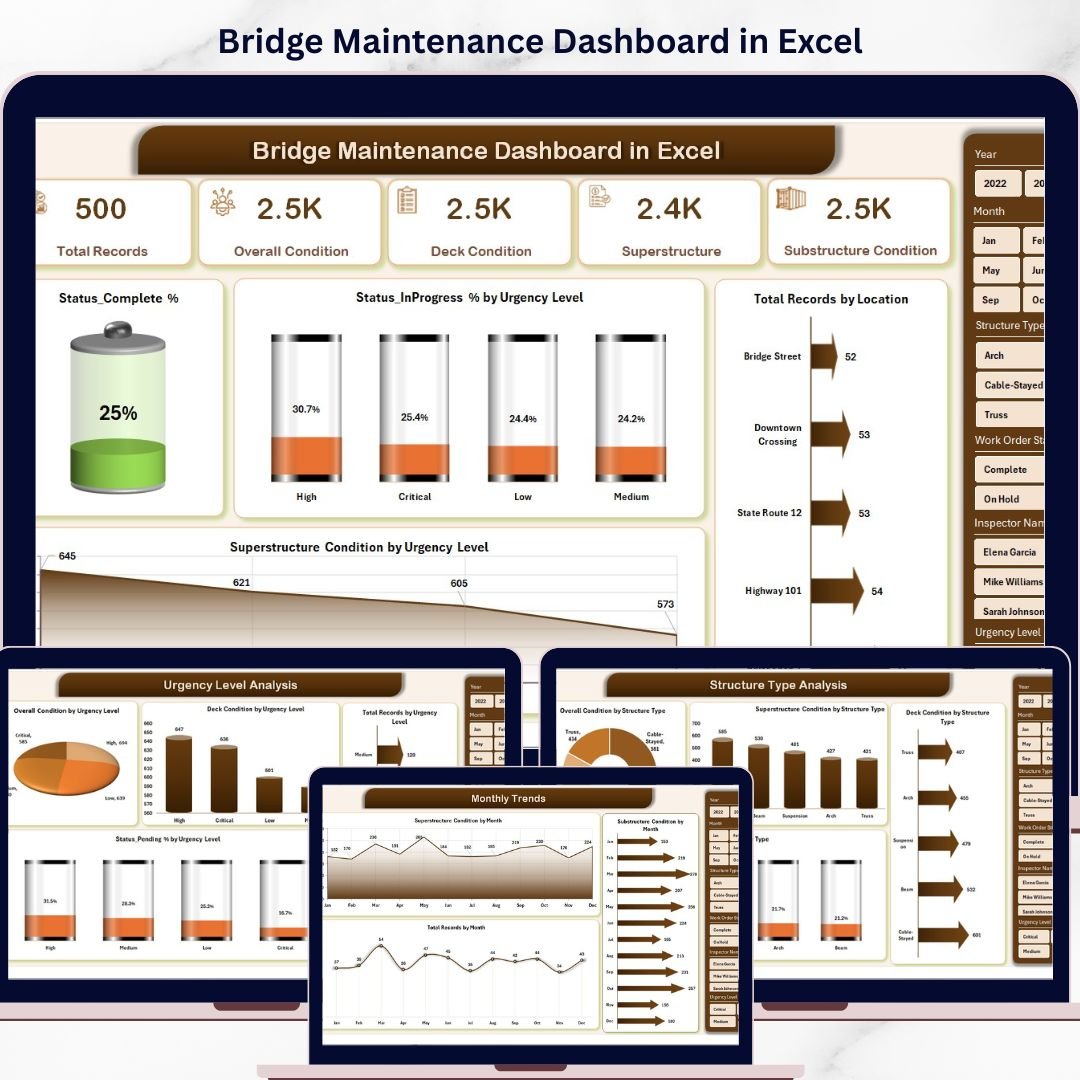
The Bridge Maintenance Dashboard in Excel is your ultimate solution to monitor bridge conditions, track inspections, and improve safety—all in one place 🚀.
In today’s infrastructure environment, engineers and authorities deal with massive datasets—from inspection reports to repair schedules. However, this ready-to-use dashboard transforms that complexity into clear visuals, KPI insights, and interactive analysis.
As a result, you can make faster, smarter, and data-driven decisions to ensure bridge safety and operational efficiency.
🚀 Key Feature of Bridge Maintenance Dashboard in Excel
✅ 📊 Interactive Excel Dashboard
Analyze bridge data using dynamic charts and slicers.
✅ 📈 KPI Monitoring System
Track inspection status, urgency levels, and structural conditions.
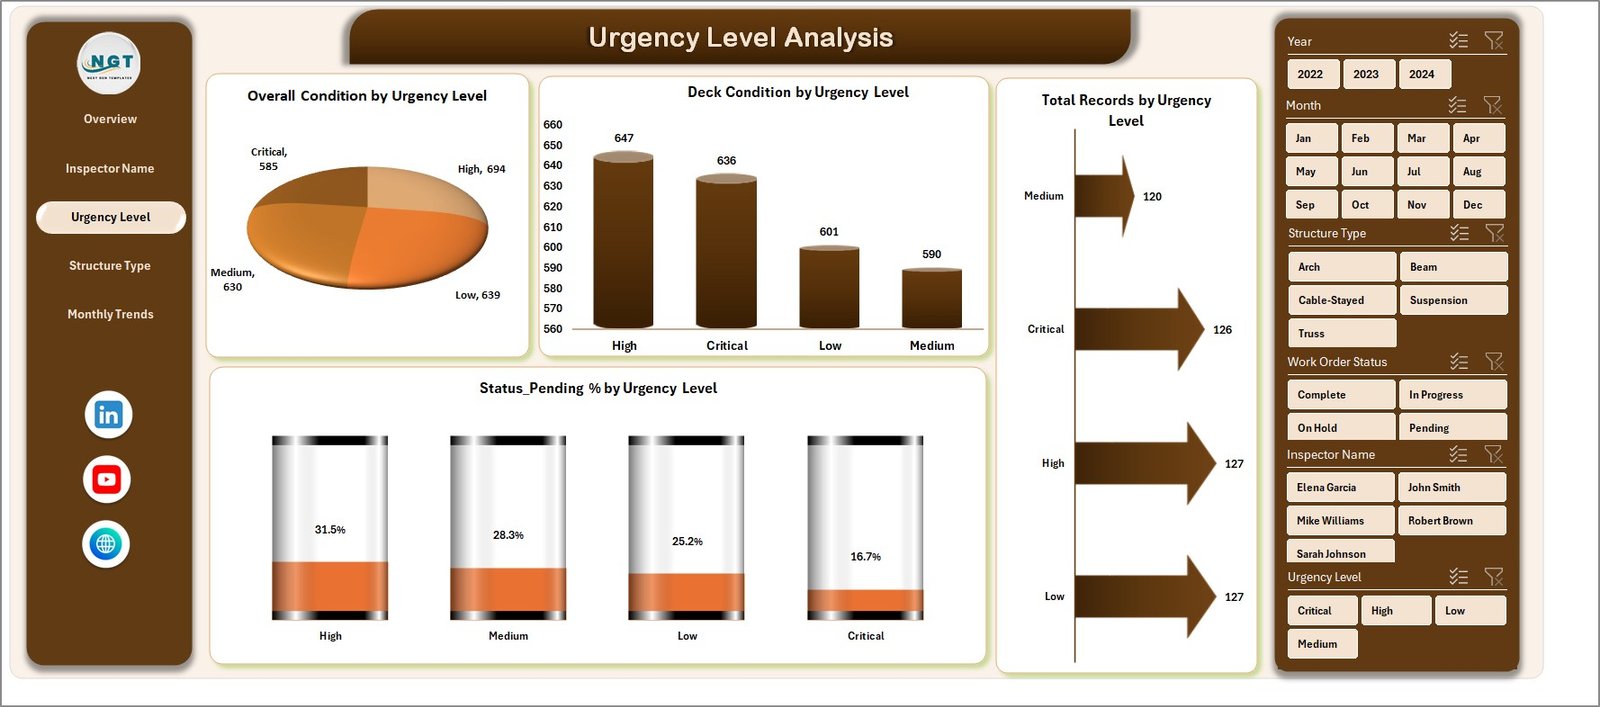
✅ ⚠️ Urgency-Based Analysis
Identify high-risk bridges that need immediate attention.
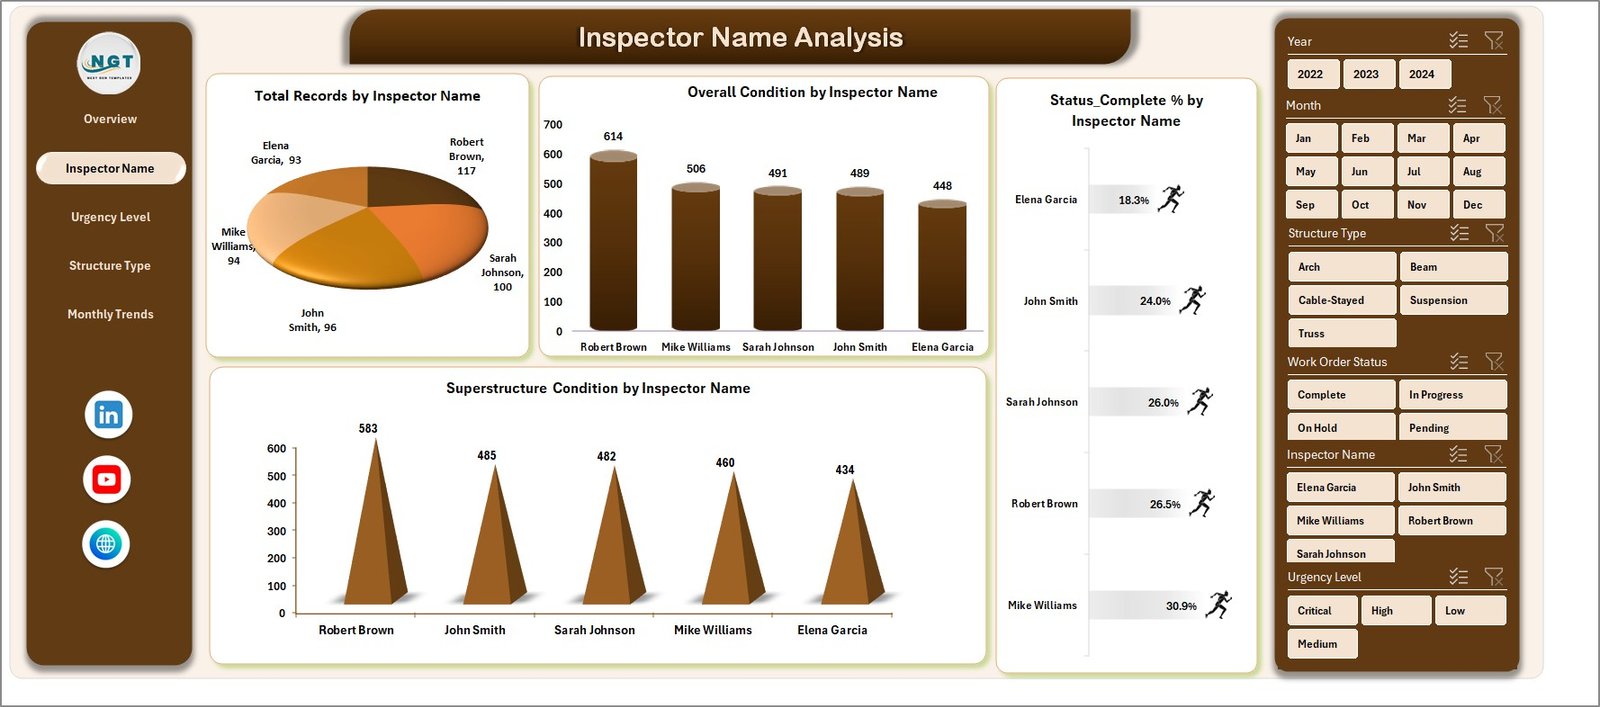
✅ 👷 Inspector Performance Tracking
Evaluate inspection efficiency and accountability.
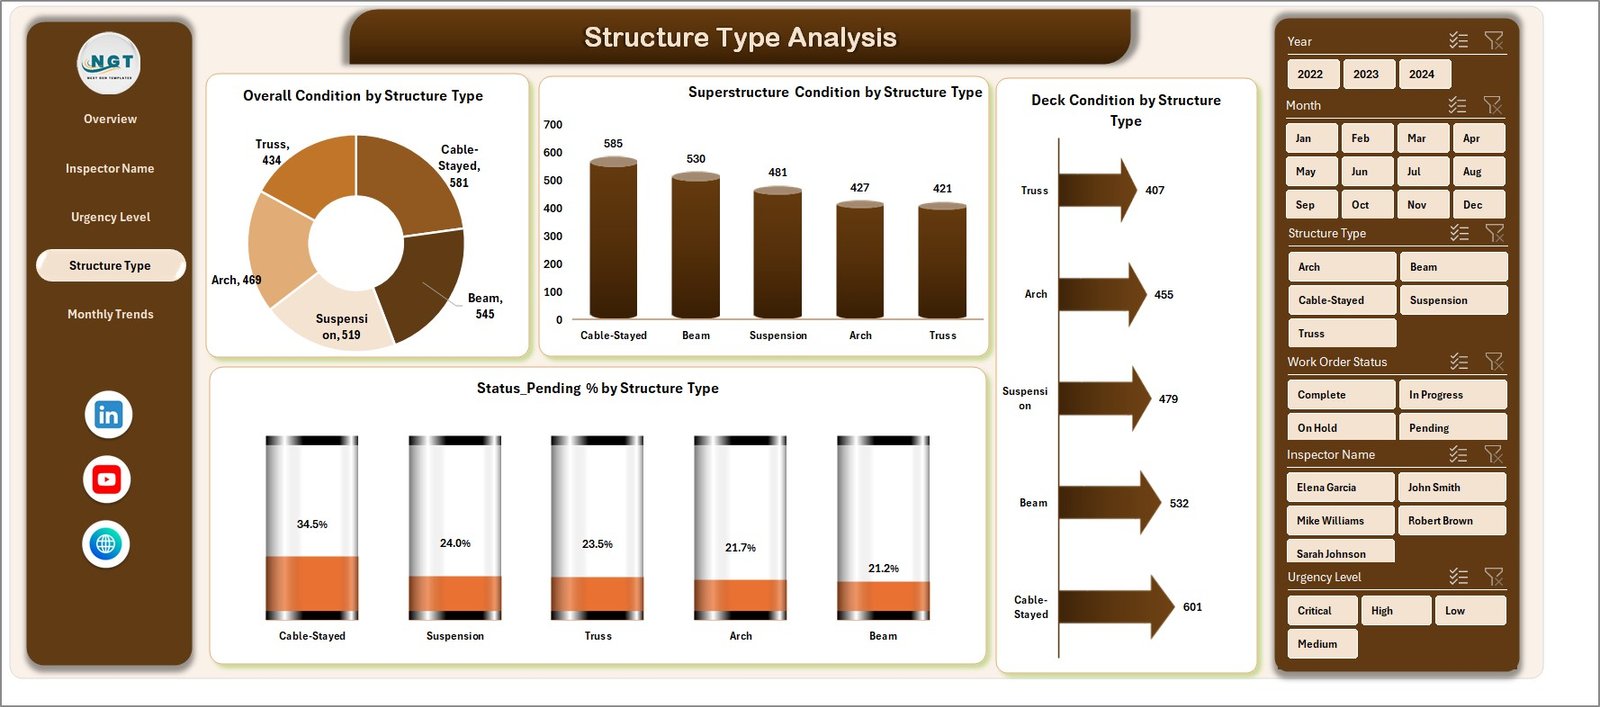
✅ 🏗 Structural Condition Insights
Monitor deck, superstructure, and substructure health.
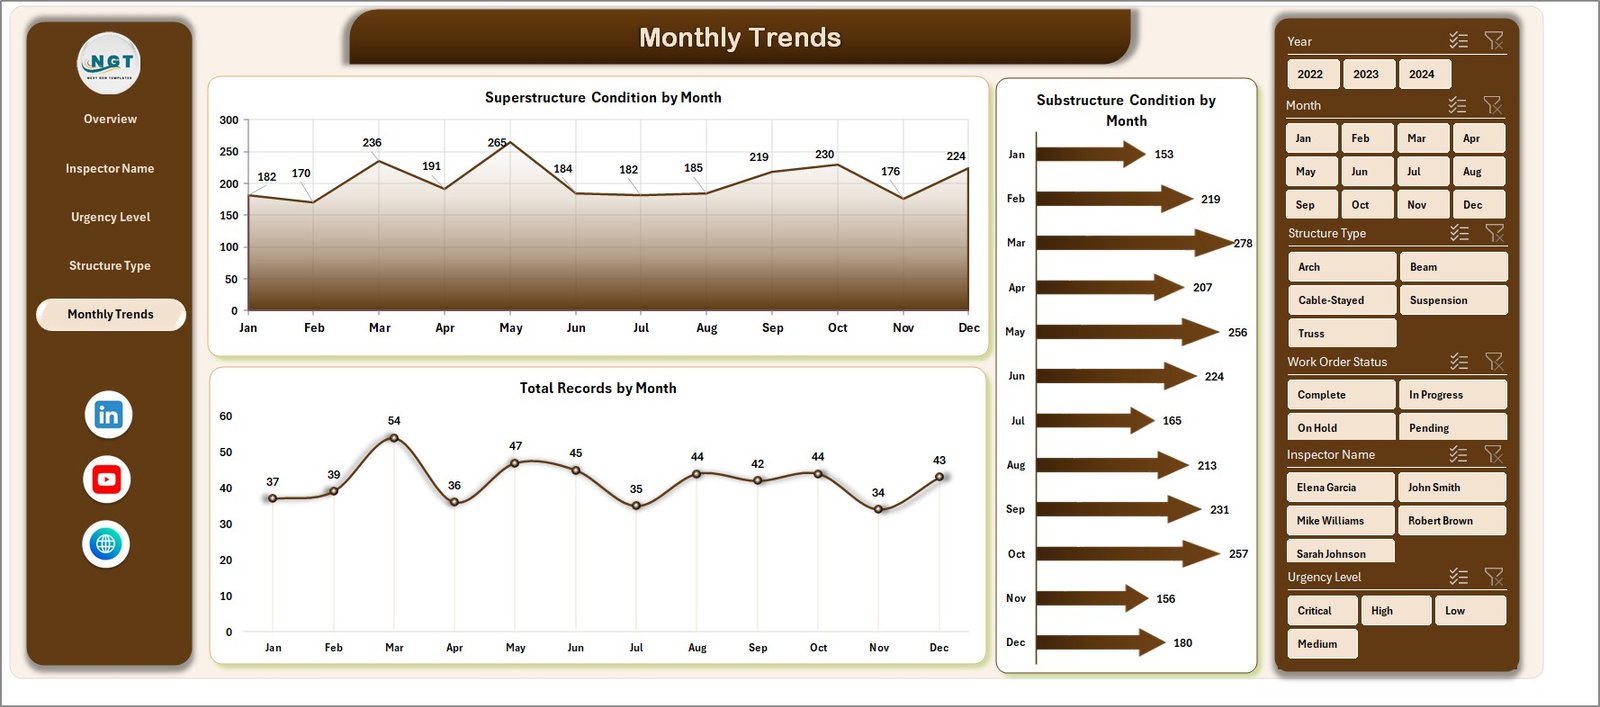
✅ 📅 Monthly Trend Analysis
Track performance changes over time.
✅ 📂 Organized Data Structure
Separate Data and Support sheets for smooth functionality.
📦 What’s Inside the Bridge Maintenance Dashboard in Excel
This dashboard includes 5 powerful analytical pages:
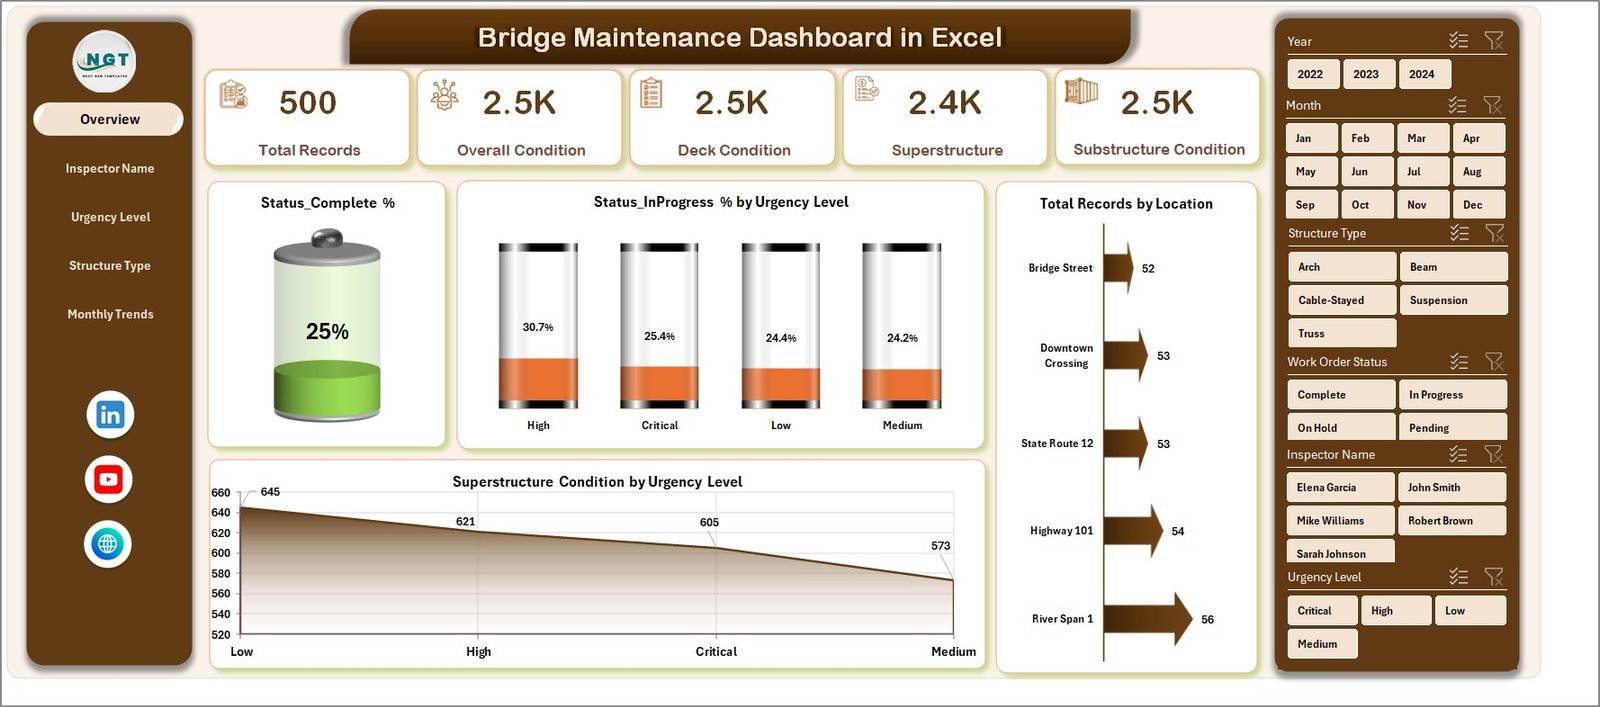
📊 Overview Page – Snapshot of overall bridge performance
👷 Inspector Analysis – Evaluate inspector efficiency
⚠️ Urgency Level Analysis – Prioritize maintenance tasks
🏗 Structure Type Analysis – Analyze structural conditions
📅 Monthly Trends – Monitor performance over time
📂 Additional Sheets:
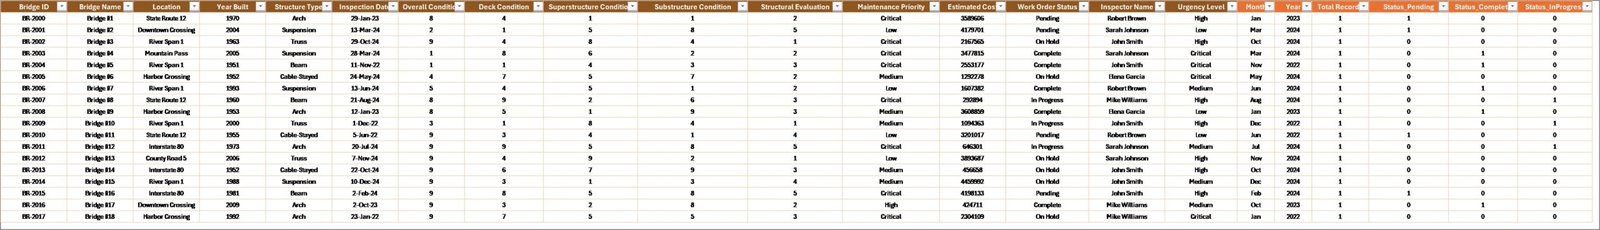
- Data Sheet – Input raw inspection data
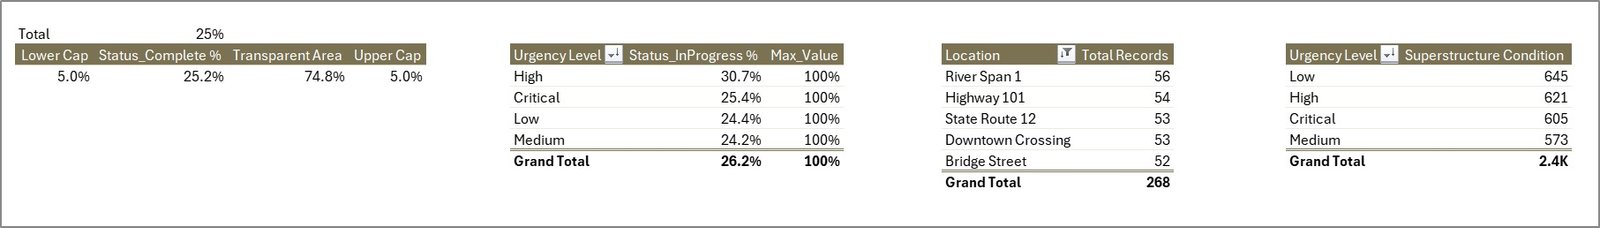
- Support Sheet – Pivot tables powering the dashboard
👉 Together, these components provide a complete 360° view of bridge maintenance operations.
⚙️ How to Use the Bridge Maintenance Dashboard in Excel
Getting started is simple:
👉 Enter inspection data into the Data Sheet
👉 Refresh pivot tables and charts
👉 Use slicers to filter by location, inspector, or urgency
👉 Analyze KPIs and visuals
👉 Take action based on insights
Within minutes, you can turn raw infrastructure data into powerful insights 📊.
👨💼 Who Can Benefit from This Bridge Maintenance Dashboard in Excel
This dashboard is ideal for:
🏗 Civil Engineers – Monitor structural conditions
🏛 Government Agencies – Ensure infrastructure safety
👷 Maintenance Teams – Track inspection and repair status
📊 Data Analysts – Generate insights and reports
🏢 Construction Companies – Improve maintenance planning
👉 Anyone involved in infrastructure management and safety will benefit from this tool.
🔗 Click hare to read the Detailed blog post
Explore the complete guide with features, advantages, and best practices.
👉 Visit our YouTube channel to learn step-by-step video tutorials:
https://youtube.com/@PKAnExcelExpert