Take control of your blockchain financial data with the Blockchain Finance Dashboard in Power BI 🚀. In today’s rapidly evolving financial ecosystem, thousands of crypto transactions and smart contract activities occur every second. However, managing this massive data manually can be overwhelming.
That’s where this powerful and ready-to-use dashboard becomes a game-changing solution.
It converts complex blockchain data into interactive visuals, KPI insights, and real-time analytics, helping you track transactions, monitor risks, and make faster, smarter financial decisions.
🚀 Key Feature of Blockchain Finance Dashboard in Power BI
✅ 📊 Interactive Power BI Dashboard
Visualize blockchain data using dynamic charts and slicers.
✅ 📈 Real-Time KPI Monitoring
Track transactions, gas fees, wallet behavior, and performance.
✅ 🔍 Advanced Filtering (Slicers)
Analyze data by blockchain type, transaction type, and status.
✅ ⚠️ Risk Detection System
Identify high-risk transactions instantly.
✅ 📅 Trend Analysis
Monitor monthly performance and growth patterns.
✅ 📊 Multi-Page Analytics
Explore insights across multiple dimensions.
✅ ⚡ Automated Data Insights
Reduce manual reporting and save time.
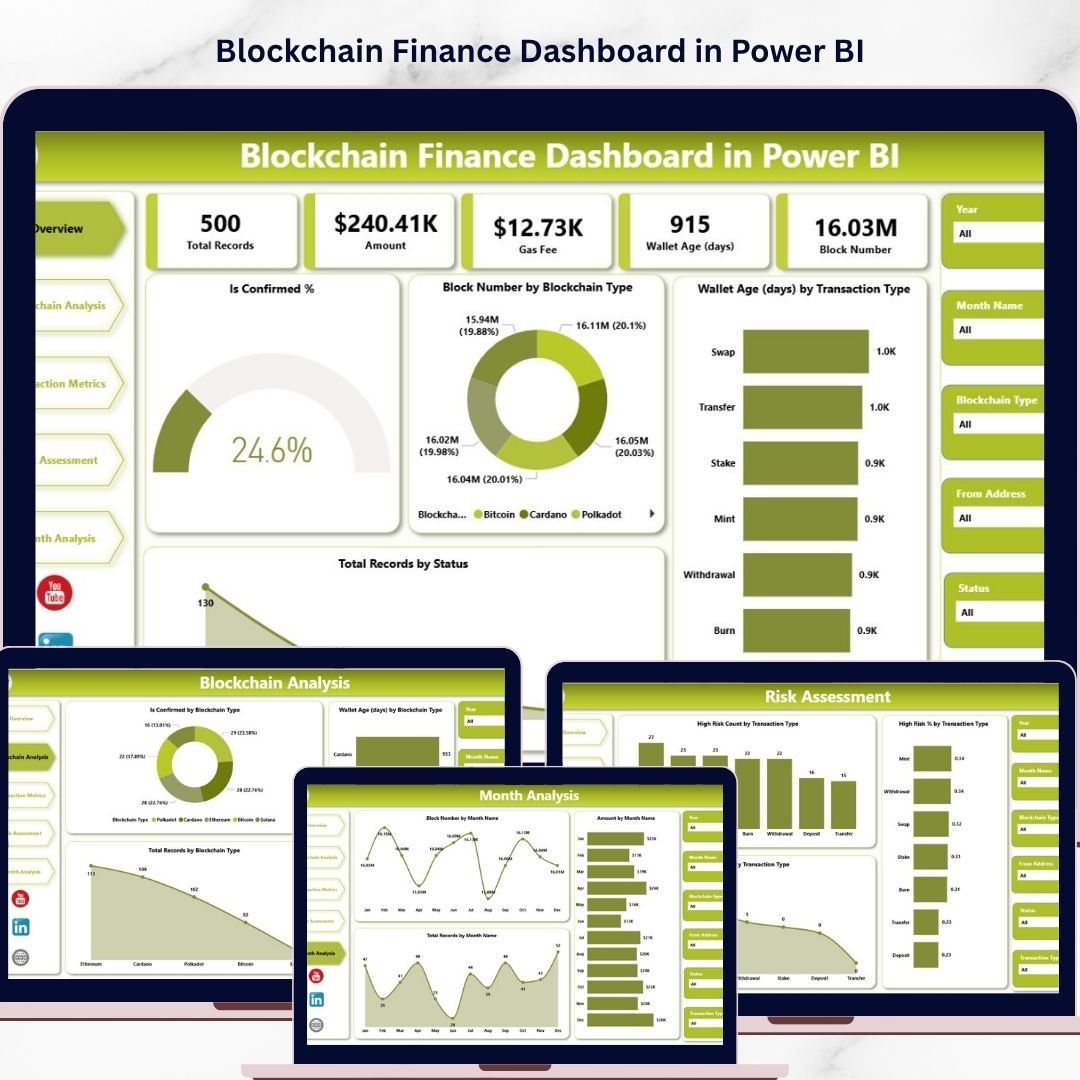
📦 What’s Inside the Blockchain Finance Dashboard in Power BI
This dashboard includes 5 powerful and interactive pages:
🏠 Overview Page – Snapshot of key KPIs and overall performance
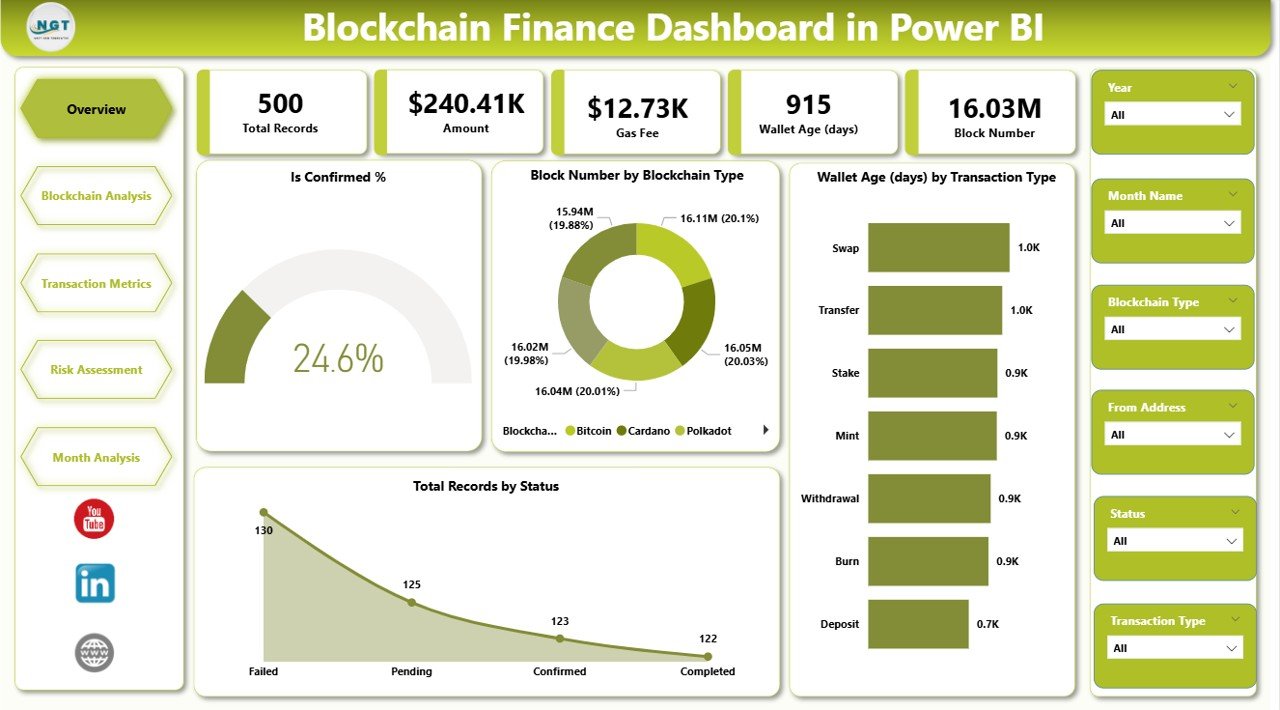
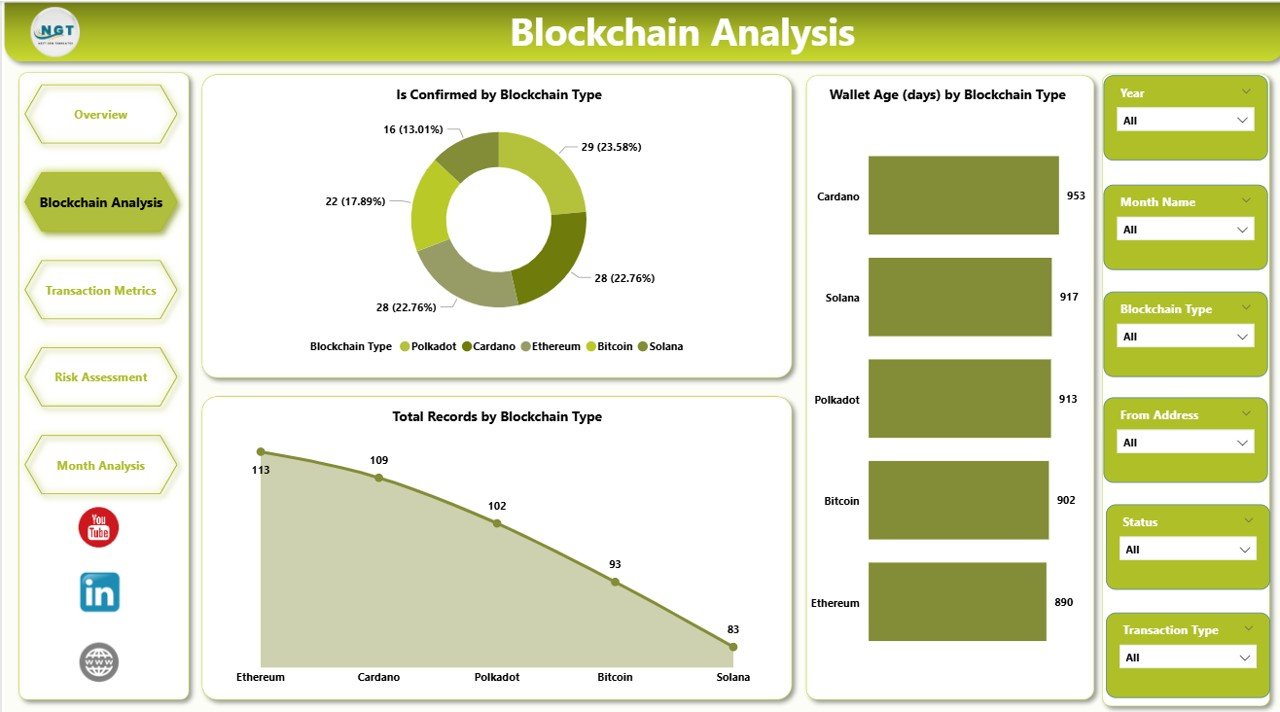
🔗 Blockchain Analysis – Compare performance across blockchain networks
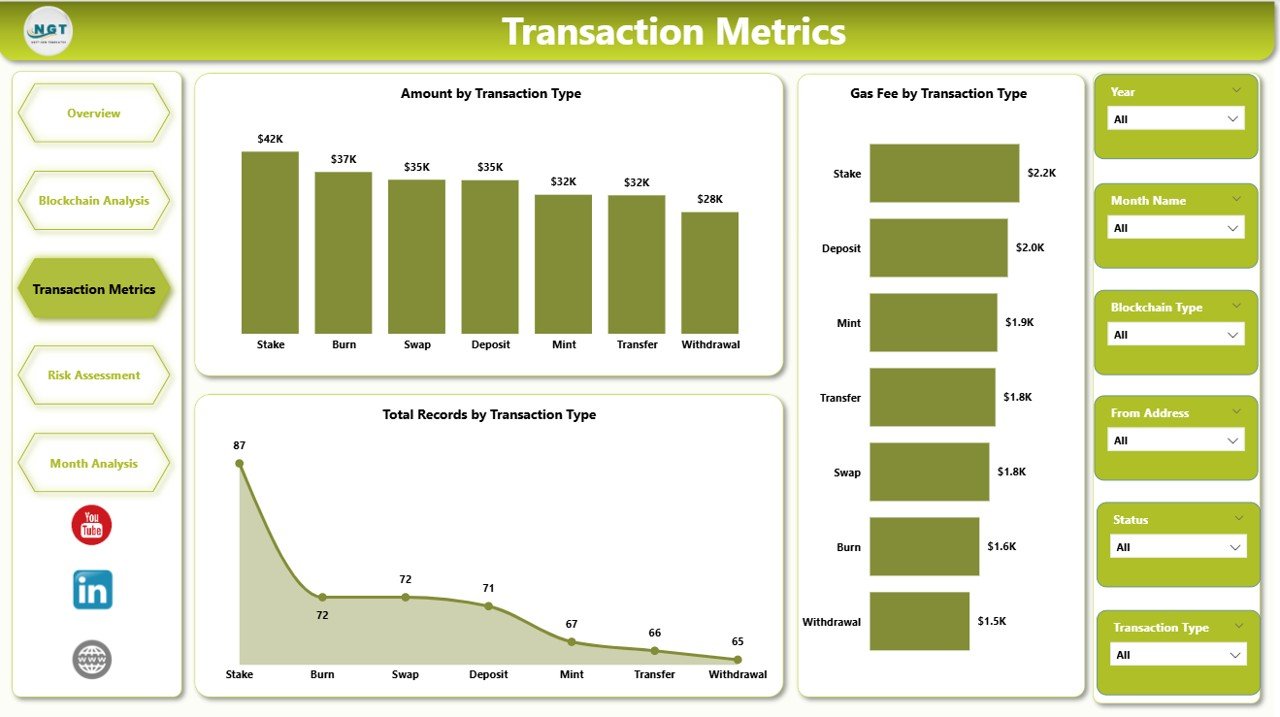
💸 Transaction Metrics – Analyze transaction values and gas fees
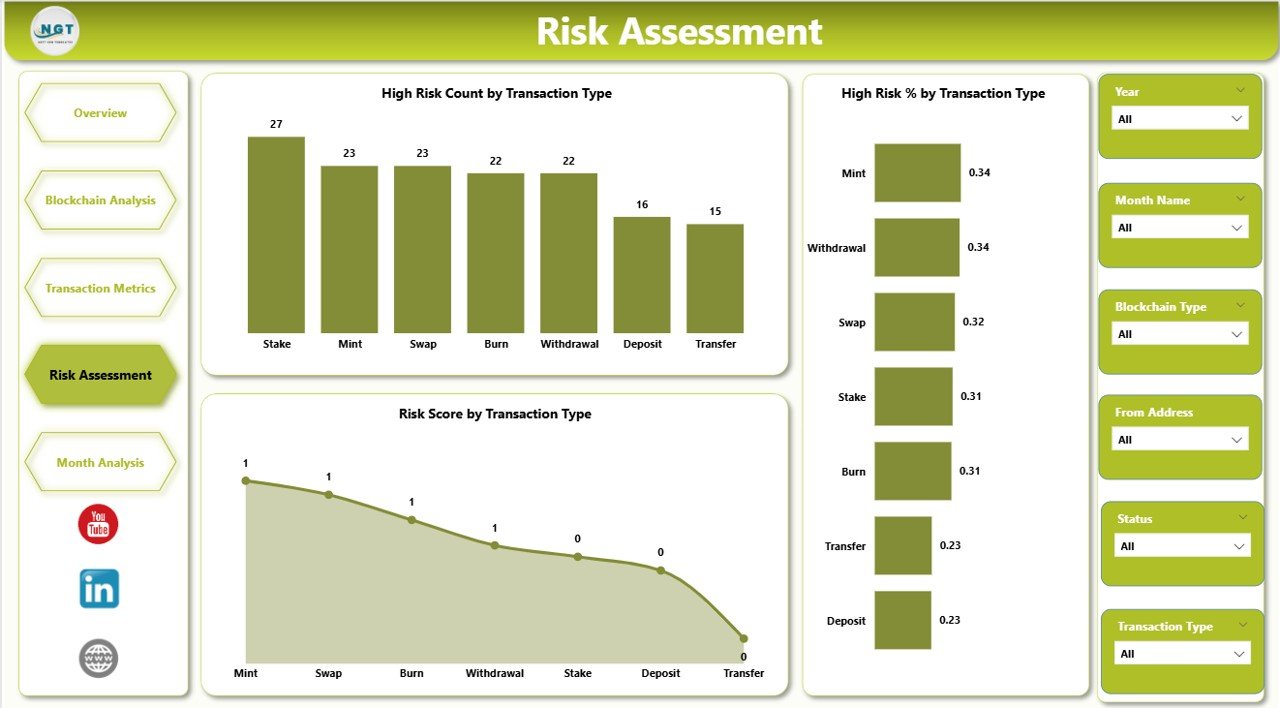
⚠️ Risk Assessment Page – Detect suspicious and high-risk activities
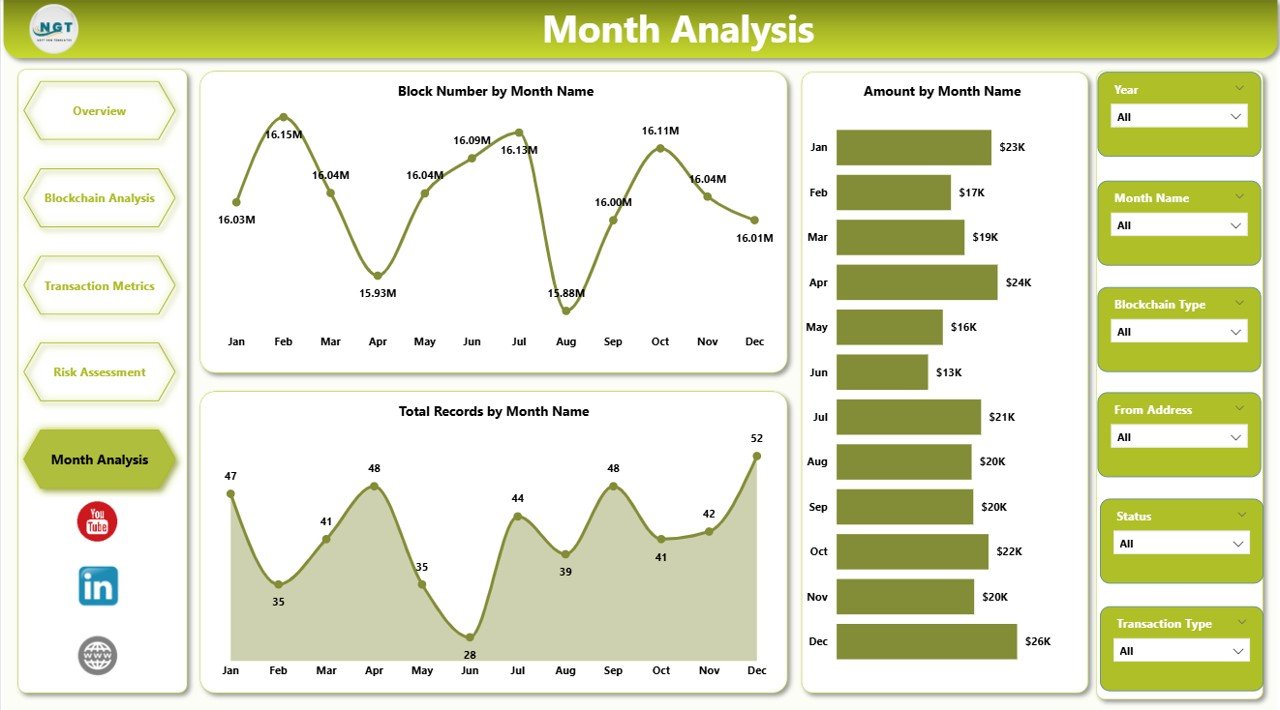
📅 Month Analysis – Track trends and performance over time
👉 Together, these pages provide a complete 360° view of blockchain financial data.
⚙️ How to Use the Blockchain Finance Dashboard in Power BI
Getting started is simple:
👉 Import your blockchain data into Power BI
👉 Connect it to the dashboard
👉 Use slicers to filter data dynamically
👉 Analyze KPI cards and visual charts
👉 Identify trends, risks, and performance gaps
Within minutes, you can transform raw blockchain data into actionable financial insights 📊.
👨💻 Who Can Benefit from This Blockchain Finance Dashboard in Power BI
This dashboard is ideal for:
💼 Financial Analysts – Analyze blockchain financial performance
🪙 Crypto Traders & Investors – Track transactions and risks
💻 Blockchain Developers – Monitor network activity
🏦 FinTech Companies – Improve financial analytics
🔐 Risk & Compliance Teams – Detect fraud and high-risk activities
👉 Anyone working with blockchain finance and analytics can benefit from this tool.
🔗 Click hare to read the Detailed blog post
Explore the complete guide with features, advantages, and best practices.
👉 Visit our YouTube channel to learn step-by-step video tutorials:
https://youtube.com/@PKAnExcelExpert