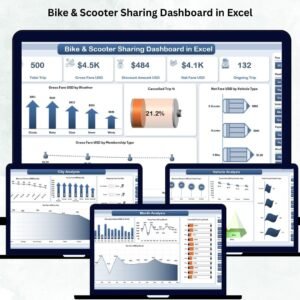
Bike & Scooter Sharing Dashboard changes at a rapid pace. As people search for eco-friendly, fast, and flexible travel alternatives, bike and scooter sharing services are expanding across major cities. But with this growth comes complex data—thousands of trips, multiple cities, weather variations, promotions, and different vehicle categories. Managing all this manually can become overwhelming. That’s where the Bike & Scooter Sharing Dashboard in Excel becomes the perfect solution. 🚲📊
This ready-to-use dashboard turns raw mobility data into clear charts, KPI cards, slicers, and automated insights—all inside Microsoft Excel. You don’t need technical skills or complex software. The dashboard helps you monitor trends, understand customer behavior, optimize fleet performance, and make faster decisions every day. Whether you manage a small fleet or operate in multiple cities, this tool gives you complete clarity in one place.
✨ Key Features of Bike & Scooter Sharing Dashboard in Excel
This dashboard comes with powerful features that make mobility analytics simple and effective.
📊 Instant KPI Insights
View key indicators such as:
-
Gross Fare
-
Net Fare
-
Cancelled Trip %
-
Ongoing Trip %
-
Membership & Promo Performance
These KPIs help you understand operations within seconds.
🚲 Vehicle & City-Level Performance
Analyze how different vehicle types and cities contribute to revenue, trip volume, and operations.
🌦️ Weather-Based Insights
Understand how temperature, rain, and seasonal patterns affect rider behavior.
🎛️ Full Slicer Control
Use slicers to filter by city, vehicle type, weather, promo type, membership, or month.
⚡ Fully Automated Structure
Just update your Data Sheet and the entire dashboard refreshes automatically.
📦 What’s Inside the Bike & Scooter Sharing Dashboard in Excel
This dashboard includes five analytical pages, each giving precise insights.
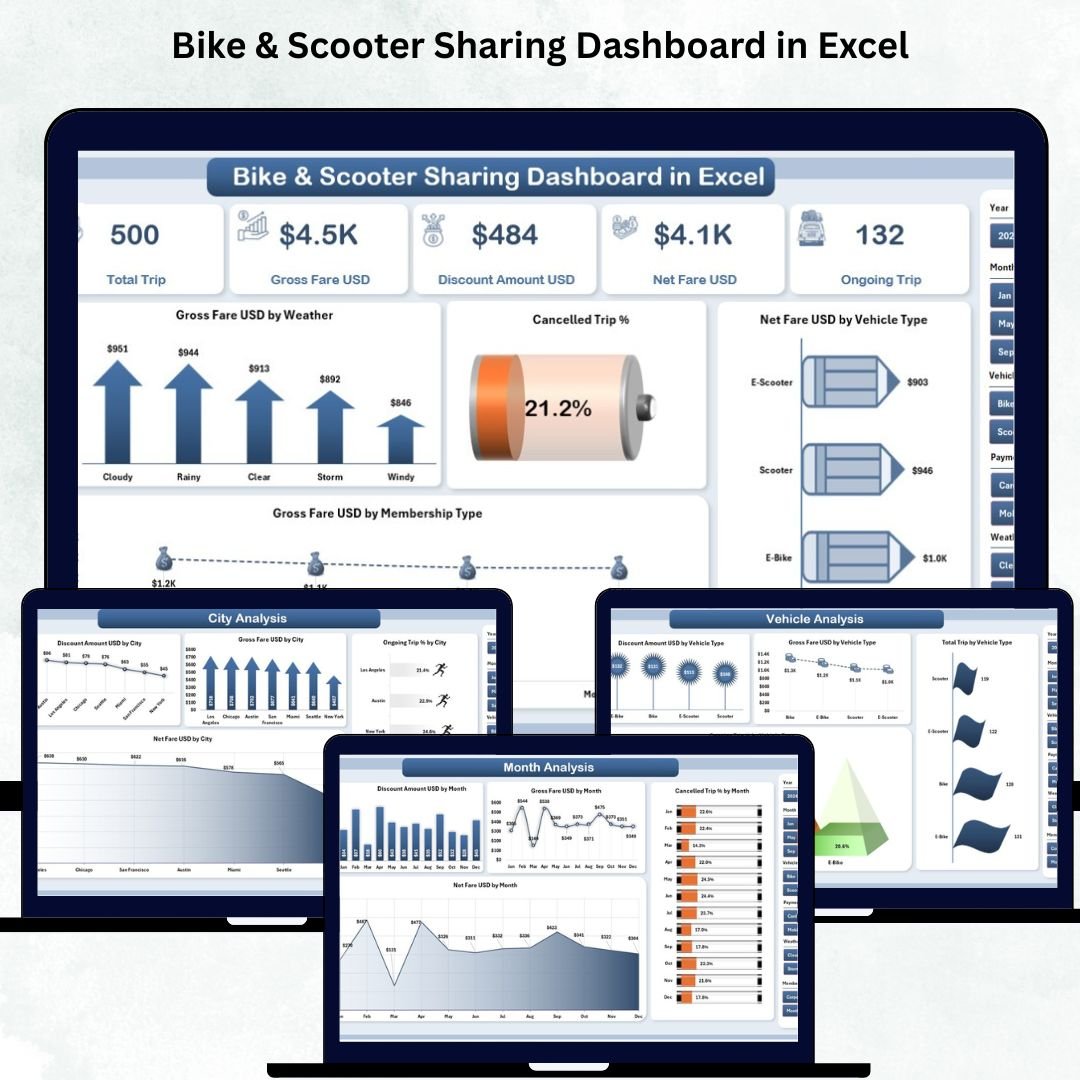
1️⃣ Overview Page
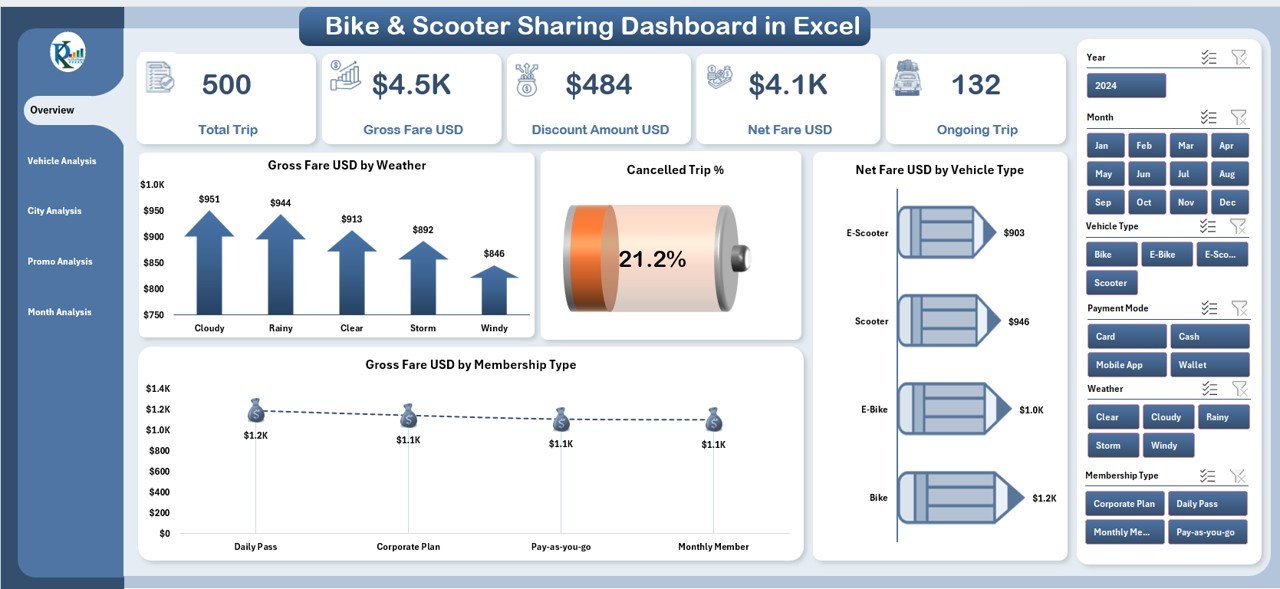
The main control center includes:
-
A Page Navigator for quick movement
-
5 KPI cards on the right-side silencer
-
4 powerful charts showing:
-
Gross Fare by Weather
-
Cancelled Trip %
-
Net Fare by Vehicle Type
-
Gross Fare by Membership Type
-
This page reveals your overall performance instantly.
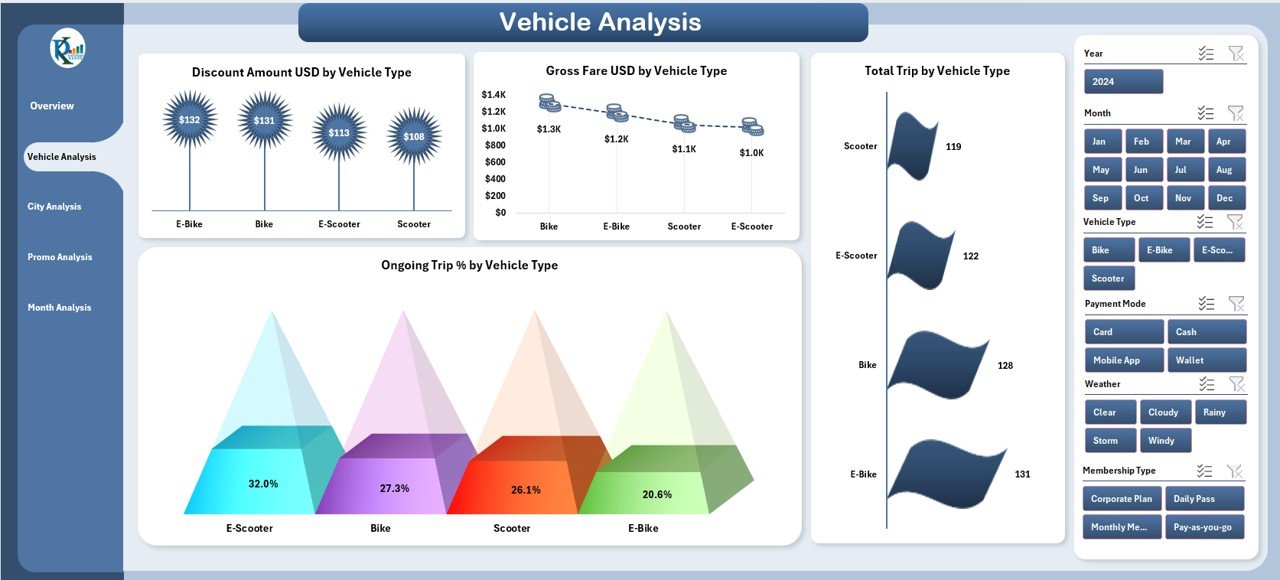
2️⃣ Vehicle Analysis Page
This page shows how each vehicle category performs.
Charts include:
-
Discount Amount by Vehicle Type
-
Gross Fare by Vehicle Type
-
Ongoing Trip %
-
Total Trips by Vehicle Type
Perfect for fleet optimization and procurement planning.
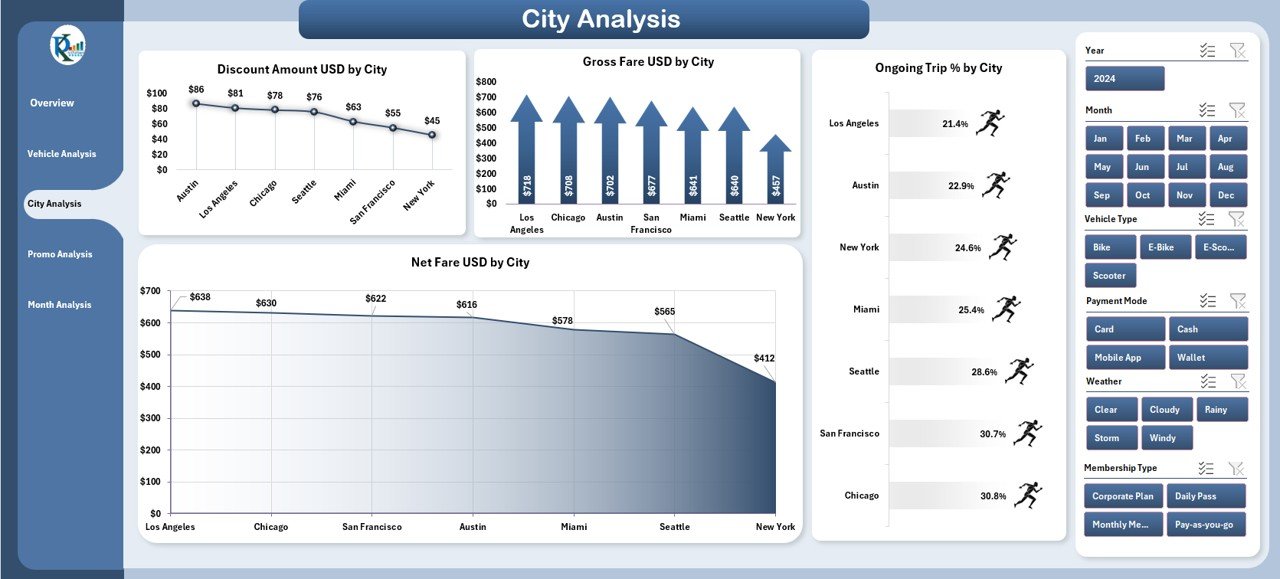
3️⃣ City Analysis Page
Understand differences across all operating cities.
Charts include:
-
Discount Amount by City
-
Gross Fare by City
-
Ongoing Trip %
-
Net Fare by City
Ideal for expansion planning, city-level promotions, and fleet distribution.
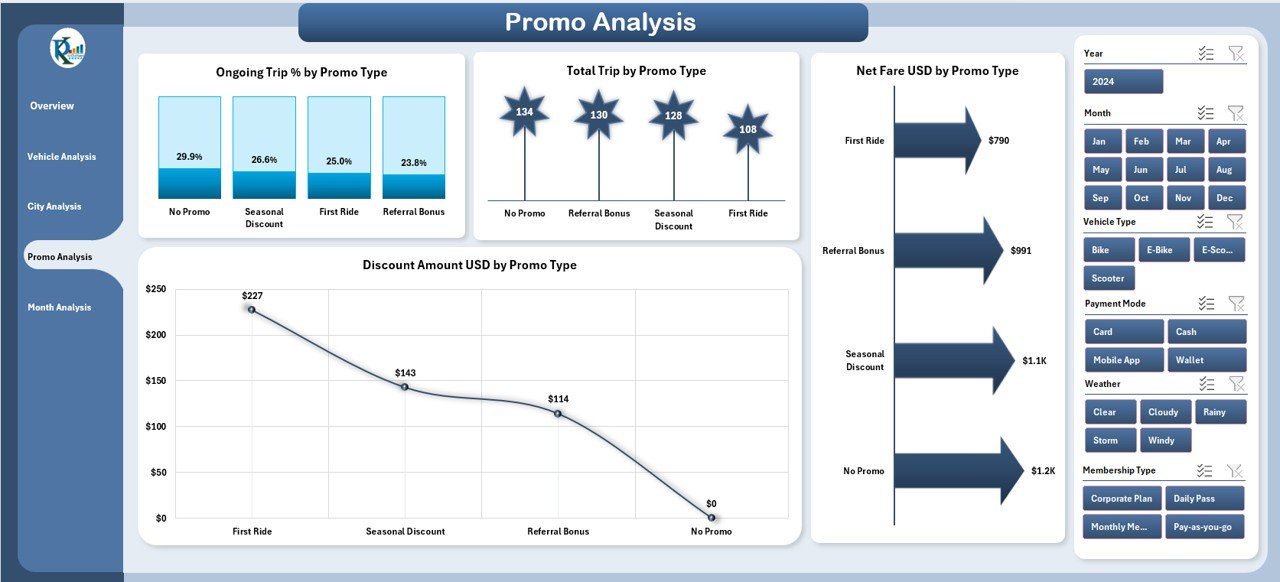
4️⃣ Promo Analysis Page
Evaluate promo effectiveness with:
-
Discount Amount by Promo Type
-
Ongoing Trip % by Promo Type
-
Net Fare by Promo Type
-
Total Trips by Promo Type
Helps marketing teams refine strategies and stop ineffective promotions.
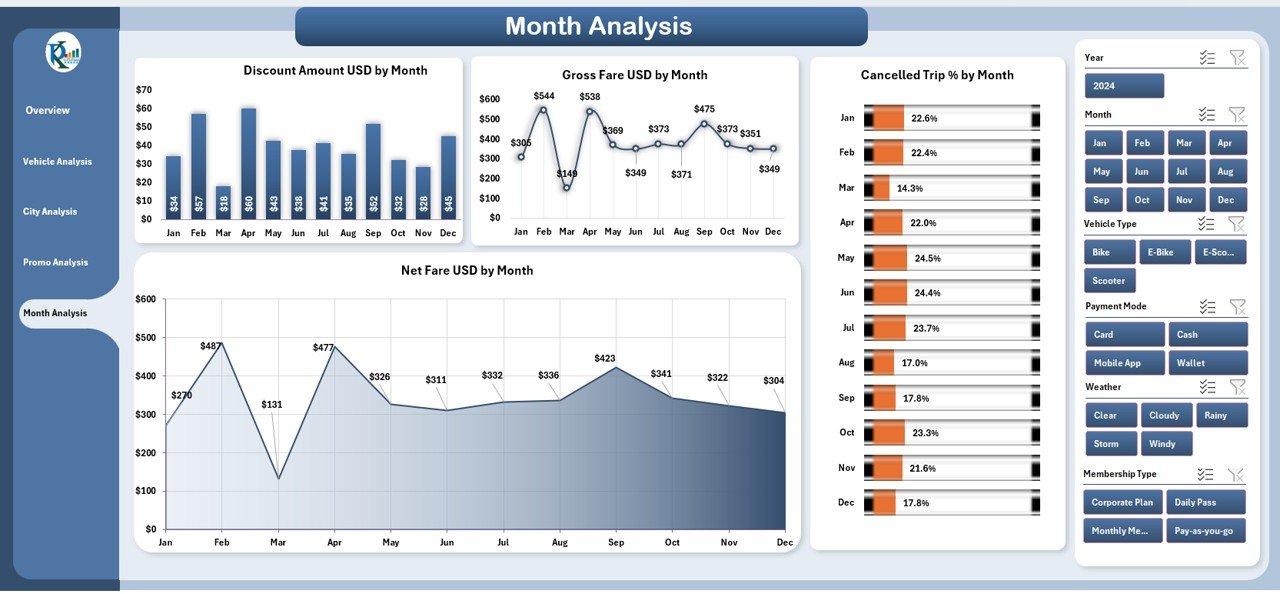
5️⃣ Month Analysis Page
Track seasonal and monthly fluctuations:
-
Discount by Month
-
Net Fare by Month
-
Gross Fare by Month
-
Cancelled Trip % by Month
This page supports forecasting, budgeting, and trend tracking.
🛠️ How to Use the Bike & Scooter Sharing Dashboard in Excel
This dashboard is beginner-friendly and easy to set up:
1️⃣ Enter your trip and revenue data into the Data Sheet
2️⃣ Refresh the dashboard
3️⃣ Use slicers to filter by weather, city, membership, vehicle, month, or promo type
4️⃣ Explore the pages to see detailed analysis
5️⃣ Make faster, smarter decisions backed by clean data
Everything is automated—no formulas or coding needed. ⚡
🎯 Who Can Benefit from This Dashboard?
This dashboard is ideal for:
-
🚲 Mobility Startups
-
🛴 Scooter Sharing Companies
-
🏙️ City Planners
-
🚴 Fleet Managers
-
💼 Operations Teams
-
📊 Data Analysts
-
📈 Growth & Marketing Teams
Anyone who needs clear insights into urban mobility performance will benefit from this template.
### Click here to read the Detailed blog post
Visit our YouTube channel to learn step-by-step video tutorials
👉 Youtube.com/@PKAnExcelExpert


Reviews
There are no reviews yet.