Managing audits, internal controls, and compliance activities becomes significantly easier when you have the right performance tracking system. Manual reports, scattered Excel files, and unclear KPI definitions often create confusion, delays, and poor visibility. This is why organizations across all industries are switching to automated performance dashboards—because clarity drives better decision-making.
The Audit & Internal Controls KPI Dashboard in Excel is a fully dynamic, ready-to-use performance management tool designed to give audit teams complete visibility of MTD (Month-to-Date), YTD (Year-to-Date), and Previous Year performance. With automation, interactive visuals, and user-friendly input sheets, this dashboard helps you run your audit operations with greater control, transparency, and speed.
This professionally designed template is perfect for organizations that want to strengthen governance, improve accountability, and monitor internal control efficiency with zero coding and zero complexity.
✨ Key Features of the Audit & Internal Controls KPI Dashboard in Excel
This dashboard is packed with powerful features that simplify complex audit processes and give you a clear performance snapshot in seconds:
📊 Fully Dynamic Dashboard
Every number and chart updates instantly when you select a month from the drop-down. You can analyze Actuals, Targets, and Previous Year values on the same screen.
📈 Comprehensive Trend Analysis
Study how each KPI behaved over time with MTD/YTD trend charts. Spot patterns, performance gaps, and improvement areas effortlessly.
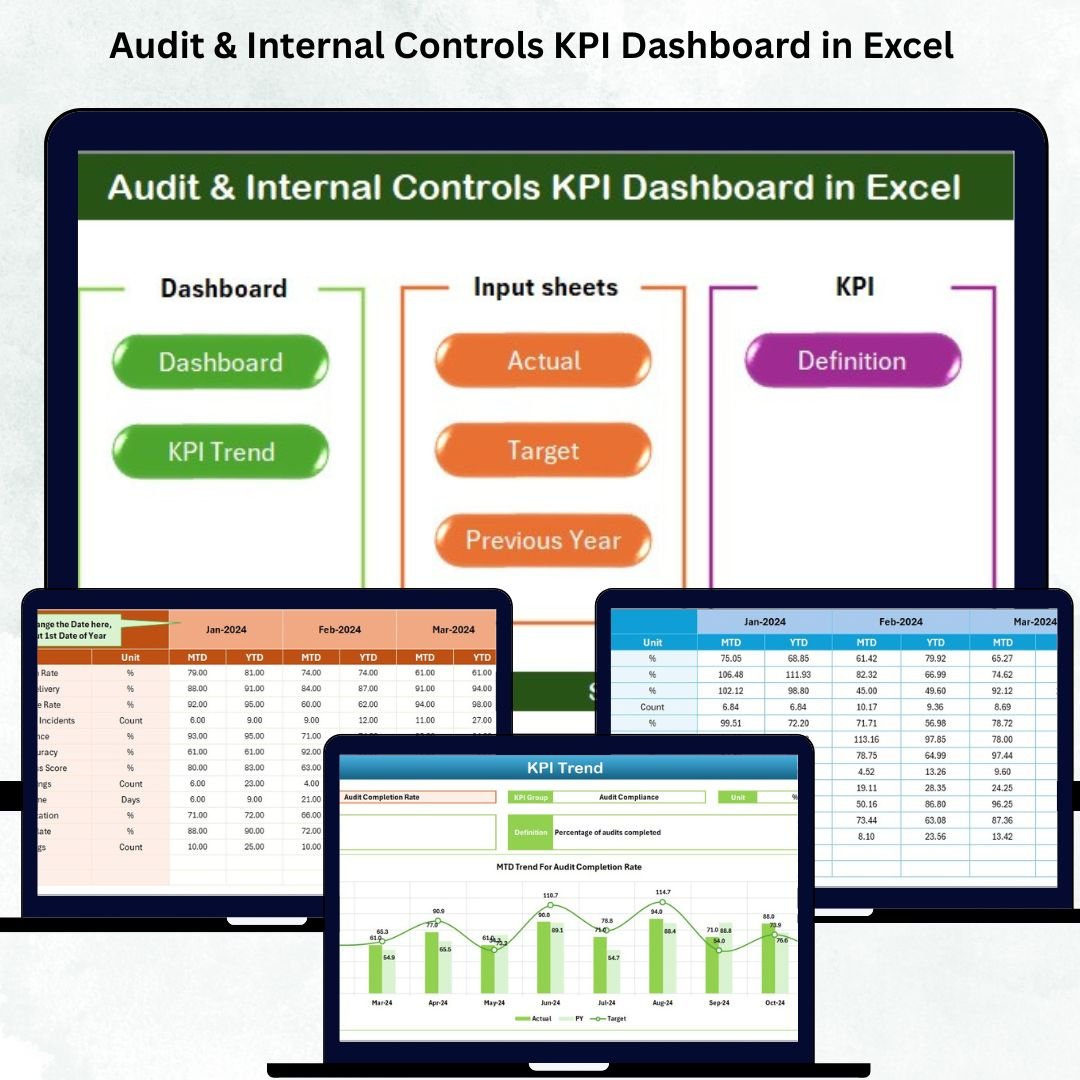
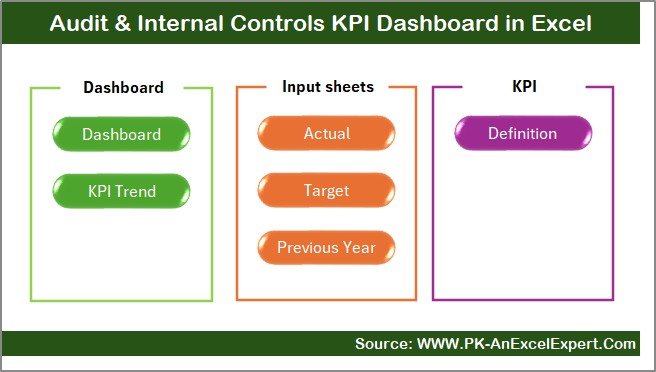
📁 7 Purpose-Built Worksheets
Includes Summary Page, Dashboard, Trend Sheet, Actuals Input, Targets Input, Previous Year Data, and KPI Definitions—each designed for easy navigation and clarity.
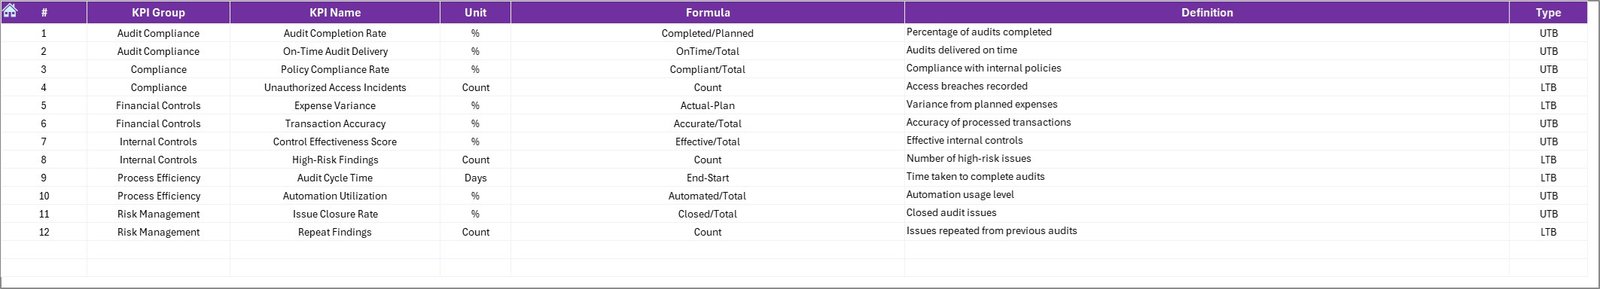
📌 KPI Definition Standardization
Add KPI names, units, formulas, and definitions to ensure every team member uses consistent and approved KPI logic.
📉 Target vs Actual & PY Comparison
Instantly identify performance strengths and weaknesses with built-in conditional formatting arrows (green ↑ for improvement, red ↓ for drop).
🔧 100% Editable and Customizable
Modify KPIs, formulas, or layouts based on your organization’s audit policy and reporting standards.
📦 What’s Inside the Audit & Internal Controls KPI Dashboard
When you download this product, you receive a complete performance tracking system designed for accuracy and ease of use. Here’s what’s included:
🗂️ Summary Navigator Page
This acts as the index of the workbook. Jump to any worksheet using buttons—no scrolling or searching required.
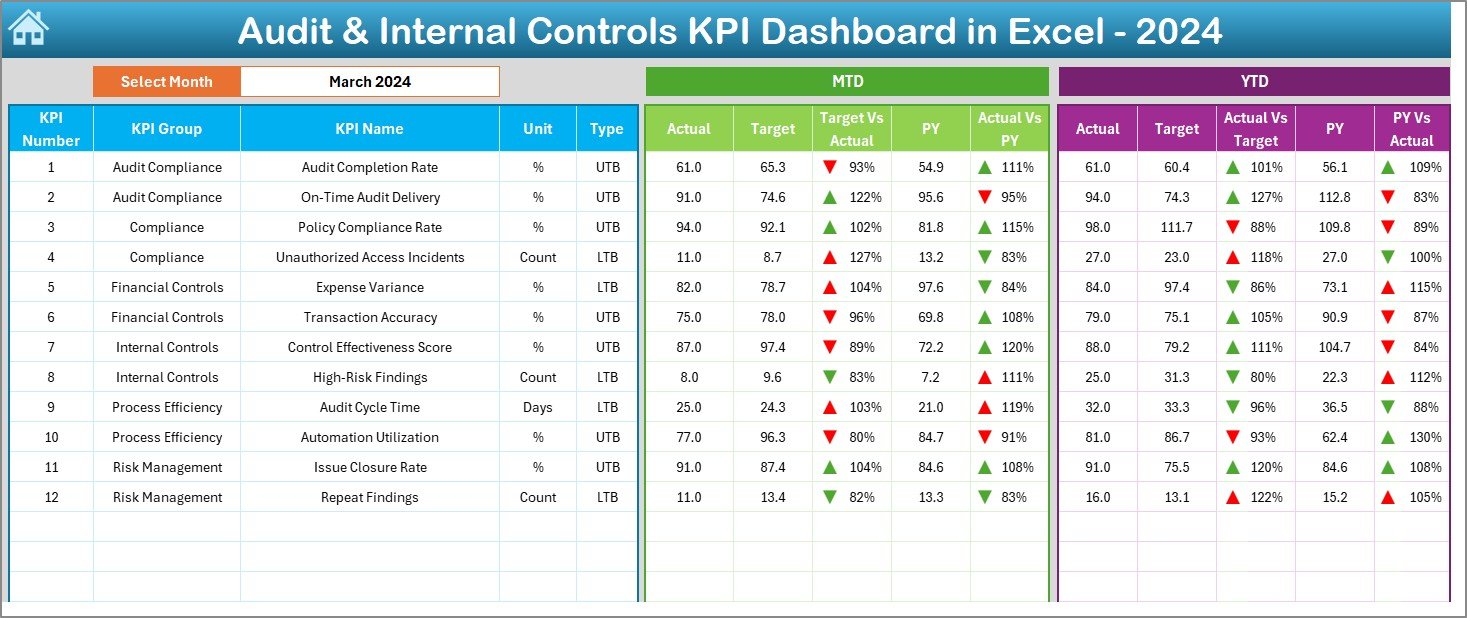
📊 Main Dashboard Page
Your central reporting hub displaying:
- MTD Actual vs Target vs PY
- YTD Actual vs Target vs PY
- Target Achievement %
- PY Comparison %
- KPI performance indicators
Everything refreshes automatically based on month selection.
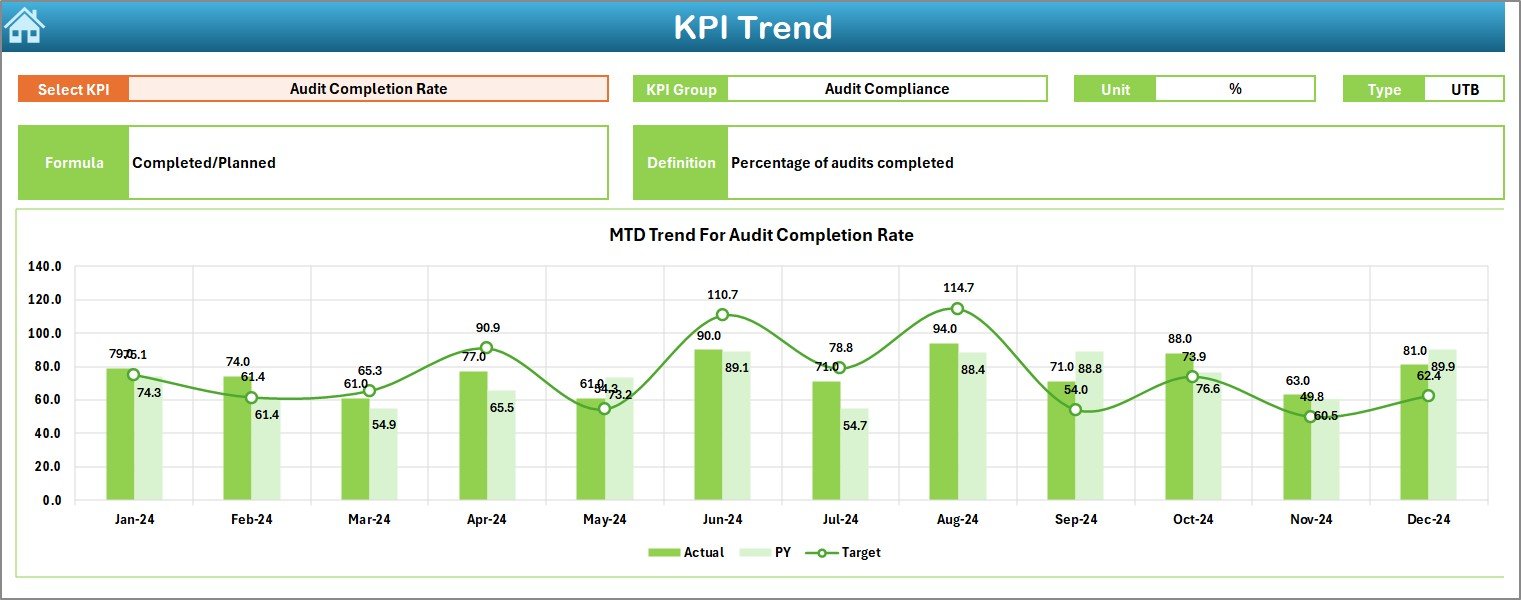
📉 Trend Analysis Sheet
Select any KPI from the drop-down to view:
- KPI Group
- Unit
- Formula
- Type (LTB/UTB)
- Detailed MTD & YTD performance charts
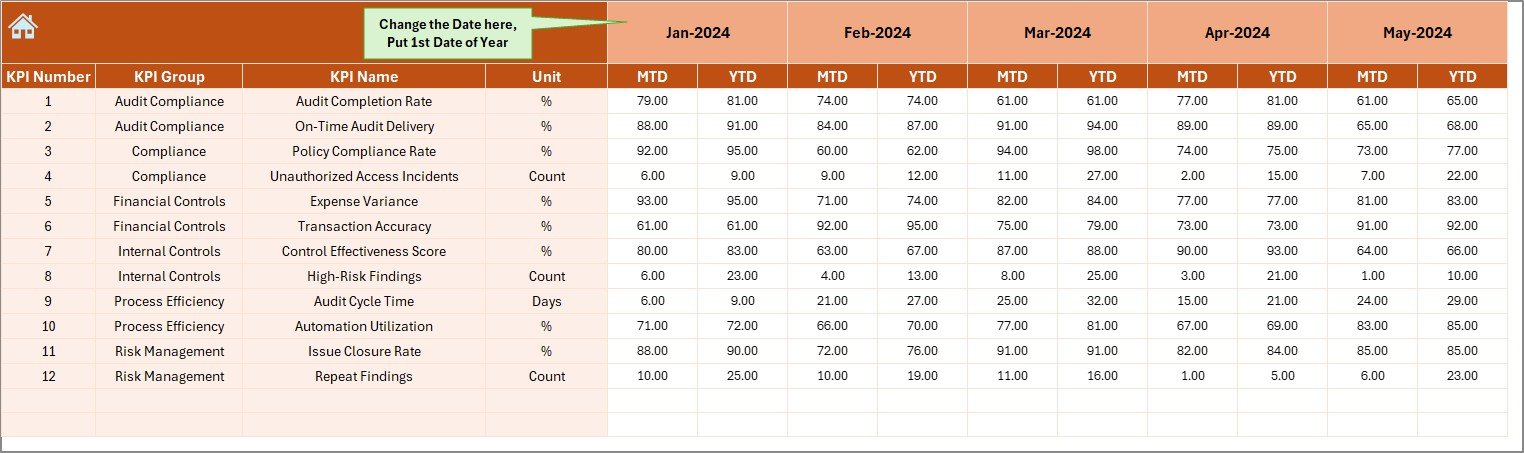
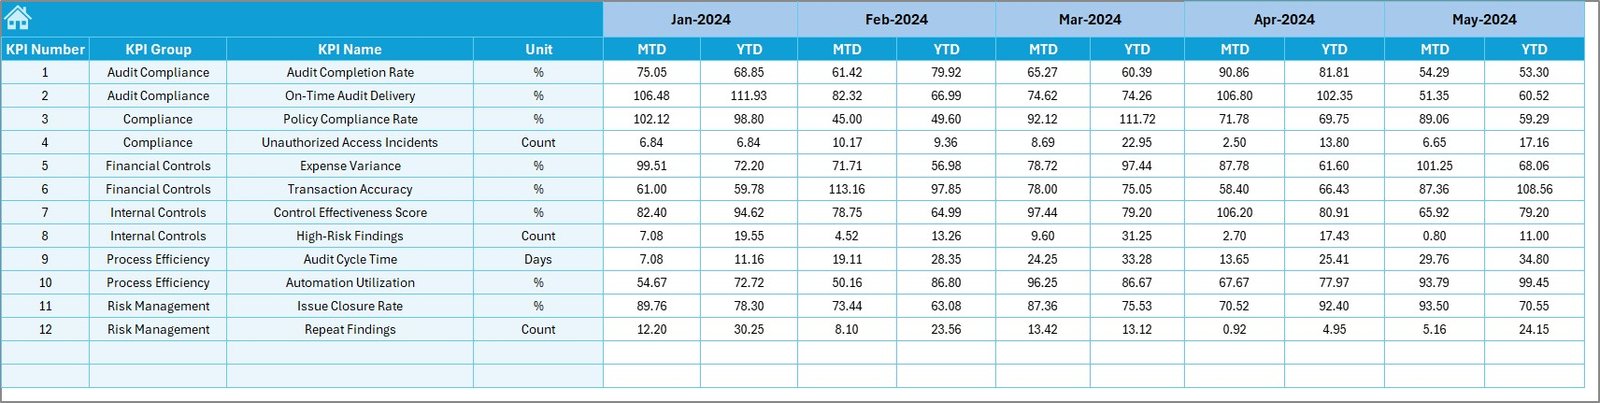
📝 Actuals Input Sheet
Update monthly data easily—no formulas required. The dashboard converts raw data into powerful insights instantly.
🎯 Target Input Sheet
Enter your monthly MTD and YTD targets. Perfect for performance planning and year-round audit control analysis.
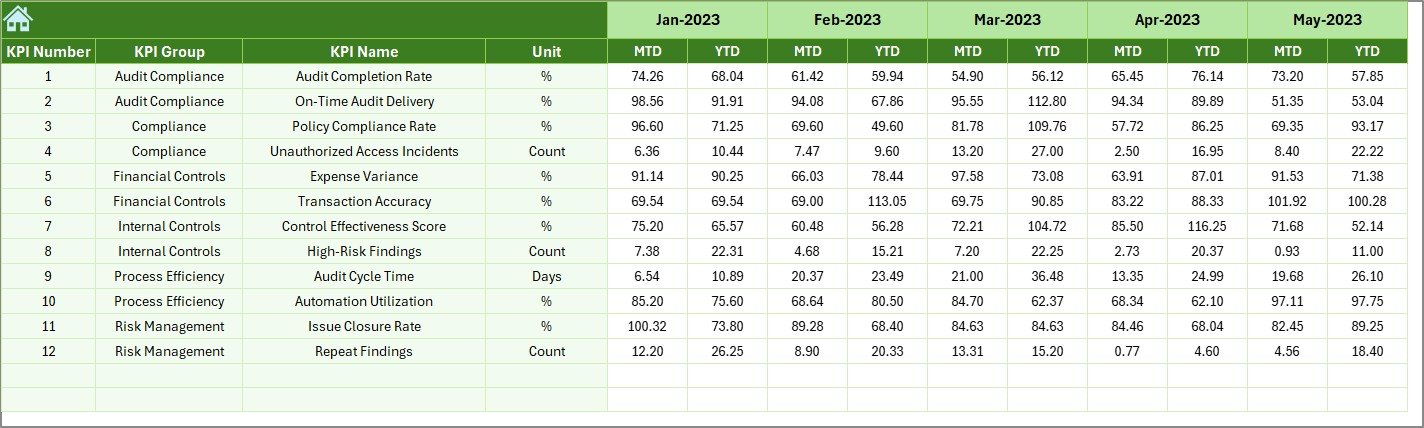
📘 Previous Year Data Sheet
Enter last year’s performance numbers to track improvement gaps and long-term audit efficiency.
📑 KPI Definition Sheet
Define KPIs clearly to avoid confusion and ensure standardization across departments.
🛠️ How to Use the Audit & Internal Controls KPI Dashboard
Using this dashboard is extremely simple, even for beginners:
🔹 Step 1: Update Actual Data
Enter your MTD and YTD numbers in the Actuals Input Sheet each month.
🔹 Step 2: Enter Your Targets
Add monthly targets in the Target Sheet to track performance against goals.
🔹 Step 3: Add Previous Year Values
This helps you identify improvements, declines, or stable trends.
🔹 Step 4: Review the Dashboard
Go to the main Dashboard page, select any month, and see performance results instantly.
🔹 Step 5: Analyze Trends
Use the Trend Sheet to understand KPI behavior, long-term patterns, and improvement needs.
No formulas to edit. No complicated procedures. Just plug in your data and your dashboard comes alive.
👥 Who Can Benefit from This Dashboard?
This dashboard is ideal for professionals and organizations that want to monitor audit performance proactively:
✔️ Internal Audit Teams
Track audit cycle time, issue resolution, compliance checks, and control testing efficiency.
✔️ Compliance & Risk Management Teams
Ensure policies, processes, and internal controls are followed consistently.
✔️ Finance & Corporate Governance Departments
Monitor governance quality, audit throughput, and performance alignment.
✔️ Audit Managers & Senior Executives
Get real-time visibility of performance trends, targets, and improvement areas.
✔️ Consulting Firms & Audit Service Providers
Use this dashboard to analyze client performance or present professional audit reports.
✔️ Any Organization Seeking Stronger Controls
Perfect for companies wanting to enhance transparency, accountability, and operational discipline.
Click here to read the Detailed blog post
Watch the step-by-step video tutorial:
Visit our YouTube channel to learn step-by-step video tutorials: YouTube.com/@PKAnExcelExpert


Reviews
There are no reviews yet.