


In today’s fast-paced creative world, arts and culture organizations thrive on data — from budgeting and event planning to measuring audience engagement. 🎭 Managing these aspects manually can be time-consuming and prone to errors. That’s where the Arts & Culture Dashboard in Excel steps in — your all-in-one solution to analyze, visualize, and manage cultural performance efficiently.
This ready-to-use Excel dashboard helps cultural institutions, museums, and event organizers turn raw data into actionable insights. Whether it’s analyzing ticket sales, event budgets, or visitor satisfaction, this dashboard gives you a clear picture of your organization’s performance — instantly and beautifully.
✨ Key Features of Arts & Culture Dashboard in Excel
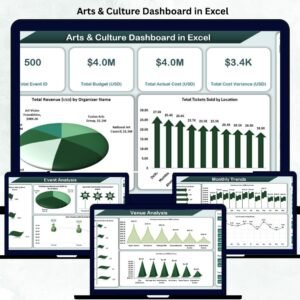
🎨 Interactive Overview Page: Get an instant snapshot of all your KPIs — including total events, total budget, actual cost, cost variance, and revenue by organizer.
💰 Budget vs. Actual Comparison: Monitor financial performance with automated calculations showing planned vs. actual costs for full transparency.
📊 Dynamic Event Insights: View sponsorships, ticket sales, and satisfaction scores by event status in easy-to-read visuals.
🏟️ Venue & Region Analytics: Understand which venues perform best and which regions attract the most visitors.
📅 Monthly Trends: Track artist participation, event costs, and tickets sold month by month — helping forecast and plan better.
🧠 User-Friendly Design: Built entirely in Excel with dropdowns, slicers, and automated charts — no coding required.
🔒 Secure & Editable: Lock key formulas while keeping data input areas open for flexibility and control.

📘 What’s Inside the Arts & Culture Dashboard in Excel
This Excel file comes with multiple smartly organized sheets, each serving a unique analytical purpose:
1️⃣ Overview Sheet Tab: Displays summary cards and charts for total events, budgets, costs, and revenues by organizer or event status.
2️⃣ Event Analysis Sheet: Deep dive into event-level performance — from sponsorships to audience satisfaction.
3️⃣ Venue Analysis Sheet: Compare venue performance by visitor engagement, sponsorships, and total revenue.
4️⃣ Region Analysis Sheet: Discover which regions yield the highest participation, revenue, and satisfaction.
5️⃣ Monthly Trends Sheet: View time-based insights such as monthly cost, artist count, and ticket trends.
Each tab is fully automated and visually formatted with vibrant, professional charts for quick interpretation.
🧩 How to Use the Arts & Culture Dashboard in Excel
🪄 Step 1: Enter your event and financial data into the input sheet or linked source.
🎚️ Step 2: Use the dropdown selectors (like month or event status) to filter your analysis dynamically.
📈 Step 3: Explore pre-built charts and KPI cards that refresh automatically with your data.
🎨 Step 4: Customize the design — change chart types, add your logo, or update color themes to match your brand.
📤 Step 5: Export or share reports easily via email or cloud platforms.
No coding, no complexity — just plug in your data and let Excel do the analysis for you!
👥 Who Can Benefit from This Arts & Culture Dashboard in Excel
🎭 Art Galleries & Museums: Track exhibitions, visitor numbers, and revenue.
🎤 Cultural Foundations & NGOs: Evaluate project success, sponsorship impact, and participation levels.
🎪 Festival & Event Organizers: Manage event performance, satisfaction, and ticketing in one place.
🏛️ Government & Municipal Departments: Monitor community events and cultural programs efficiently.
📚 Educational Institutions: Use it to analyze student art programs or cultural event participation.
This dashboard helps every arts organization — big or small — bring data clarity, accountability, and visual appeal to their decision-making process.
Click here to read the Detailed Blog Post
Watch the step-by-step video tutorial:


Reviews
There are no reviews yet.