


Artificial Intelligence (AI) is redefining how organizations innovate, optimize, and grow 🚀. From automating workflows to predicting outcomes, AI has become the backbone of efficiency and performance across industries. Artificial Intelligence (AI) KPI Dashboard in Power BI But tracking the success and ROI of AI initiatives can be complex — until now.
Introducing the Artificial Intelligence (AI) KPI Dashboard in Power BI — a powerful, ready-to-use analytics solution designed to monitor, visualize, and analyze your AI project performance in one place.
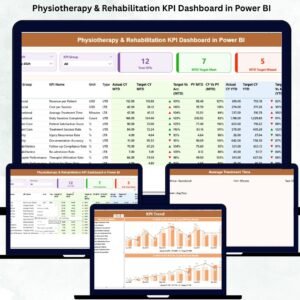
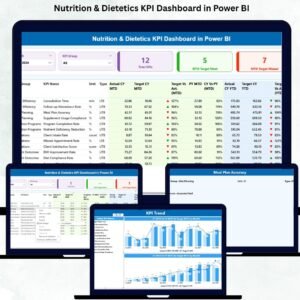
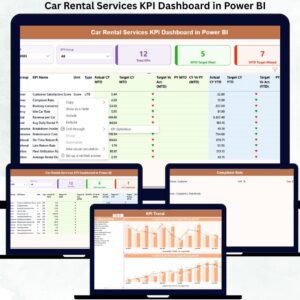
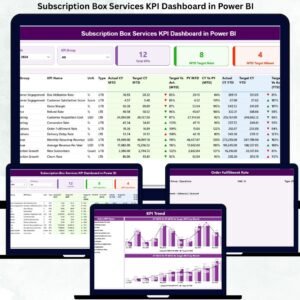
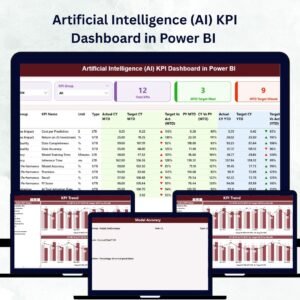
Artificial Intelligence (AI) KPI Dashboard in Power BI This interactive dashboard connects Power BI with Excel-based data, giving businesses real-time insights into metrics like accuracy, speed, cost savings, and model performance. Whether you’re managing AI deployment, measuring algorithm improvements, or evaluating ROI, this dashboard ensures your decisions are always backed by data 📊.
⚙️ Key Features of Artificial Intelligence (AI) KPI Dashboard in Power BI
🧠 Three Insightful Pages – Summary, KPI Trend, and KPI Definition pages for comprehensive AI performance tracking.
📈 Dynamic Data Connection – Seamlessly integrates with Excel (Input Actual, Input Target & KPI Definition sheets).
🎯 Interactive Filters & Slicers – Instantly filter data by Month or KPI Group for focused insights.
📊 Actual vs Target vs PY – Compare Month-to-Date (MTD) and Year-to-Date (YTD) performance with historical benchmarks.
📍 Visual Indicators – Arrows (▲▼) and color-coded formatting make it easy to identify improvement or decline.
🔍 Drill-Through Capability – Click any KPI for detailed information, formulas, and definitions.
💼 Automated Performance Cards – View total KPI count, targets met and missed targets instantly.
⚡ Scalable & Customizable – Add KPIs, modify visuals, or connect to live databases effortlessly.
📦 What’s Inside the Dashboard

1️⃣ Summary Page – Executive Overview
-
A visual command center that shows AI performance at a glance.
-
Use slicers for Month and KPI Group to tailor your analysis.
-
View Total KPI Count, Target Met Count, and Target Missed Count.
-
Explore performance tables showing Actual vs Target and PY vs Actual for both MTD and YTD metrics.
2️⃣ KPI Trend Page – Performance Visualization
-
Choose any KPI to view trends over time.
-
Includes dual charts for MTD and YTD comparisons.
-
Highlights progress, efficiency changes, and long-term growth trends.
3️⃣ KPI Definition Page – The KPI Reference Guide
-
View complete details for each metric: KPI Number, Group, Formula, Unit, and Type (UTB/LTB).
-
Accessed directly via drill-through from the Summary Page for seamless navigation.
💾 Excel Data Structure:
-
Input Actual Sheet: Enter monthly performance values (MTD/YTD).
-
Input Target Sheet: Define monthly goals and targets.
-
KPI Definition Sheet: Document KPIs, formulas, and measurement standards.
🧭 How to Use the Dashboard
1️⃣ Connect Your Excel Data: Link Actual, Target, and Definition sheets.
2️⃣ Refresh in Power BI: Update your visuals with a single click.
3️⃣ Apply Filters: Narrow your focus using slicers (Month, KPI Group).
4️⃣ Explore Trends: Identify gaps and opportunities via the KPI Trend page.
5️⃣ Drill-Through Details: Access metric formulas and definitions instantly.
This streamlined process helps you transform complex AI data into real-time, actionable business intelligence.
👥 Who Can Benefit from This Dashboard
🤖 AI Project Managers: Monitor project success, deployment efficiency, and ROI.
📊 Data Scientists: Track model accuracy, recall, precision, and false positives.
💼 Executives: View top-level KPIs that highlight the business value of AI.
💻 Developers: Evaluate processing speed, automation success, and performance stability.
🏢 Consultants: Present data-driven insights to clients in a professional format.
This dashboard is perfect for organizations in finance, healthcare, manufacturing, retail, or technology that want to track AI progress with precision.
🔗 Click here to read the Detailed Blog Post
🎥 Visit our YouTube channel to learn step-by-step video tutorials
Watch the step-by-step video tutorial:


Reviews
There are no reviews yet.