The antique market is competitive, unpredictable, and full of opportunity. Collectors expect authenticity. Auction houses demand transparency. Estate buyers negotiate hard. Therefore, antique dealers must track performance carefully and consistently.
If you still manage your business using scattered spreadsheets, you are missing valuable insights. Antique Dealers KPI Dashboard in Excel You cannot clearly see monthly sales trends, inventory turnover, profit margins, auction results, or seasonal demand patterns in one place.
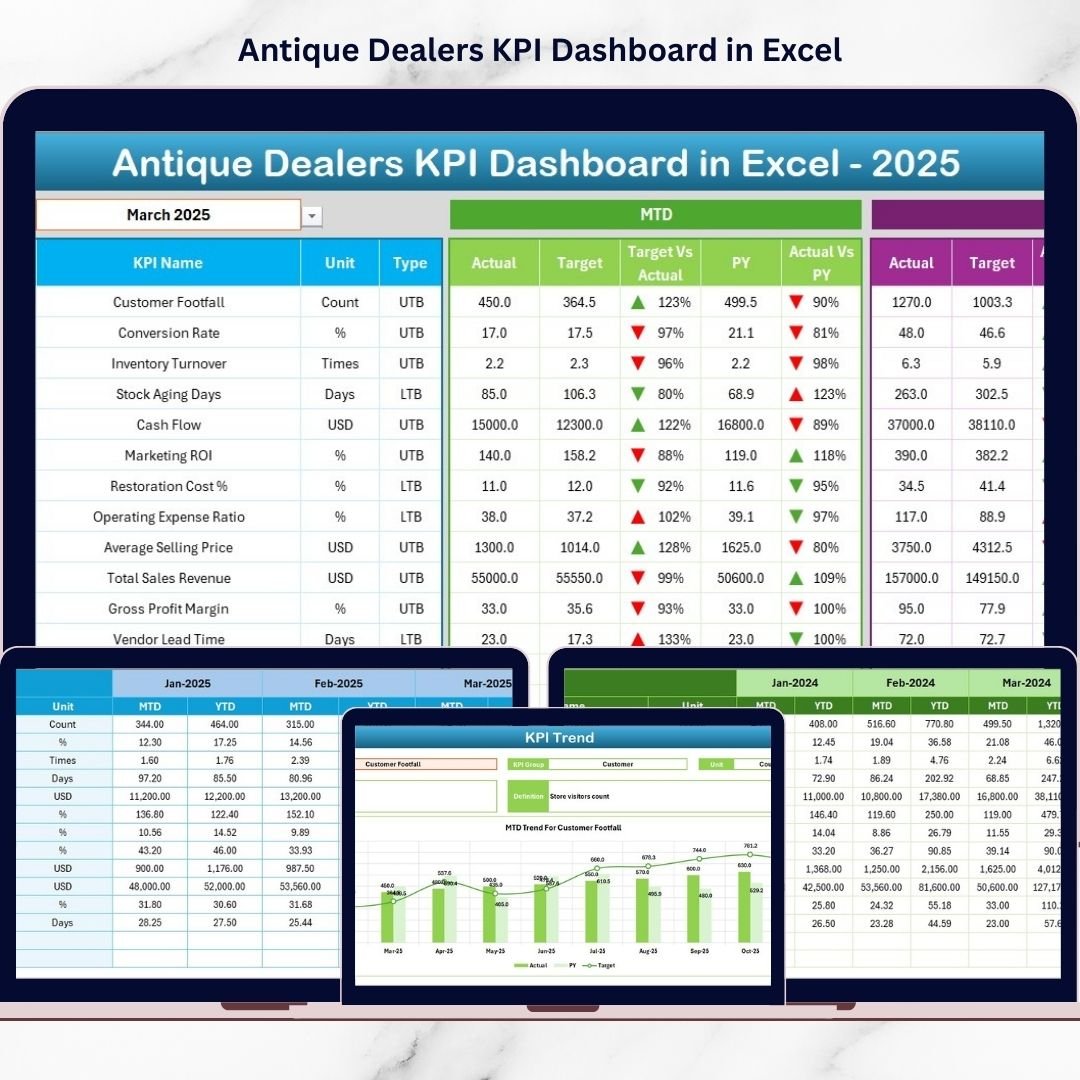
That is why you need the Antique Dealers KPI Dashboard in Excel — a ready-to-use, professionally designed performance tracking system built specifically for antique dealers, estate sale professionals, auction resellers, and vintage store owners.
Antique Dealers KPI Dashboard in Excel This powerful Excel dashboard organizes your financial, inventory, and operational KPIs into one structured and automated workbook. Instead of switching between multiple files, you get a centralized performance view that updates instantly when you select a month.
It is simple. It is structured. And it is built to increase profitability.
🚀 Key Feature of Antique Dealers KPI Dashboard in Excel
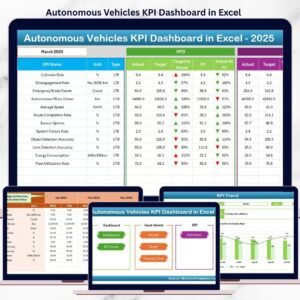
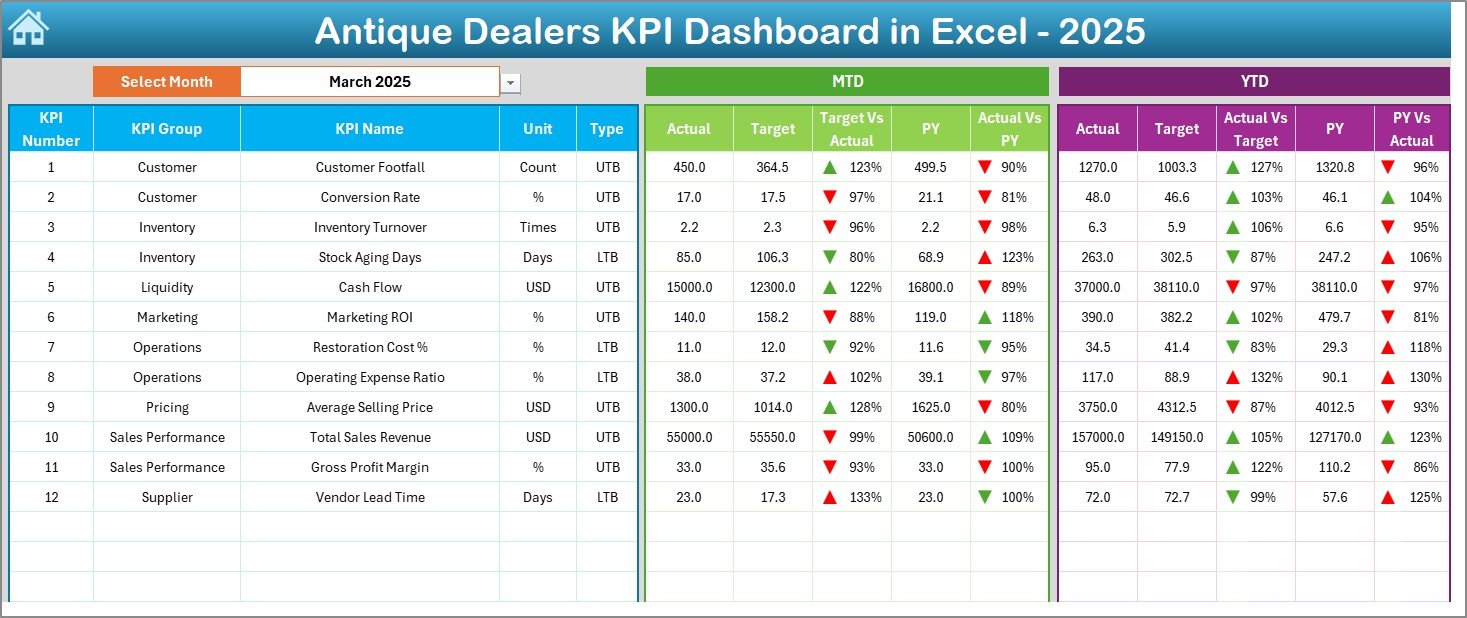
📊 Interactive Monthly Selection
Choose any month from Cell D3 and the entire dashboard updates automatically.
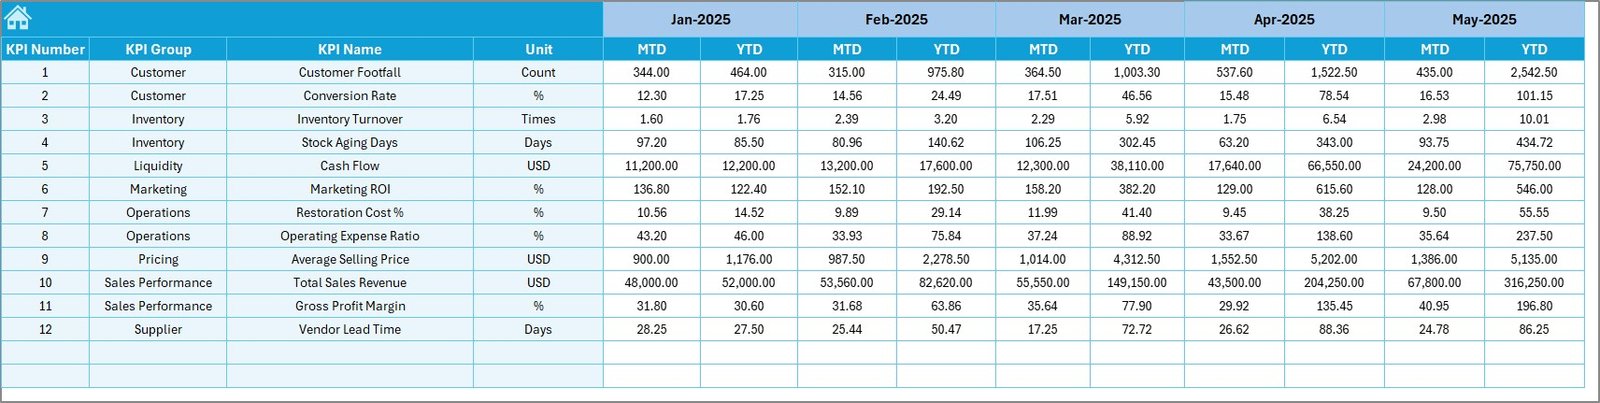
📈 MTD & YTD Performance Tracking
Monitor Month-To-Date and Year-To-Date Actual, Target, and Previous Year results in one view.
🎯 Target vs Actual Comparison
Instantly identify performance gaps using automated percentage calculations.
🔁 Year-over-Year Analysis
Compare current year results with previous year performance clearly.
📉 Visual Performance Indicators
Green ▲ and Red ▼ icons highlight KPI status immediately.
📋 7 Structured Worksheets
Organized sheets for data input, targets, trends, definitions, and reporting.
🧮 Automated Calculations
Built-in formulas eliminate manual reporting errors and save time.
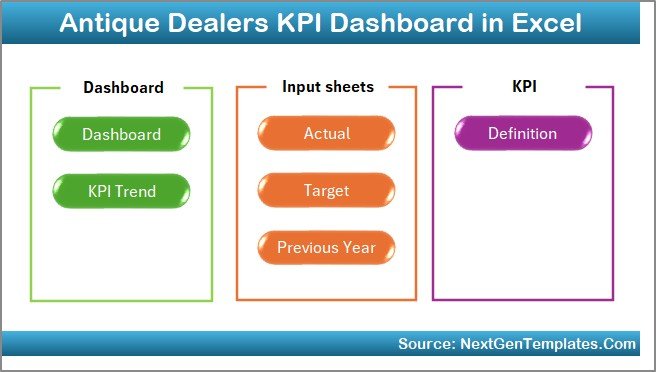
📦 What’s Inside the Antique Dealers KPI Dashboard in Excel
This ready-to-use Excel template includes 7 powerful worksheets:
✔️ Home Sheet – Clean navigation hub with 6 quick-access buttons.
✔️ Dashboard Sheet – Central KPI performance overview with visual comparisons.
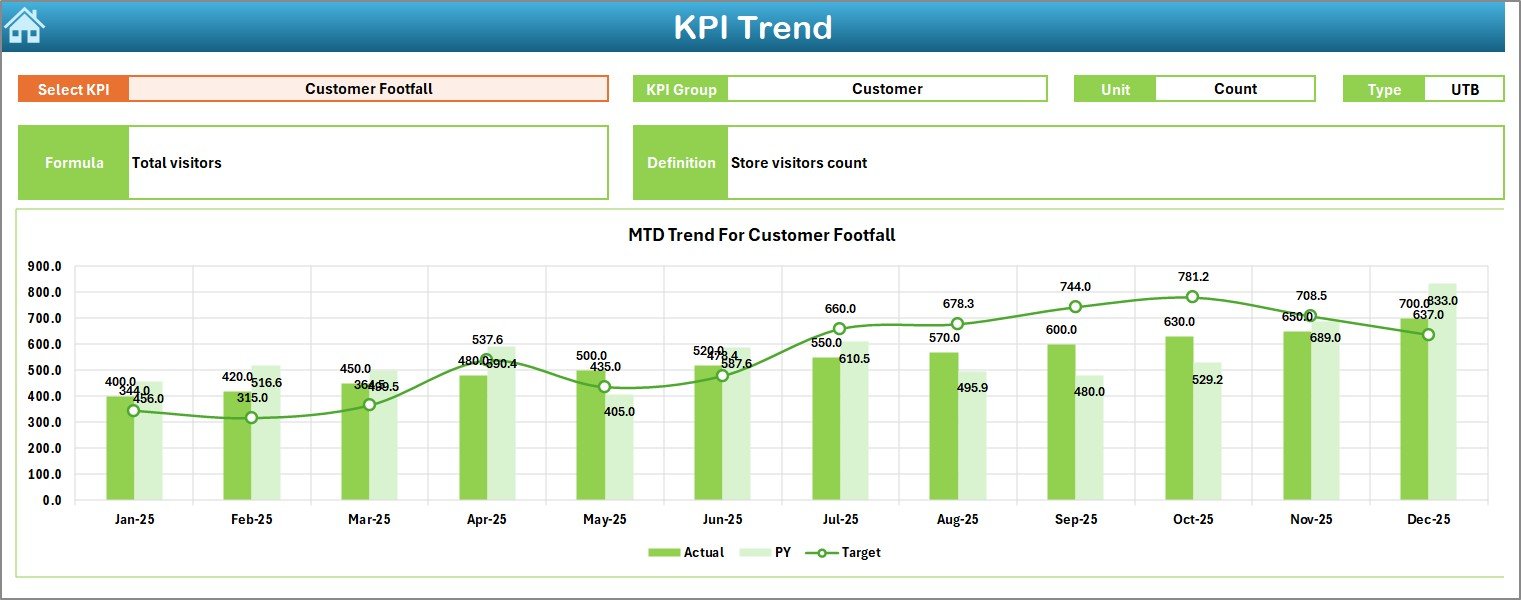
✔️ KPI Trend Sheet – Detailed trend charts and KPI breakdown.
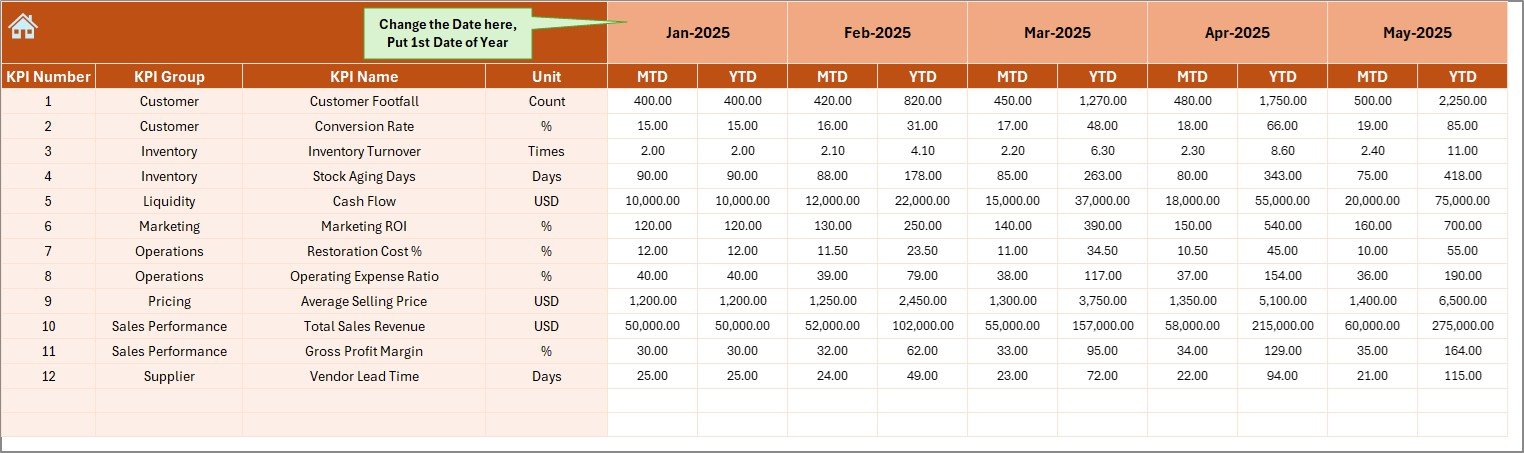
✔️ Actual Numbers Sheet – Enter monthly MTD and YTD actual data easily.
✔️ Target Sheet – Define measurable monthly and yearly business goals.
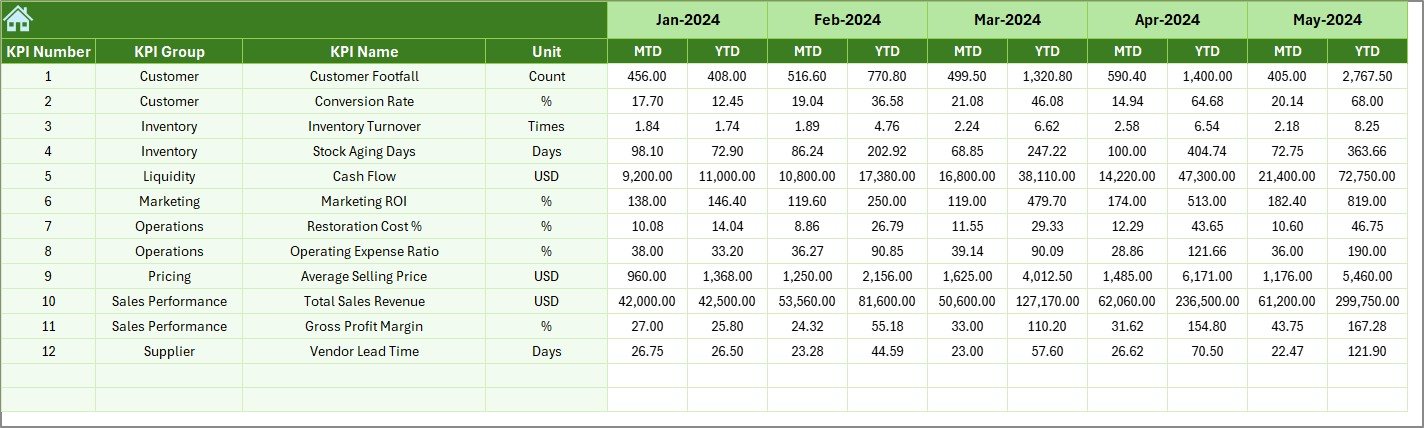
✔️ Previous Year Sheet – Store last year’s numbers for YoY comparison.
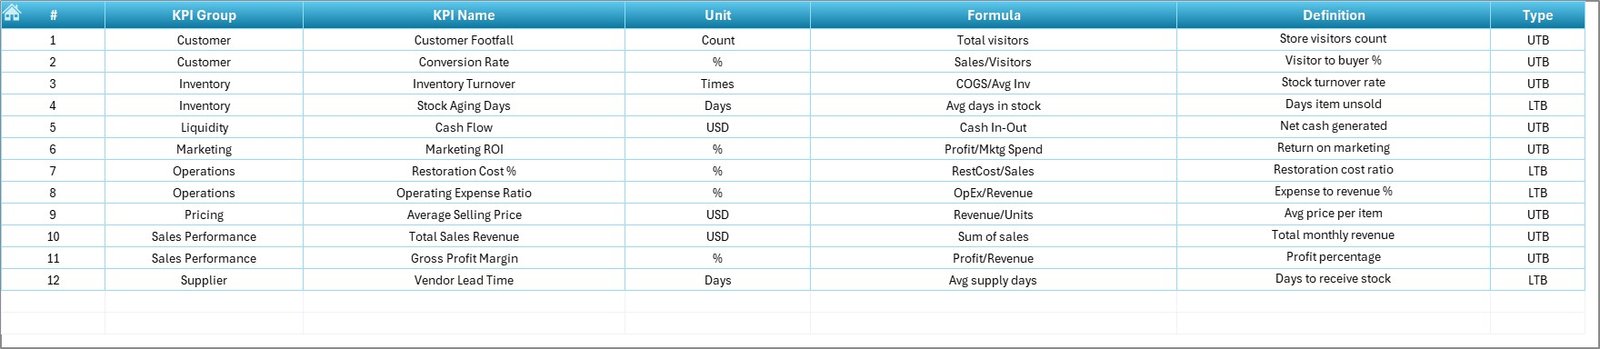
✔️ KPI Definition Sheet – Maintain KPI name, formula, type (LTB/UTB), and unit structure.
Everything is professionally formatted and logically structured. You simply enter your numbers — the dashboard handles the calculations.
🛠️ How to Use the Antique Dealers KPI Dashboard in Excel
Using this dashboard is straightforward:
1️⃣ Enter your first month in the Actual Sheet (Cell E1).
2️⃣ Input monthly MTD and YTD actual figures.
3️⃣ Set targets in the Target Sheet.
4️⃣ Enter historical data in the Previous Year Sheet.
5️⃣ Select the month from the Dashboard drop-down.
The dashboard instantly updates:
✔ Target vs Actual percentages
✔ Current Year vs Previous Year comparisons
✔ KPI status indicators
✔ Trend charts
You do not need advanced Excel skills. Basic data entry knowledge is enough.
🏛️ Who Can Benefit from This Antique Dealers KPI Dashboard in Excel
This dashboard is ideal for:
🏺 Antique Dealers
🏷️ Auction Houses
🛍️ Vintage Store Owners
📦 Estate Sale Managers
💎 Collectible Traders
🏬 Multi-Location Antique Businesses
If you want professional reporting, structured inventory tracking, and stronger financial control, this dashboard is built for you.
Instead of relying on guesswork, you can now:
✔ Track inventory turnover
✔ Monitor gross and net profit margins
✔ Analyze auction success rates
✔ Evaluate repeat customer trends
✔ Identify slow-moving stock
✔ Improve cash flow planning
This is not just an Excel template.
It is your business performance command center.
⭐ Why This Dashboard Will Increase Your Profitability
• Centralized KPI monitoring
• Clear monthly and yearly comparisons
• Structured inventory tracking
• Professional reporting layout
• Easy customization for your niche
• Better financial planning decisions
The antique business demands strategy and discipline.
This dashboard gives you both.
If you want to optimize pricing, reduce dead stock, improve margins, and make smarter purchasing decisions, this Antique Dealers KPI Dashboard in Excel will transform how you manage your business.
Stop guessing.
Start analyzing.
Start growing. 🏺📊