
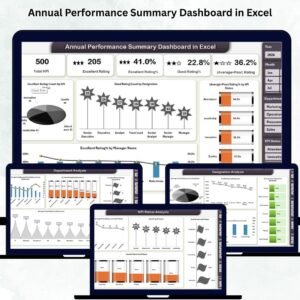
a complete, ready-to-use reporting solution designed to transform the way HR teams and managers evaluate performance across the year. Whether you want to review KPIs, analyze ratings, compare departments, or track monthly patterns, this dashboard gives you everything in one clean, interactive, and easy-to-use Excel file.Annual Performance Summary Dashboard in Excel
Performance reviews often become time-consuming because data lives in multiple sheets or manual files. This dashboard solves that struggle instantly. It brings every important detail into one powerful visual dashboard, allowing managers to understand performance trends in seconds instead of hours. If you’re looking for a simple, reliable, and professional way to monitor yearly performance, this dashboard is the perfect tool for you.
⭐ Key Features of Annual Performance Summary Dashboard in Excel
This dashboard is carefully designed to give you complete visibility of your team’s annual performance. Here’s what makes it a must-have:
✨ Fully Automated Performance Summary
View all KPIs, ratings, and results instantly with auto-updating visuals and charts.
📊 Interactive KPI Cards
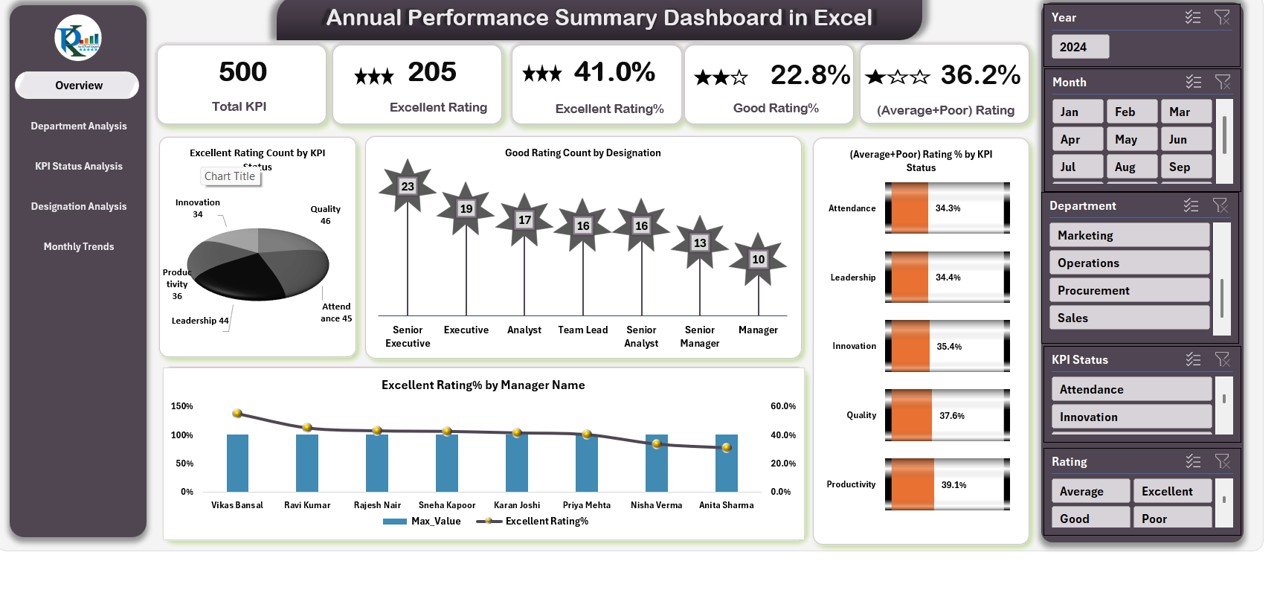
Quickly see total KPIs, Excellent % rating, Good % rating, and (Average + Poor) rating percentages.
📈 Insightful Charts & Trends
Analyze performance through charts like Excellent Rating Count by KPI Status, Good Rating Count by Designation, Manager-wise performance, and more.
🏢 Department-Level Comparison
Identify high and low-performing departments based on rating distribution.
👔 Designation Analysis
Understand how performance varies across job roles and levels.
🗓️ Monthly Trends Tracking
Monitor month-by-month performance movement and detect improvement opportunities.
🛠️ Easy to Edit, Customize & Expand
Adjust KPIs, rating categories, data sources, and chart visuals based on your company’s structure.
⭐ What’s Inside the Annual Performance Summary Dashboard in Excel
This product includes a structured and professionally designed Excel dashboard with 5 powerful pages:
📍 1. Overview Page
Get the complete yearly performance summary using dynamic KPI cards and key charts.
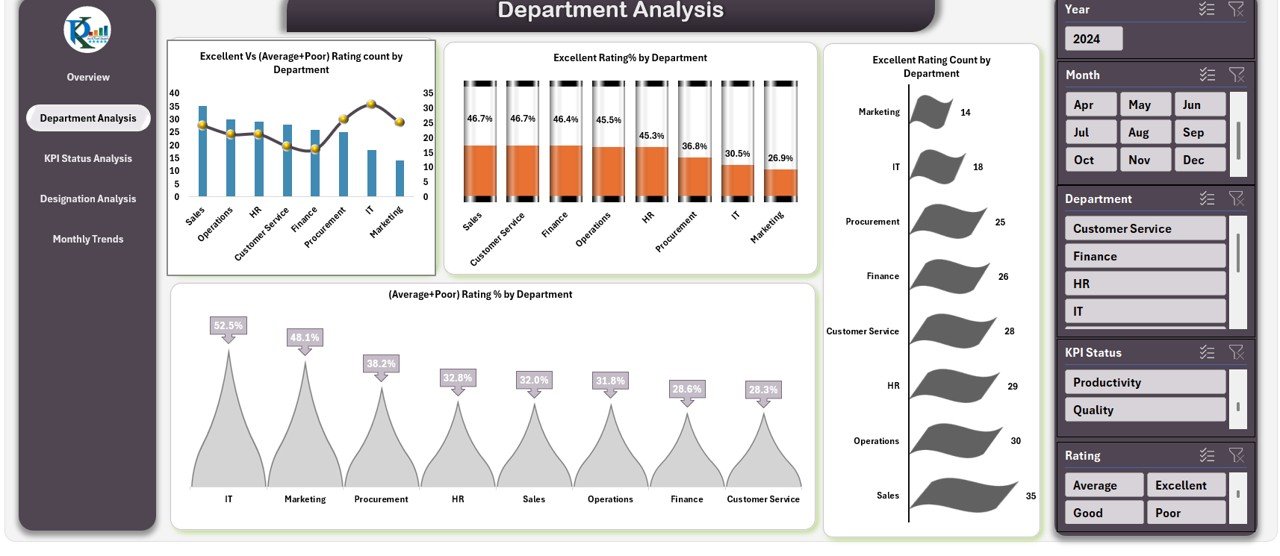
📍 2. Department Analysis
Compare departments using Excellent vs (Average + Poor) ratings, department-wise percentages, and rating counts.
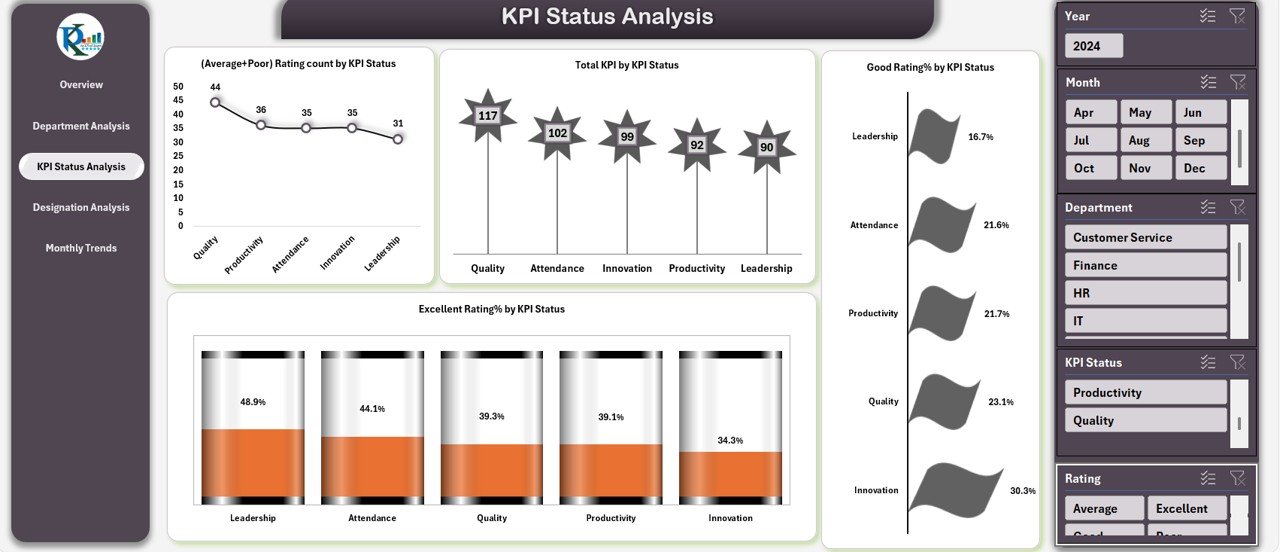
📍 3. KPI Status Analysis
Identify KPI categories that perform well and those that need improvement.
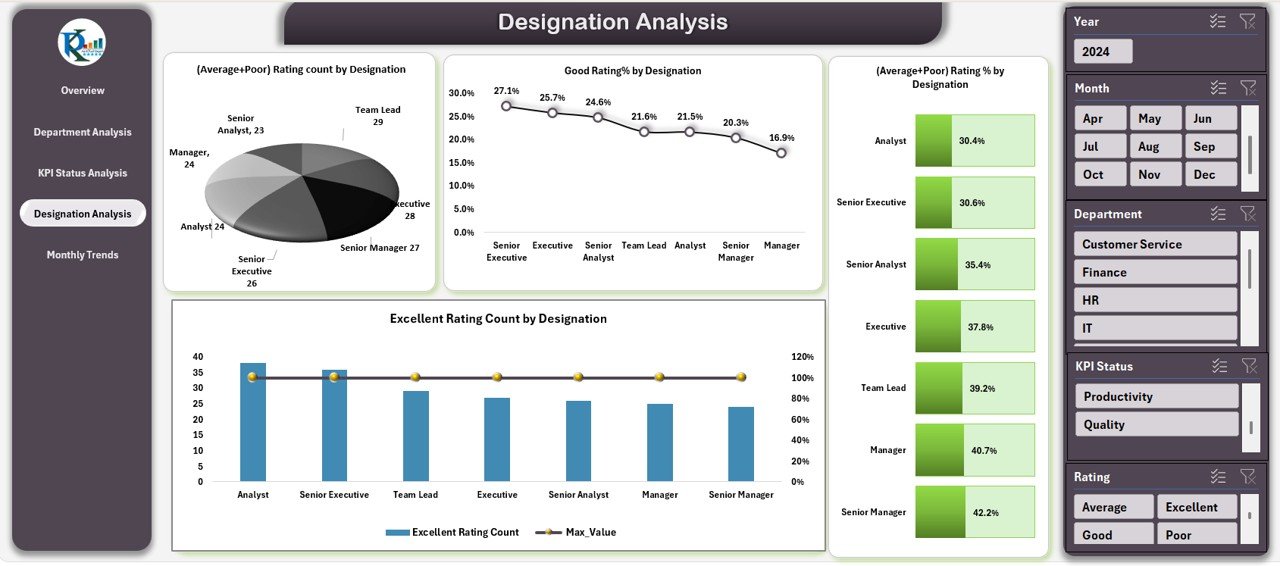
📍 4. Designation Analysis
Measure performance across job roles to find strengths and gaps.
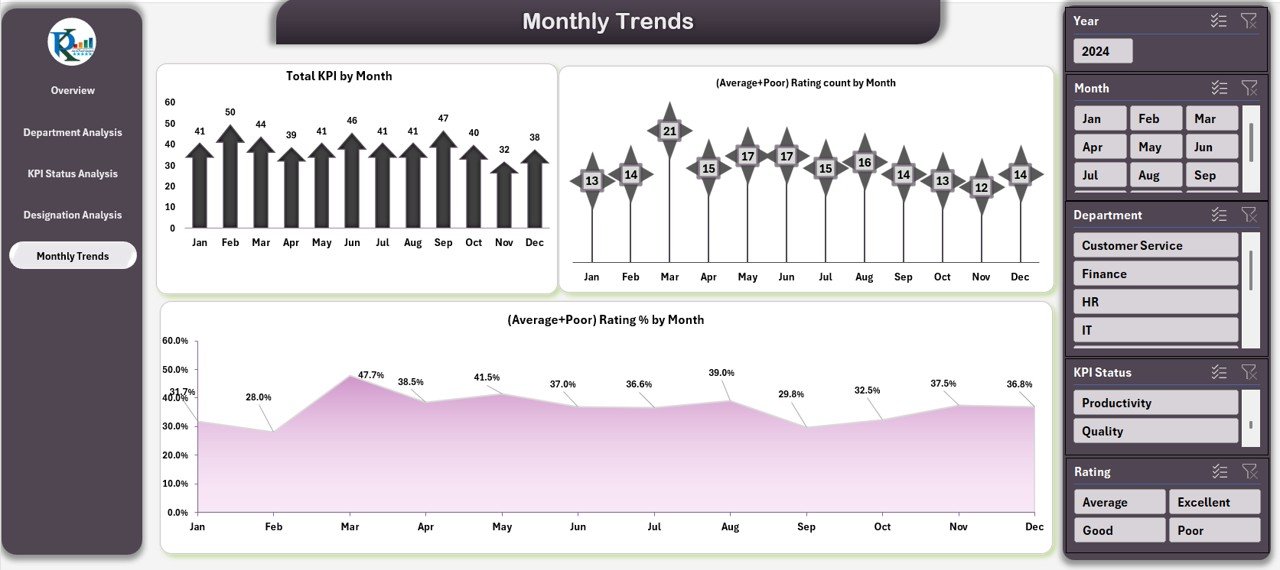
📍 5. Monthly Trends
Spot seasonal patterns and track consistent improvement or decline throughout the year.
Every sheet is neatly structured, visually appealing, and easy for any HR team to use instantly.
⭐ How to Use the Annual Performance Summary Dashboard in Excel
Using this dashboard is extremely simple — even if you are not an Excel expert.
🟢 Step 1: Update the Data Sheet
Enter KPIs, ratings, departments, designations, months, and manager names into the input data.
🔄 Step 2: Refresh the Pivot Tables
Click “Refresh All” so charts and cards auto-update instantly.
📊 Step 3: Explore Each Page
Navigate through Overview, Department Analysis, KPI Status, Designation, and Monthly trends using the page navigator.
⚙️ Step 4: Customize KPIs or Rating Categories (Optional)
Edit KPI names, rating types, or structures based on your company’s need.
📥 Step 5: Export Charts or Screenshots
Use charts for presentations, reviews, appraisal discussions, and management meetings.
⭐ Who Can Benefit from This Annual Performance Summary Dashboard in Excel
This dashboard is designed for all types of organizations and professionals:
👩💼 HR Managers
Easily conduct annual evaluations and performance analysis.
👨💻 Department Heads
Track team performance and identify improvement areas.
📊 Performance Analysts
Get data-driven insights for KPI refinement and planning.
🏢 Senior Leadership Teams
Access high-level performance patterns instantly.
🧑💼 Business Owners
Understand how employees contribute across the year.
No matter your industry — IT, retail, finance, manufacturing, education, or consulting — this dashboard works perfectly for all performance structures.
⭐ Click here to read the Detailed blog post
Watch the step-by-step video tutorial:


Reviews
There are no reviews yet.