Airport operations generate massive volumes of data every single day. Flights arrive and depart continuously, multiple airlines operate simultaneously, baggage handling issues occur, and delays impact passenger experience and operational efficiency. However, when this data stays scattered across spreadsheets, logs, or static reports, airport teams struggle to identify patterns and act quickly.
That is exactly where the Airports Dashboard in Excel becomes a powerful and practical solution ✈️📊.
This ready-to-use Excel dashboard transforms complex airport operational data into clear, visual, and interactive insights. Instead of manually analyzing flight logs or delay reports, airport managers and aviation teams can instantly monitor performance across airlines, regions, airport codes, and months using dynamic charts and slicers.
Because the dashboard is built entirely in Excel, it remains easy to use, flexible, and cost-effective, while still delivering professional, decision-ready insights. From monitoring baggage issues to identifying delay patterns and traffic peaks, this dashboard helps airport teams move from reactive reporting to data-driven operational control.
## Key Features of Airports Dashboard in Excel 🚀
This dashboard is designed specifically for airport and aviation performance analysis.
✈️ Centralized Airport Performance Monitoring
Track flights, airlines, regions, baggage issues, and delays in one place.
📊 Interactive Pivot-Based Charts
All visuals are built using pivot tables and pivot charts for flexibility.
🎛️ Dynamic Slicers for Quick Filtering
Filter data instantly by airline, region, airport code, or month.
📅 Monthly Traffic & Delay Trends
Identify seasonal peaks and operational stress periods.
🧳 Baggage Issue Tracking
Monitor baggage problems by airline, region, and airport code.
🧭 Page Navigator for Easy Navigation
Move between dashboard pages with a single click.
🛠️ Fully Customizable Excel Template
Add KPIs, modify charts, or extend analysis easily.
💻 Offline & Excel-Native Solution
No cloud dependency or advanced tools required.
## What’s Inside the Airports Dashboard in Excel 📂
This dashboard includes 5 structured analytical pages, supported by a Data Sheet and Support Sheet.
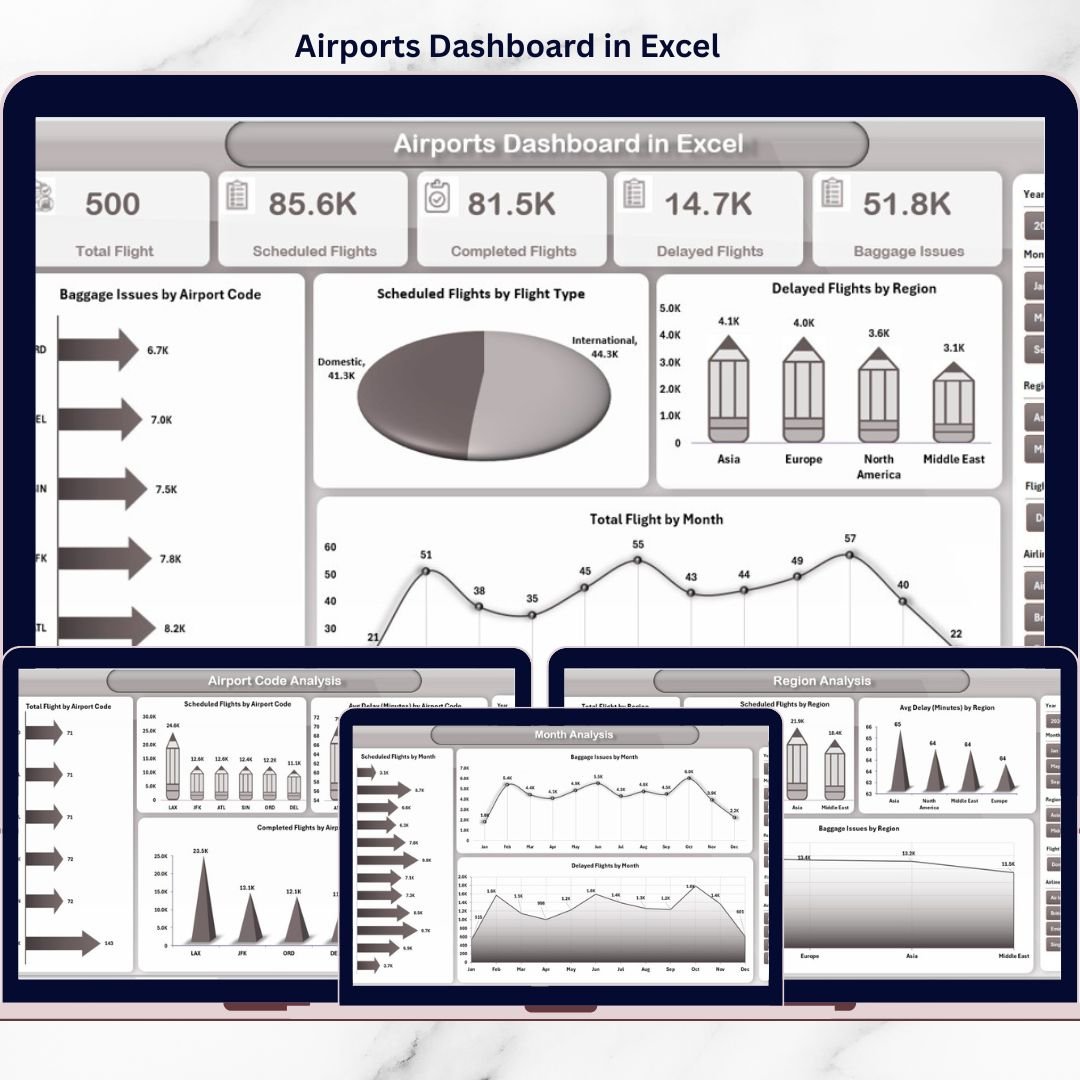
🟦 Overview Page
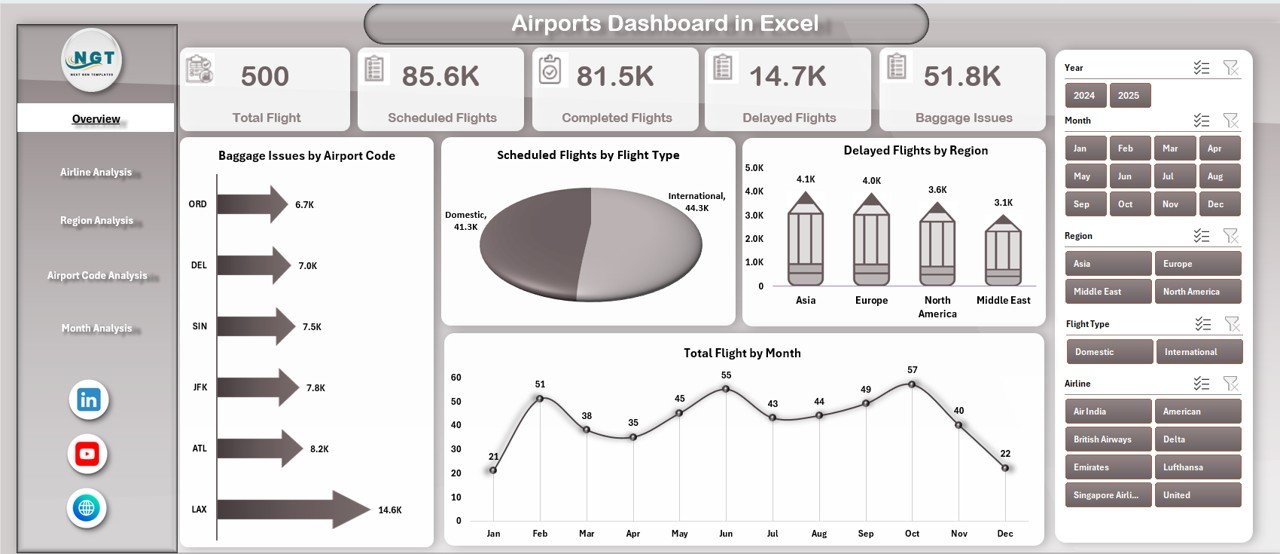
Acts as the command center with KPI cards and high-level charts showing baggage issues, scheduled flights, delayed flights by region, and total flights by month.
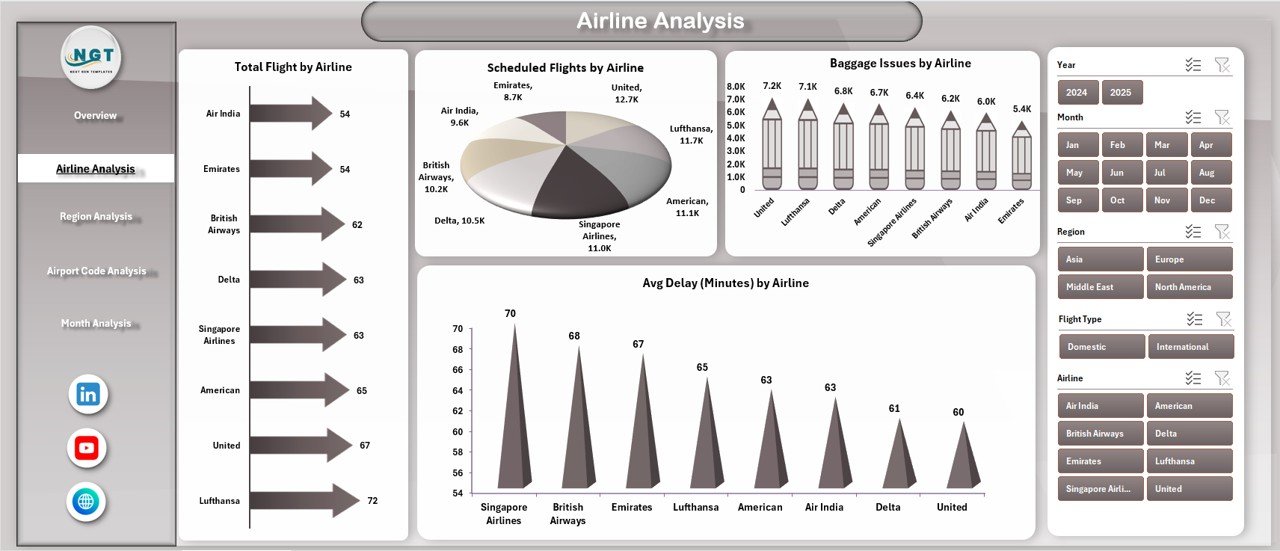
🟦 Airline Analysis Page
Analyzes airline-wise performance using charts such as total flights, scheduled flights, baggage issues, and average delay by airline.
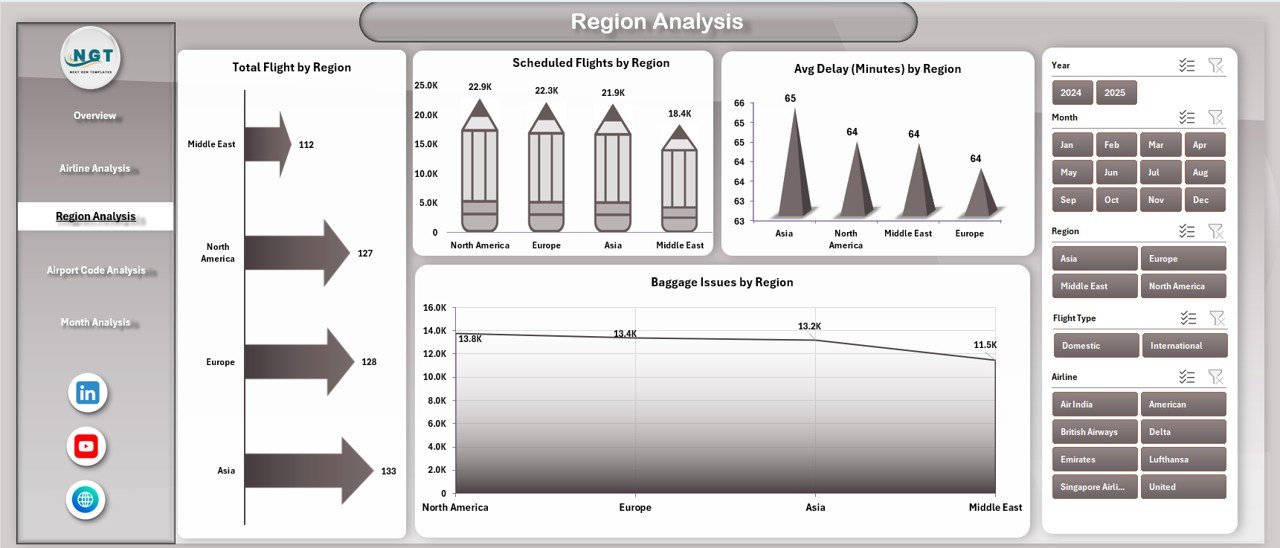
🟦 Region Analysis Page
Provides region-level insights including total flights, scheduled flights, baggage issues, and average delay by region.
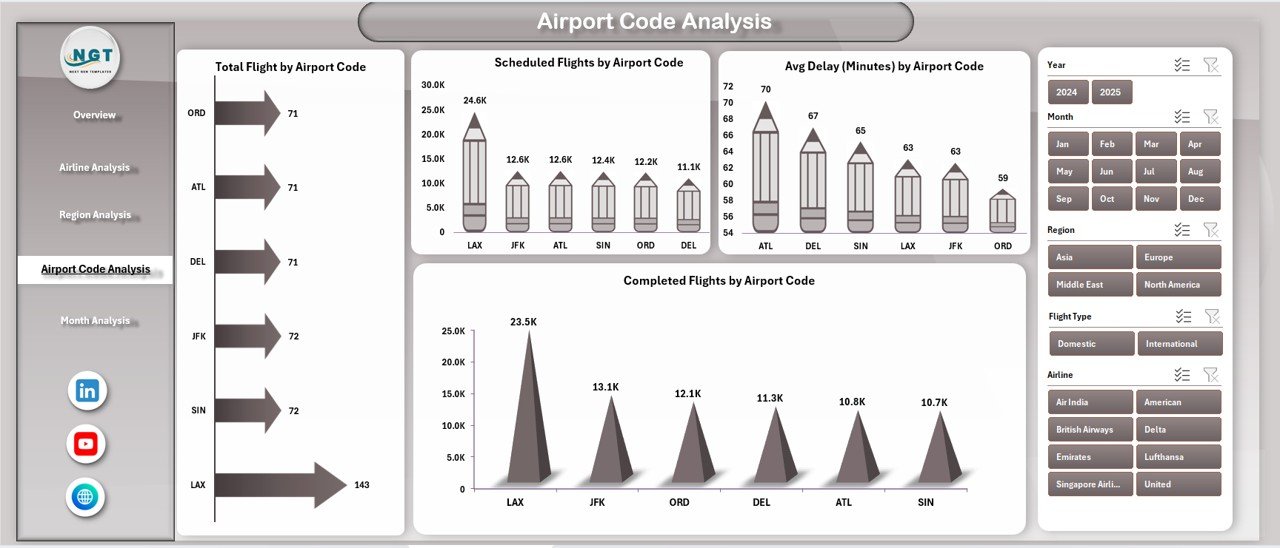
🟦 Airport Code Analysis Page
Focuses on airport-level operations with metrics like total flights, scheduled flights, completed flights, and average delay by airport code.
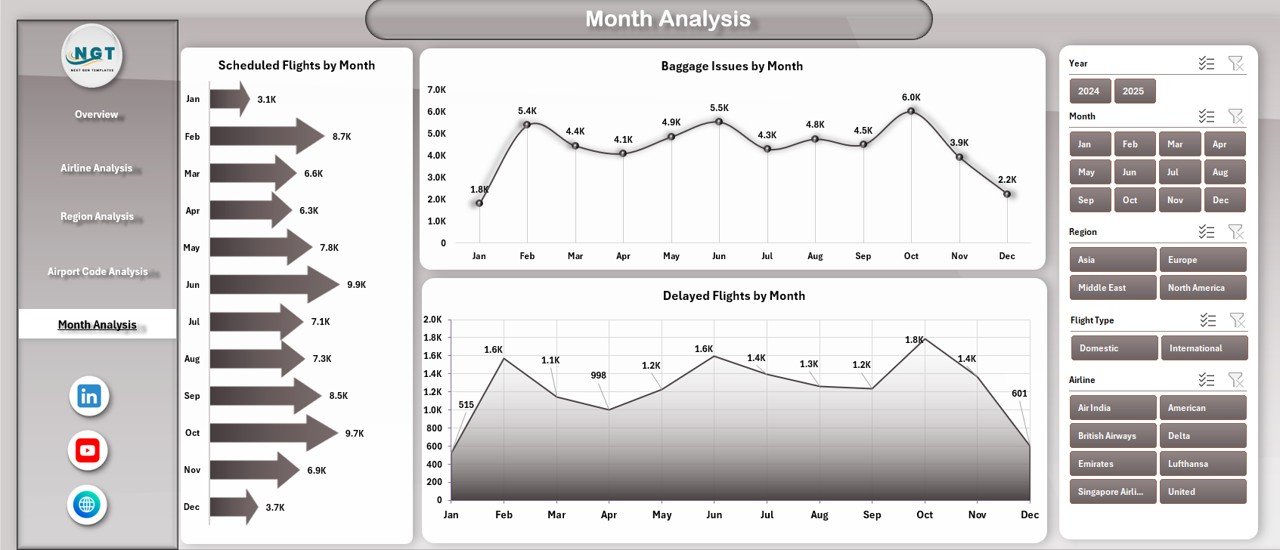
🟦 Month Analysis Page
Tracks time-based trends for scheduled flights, baggage issues, and delayed flights month by month.
🟦 Data Sheet
Stores raw airport data such as flights, airlines, regions, delays, baggage issues, and dates.
🟦 Support Sheet
Manages helper calculations, mappings, and pivot-ready structures.
Together, these components form a complete airport operations analytics solution.
## How to Use the Airports Dashboard in Excel 🧩
Using this dashboard is simple and efficient:
1️⃣ Add or update flight and operational data in the Data Sheet
2️⃣ Refresh pivot tables
3️⃣ Use slicers to filter by airline, region, airport code, or month
4️⃣ Review charts and KPIs instantly
5️⃣ Identify delays, baggage issues, and traffic trends
6️⃣ Use insights to improve planning and operations
Excel handles all calculations and visuals automatically—so teams focus on decisions, not data preparation.
## Who Can Benefit from This Airports Dashboard in Excel 👥
This dashboard is ideal for:
✔️ Airport Operations Managers
✔️ Airport Authorities
✔️ Airline Operations Teams
✔️ Ground Handling Teams
✔️ Aviation Analysts
✔️ Planning & Strategy Teams
✔️ Excel & BI Professionals
Both technical and non-technical users can use it confidently.
### Click here to read the Detailed blog post
Visit our YouTube channel to learn step-by-step video tutorials
👉 https://youtube.com/@PKAnExcelExpert


Reviews
There are no reviews yet.