Modern farming is no longer just about soil and seeds — it is about smart data. Yield, cost, water usage, labor efficiency, and revenue must be monitored consistently. However, many farms still depend on manual reports that consume time and create confusion.
What if you could track all your agricultural KPIs in one interactive, automated, cloud-based system?
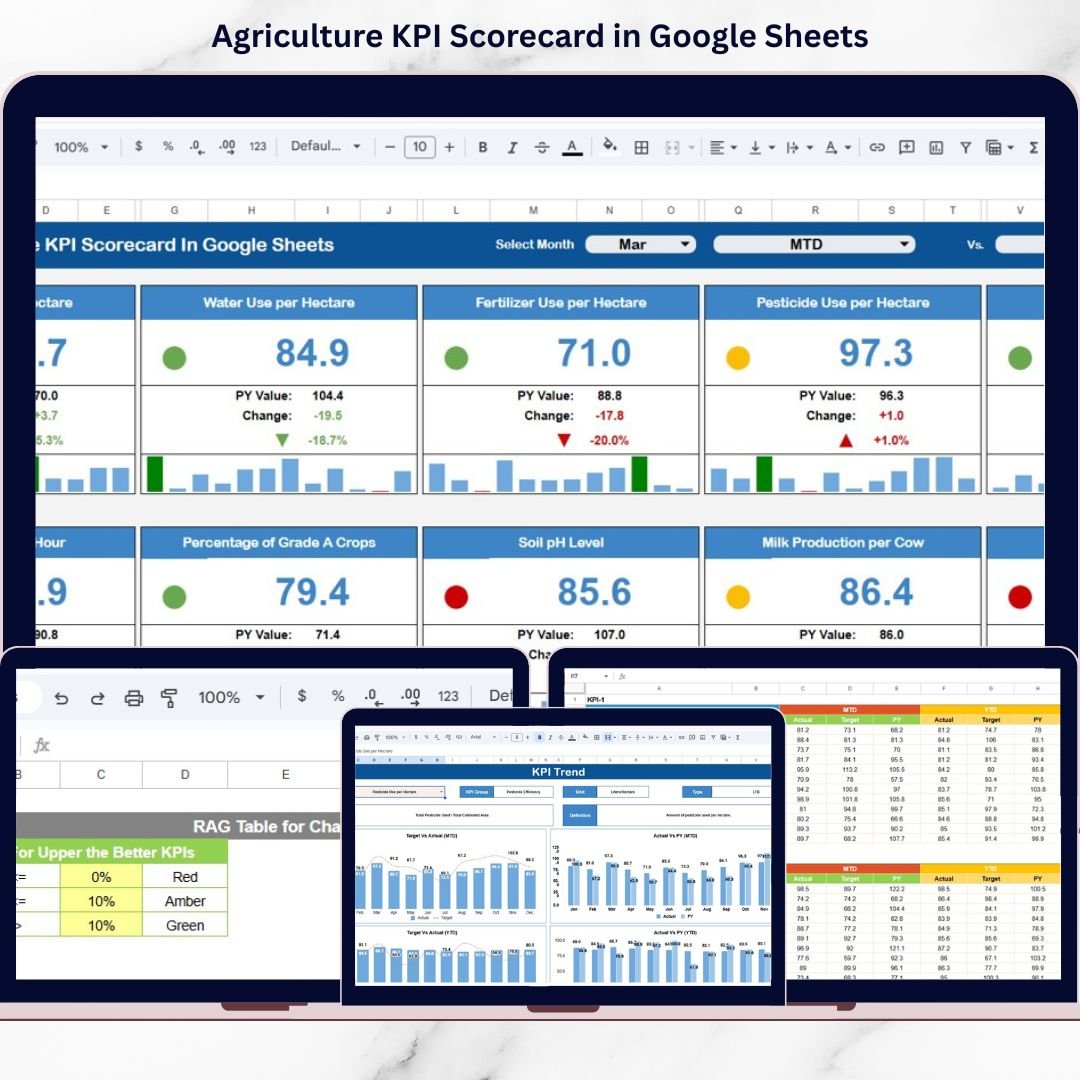
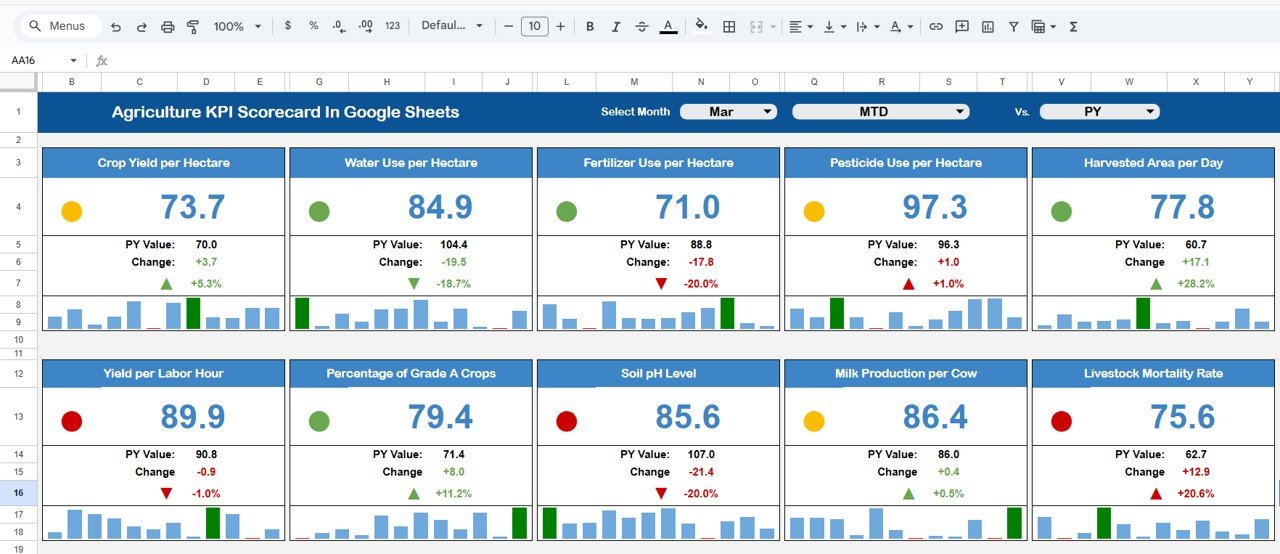
Introducing the Agriculture KPI Scorecard in Google Sheets — a ready-to-use, dynamic performance tracking solution designed for modern farms and agribusinesses.
This powerful Google Sheets template tracks 10 essential agricultural KPIs with automated monthly and yearly calculations. Select any month from the drop-down, and the entire scorecard updates instantly. No formulas to build. No manual analysis. Just clear performance insights.
If you want better yield planning, cost control, and productivity improvement — this scorecard becomes your farm’s command center.
🚀 Key Features of Agriculture KPI Scorecard in Google Sheets
🌾 Interactive Month Selector – Choose any month from the drop-down and watch the entire scorecard update automatically.
📊 MTD & YTD Toggle View – Instantly switch between Monthly (MTD) and Yearly (YTD) performance tracking.
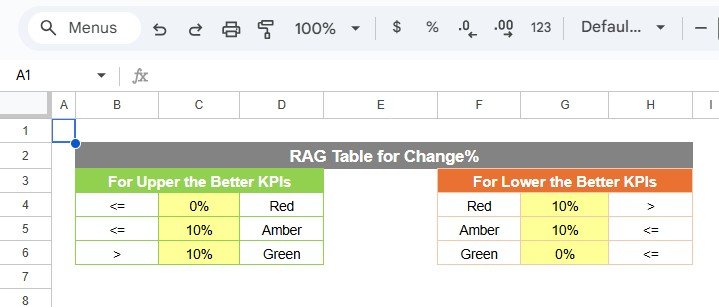
🚦 Traffic Light Indicators – Green, Yellow, and Red color coding highlights performance at a glance.
📈 Up & Down Arrow Performance Signals – Automatically shows Target vs Actual comparison and month-to-month changes.
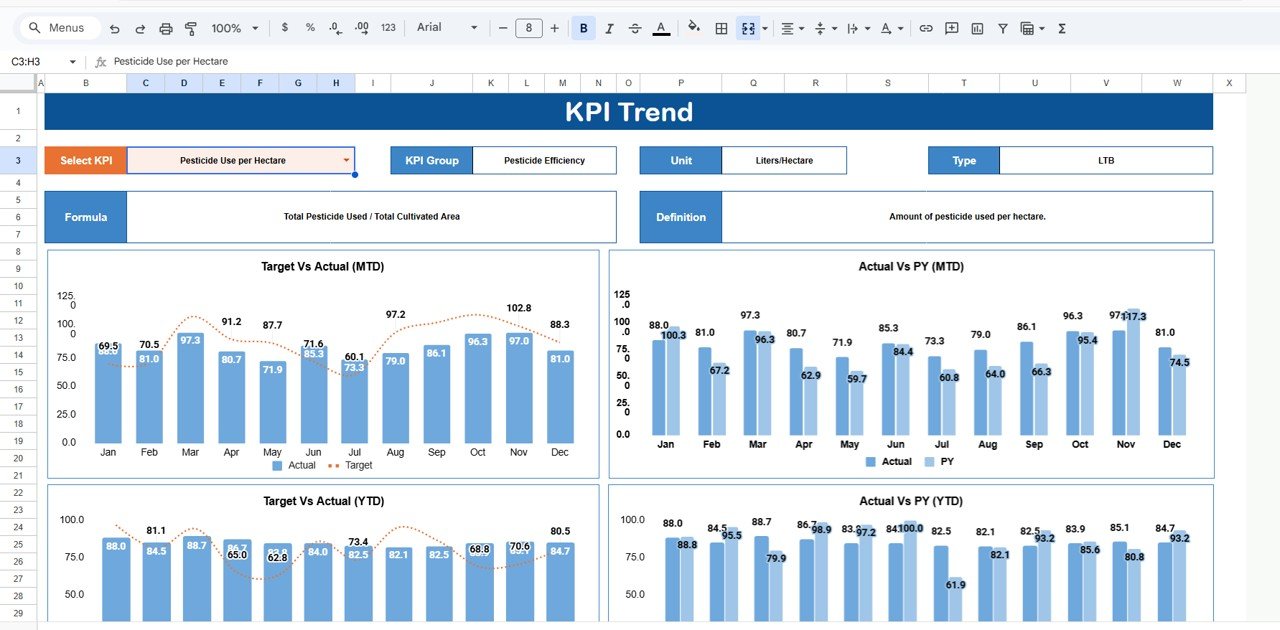
📉 Trend Analysis Sheet (Range C3 Selector) – Select any KPI and view monthly and yearly trend charts instantly.
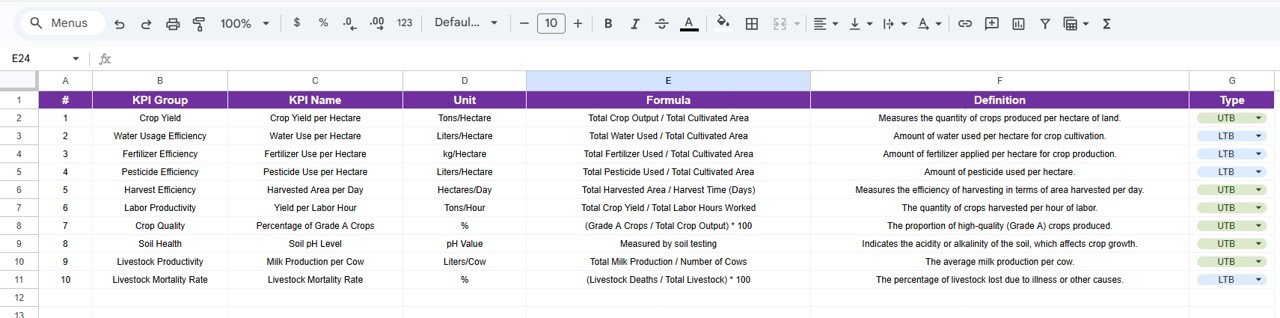
📘 Structured KPI Definition Sheet – Clearly define KPI name, formula, unit, and type (Lower the Better / Upper the Better).
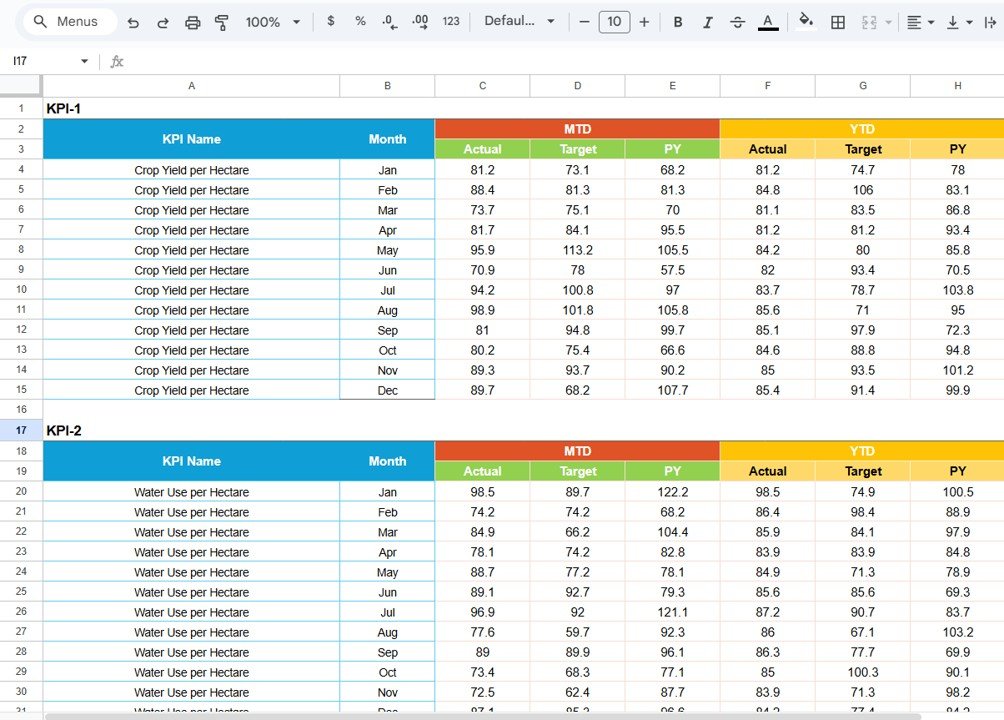
📝 Dedicated Data Input Sheet – Enter raw monthly and yearly values without disturbing the dashboard.
🎨 Customizable Color Settings Tab – Adjust traffic light thresholds and arrow rules based on your farm’s goals.
Because everything is automated inside Google Sheets, you eliminate reporting errors and save hours every month.
📦 What’s Inside the Agriculture KPI Scorecard in Google Sheets
This ready-to-use template includes:
✔️ Interactive Scorecard Dashboard
✔️ 10 Pre-Structured KPI Tracking Layout
✔️ MTD & YTD Performance Calculations
✔️ Target vs Actual % Comparison
✔️ Previous Month & Previous Year Comparison
✔️ Monthly & Yearly Trend Charts
✔️ KPI Definition Sheet
✔️ Data Input Sheet
✔️ Color Customization Settings
Every sheet is logically structured for clarity, accuracy, and easy navigation.
⚙️ How to Use the Agriculture KPI Scorecard in Google Sheets
Using this template is simple:
1️⃣ Enter your monthly actual values in the Data Input sheet.
2️⃣ Update KPI targets and yearly totals.
3️⃣ Select the month from the drop-down menu.
4️⃣ Choose MTD or YTD view.
5️⃣ Analyze traffic lights, arrows, and trend charts.
Within minutes, you can identify yield gaps, cost overruns, and productivity issues.
No advanced technical knowledge required. Just enter your data and let the automation handle the rest.
👨🌾 Who Can Benefit from This Agriculture KPI Scorecard?
This template is ideal for:
🌾 Farm Owners
🏢 Agribusiness Managers
🐄 Dairy & Livestock Farms
🌱 Crop Production Companies
📊 Agricultural Consultants
🚜 Agri Startups
🤝 Agricultural Cooperatives
Because Google Sheets supports real-time collaboration, field teams and office teams can work together seamlessly.
Why This Scorecard Is a Game-Changer
✔️ Instant performance visibility
✔️ Cloud-based accessibility
✔️ Automated KPI calculations
✔️ Early problem detection
✔️ Better yield forecasting
✔️ Improved cost control
✔️ Faster management decisions
Agriculture depends on timing and efficiency. When you track performance visually and consistently, you gain a competitive advantage.
Stop relying on manual spreadsheets. Start managing your farm like a modern data-driven enterprise.
Click here to read the Detailed blog post
Watch the step-by-step video tutorial:


