


In today’s world of modern farming, data is the new fertilizer 🌱 — it helps crops, profits, and performance grow! The Agriculture KPI Scorecard in Excel is your all-in-one analytical tool to track, analyze, and improve key agricultural performance metrics.
Designed for farmers, agribusinesses, and cooperatives, this ready-to-use Excel template allows you to measure success across crop yield, water usage, equipment efficiency, and labor productivity — all in one easy-to-navigate dashboard.
Whether you manage a single farm or multiple agricultural sites, this scorecard transforms raw data into clear visuals and actionable insights — helping you make smart, data-driven decisions every season. 🌾📊
⚙️ Key Features of Agriculture KPI Scorecard in Excel
🌿 4 Pre-Built Worksheets – Scorecard, KPI Trend, Input Data, and KPI Definition for full control.
📊 MTD & YTD Analysis – Track Month-to-Date and Year-to-Date results side by side.
🎯 Actual vs Target Comparison – Instantly identify which KPIs are on track or need attention.
🟢 Visual Indicators – Green for good performance, red for underperformance.
📈 Interactive Trend Charts – Visualize performance over time for each KPI.
📘 Clear KPI Definitions – Standardized formulas, units, and descriptions.
💡 Fully Customizable – Add your own KPIs or modify formulas to suit your operations.
💰 No Extra Software Needed – 100% Excel-based, beginner-friendly, and cost-effective!
📦 What’s Inside the Agriculture KPI Scorecard
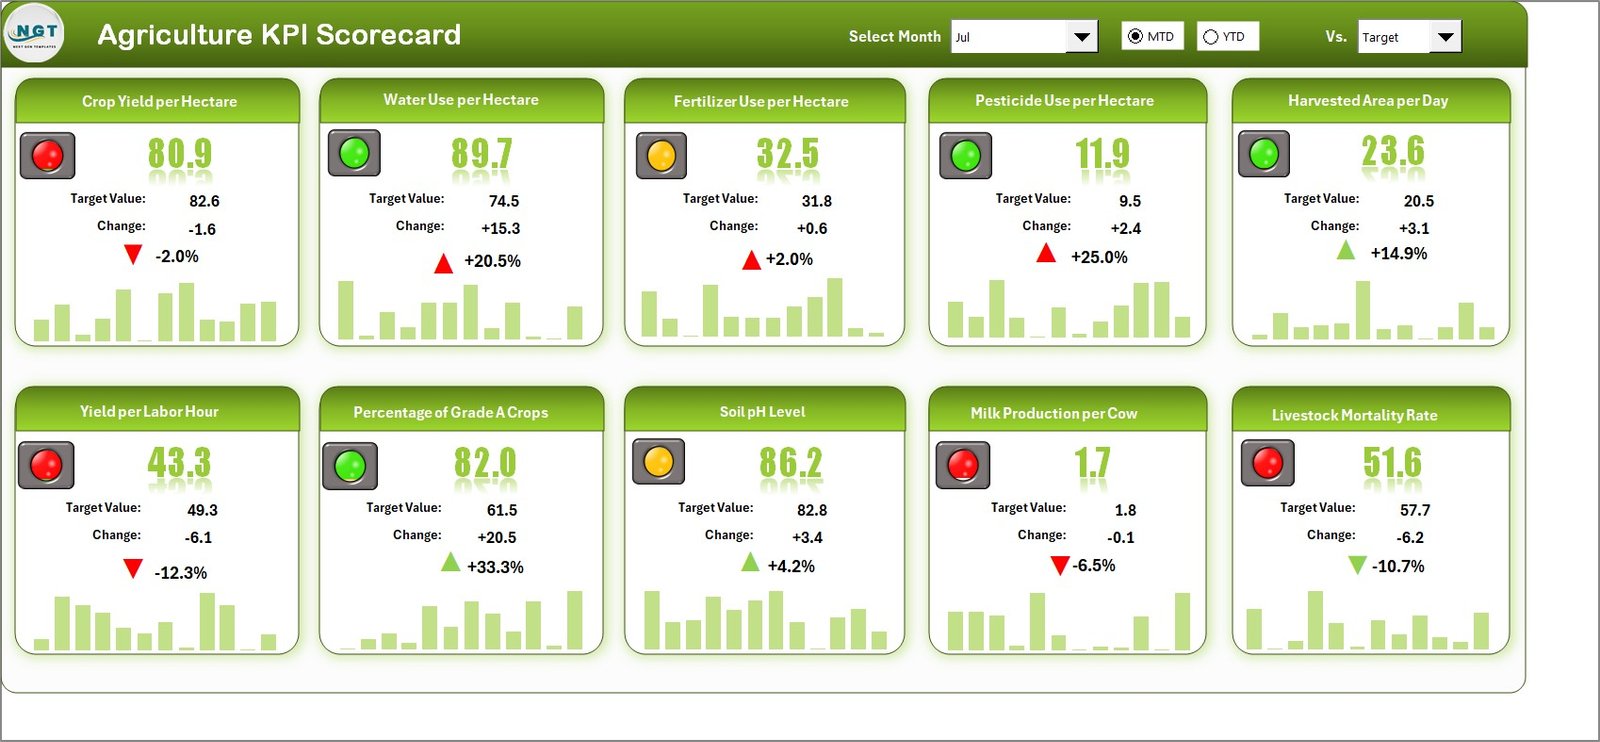
1️⃣ Scorecard Sheet – Your Control Center
View all KPIs in one glance. Switch between MTD and YTD modes using dropdown menus.
Compare Actual vs Target results instantly and spot performance trends with color cues.
It’s your real-time performance dashboard for smarter farm management.
2️⃣ KPI Trend Sheet – Analyze Historical Performance
Select a KPI (cell C3) to explore detailed data and dynamic charts for MTD and YTD trends.
Displays KPI Group, Unit, Formula, Definition, and KPI Type (UTB/LTB).
Ideal for identifying seasonal patterns, efficiency shifts, or yield fluctuations. 🌾📈
3️⃣ Input Data Sheet – Manage Your Monthly Metrics
Enter monthly Actual, Target, and Previous-Year data with error-free validation.
Supports consistent, structured data entry that automatically updates charts and reports.
4️⃣ KPI Definition Sheet – Ensure Transparency
Includes KPI Name, Group, Unit, Formula, and Definition.
Maintains clarity across departments — from field teams to finance.
🧭 How to Use the Agriculture KPI Scorecard in Excel
1️⃣ Start with the KPI Definition Sheet: Add or review KPIs and formulas.
2️⃣ Enter Data: Input Actual and Target values in the Input Data sheet monthly.
3️⃣ Monitor Trends: View visual performance patterns on the KPI Trend sheet.
4️⃣ Review Dashboard: Analyze MTD vs YTD comparisons on the Scorecard sheet.
5️⃣ Update Regularly: Keep data current to maintain accurate insights.
Within minutes, you’ll have a complete picture of your farm’s health — from soil to sales! 🌍
👥 Who Can Benefit from This Scorecard
🚜 Farm Owners & Managers – Track yields, costs, and profitability efficiently.
🌾 Agribusiness Executives – Monitor operations across regions or product lines.
📈 Production Supervisors – Measure crop output, labor hours, and machinery use.
💧 Resource Managers – Analyze water, fertilizer, and energy efficiency.
💰 Finance Teams – Review cost per hectare, revenue, and ROI.
🌿 Sustainability Teams – Track carbon reduction and soil health progress.
No matter the size of your operation, this dashboard empowers you to turn agricultural data into actionable performance insights.
🔗 Click here to read the Detailed Blog Post
🎥 Visit our YouTube channel to learn step-by-step video tutorials
Watch the step-by-step video tutorial:


Reviews
There are no reviews yet.