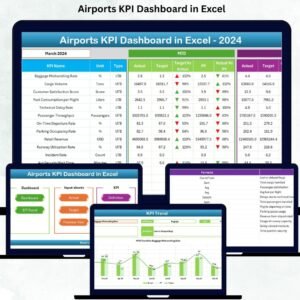
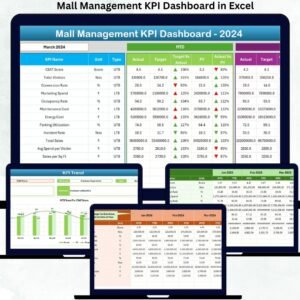
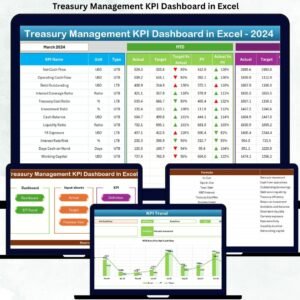
The Agricultural Exports KPI Dashboard in Excel is a comprehensive and customizable tool designed for agricultural businesses, exporters, and trade organizations to track and analyze key performance indicators (KPIs) related to their export operations. This powerful Excel-based dashboard allows users to monitor export performance, sales growth, market trends, and supply chain efficiency, providing valuable insights to optimize agricultural exports and enhance business profitability.
This dashboard is tailored to meet the unique needs of the agricultural export industry, helping businesses monitor production volumes, sales performance, export destinations, and customer satisfaction. Whether you are involved in bulk export, dealing with multiple agricultural products, or managing complex supply chains, this tool simplifies data management and makes it easier to assess performance across all export activities.
Key Features of the Agricultural Exports KPI Dashboard in Excel
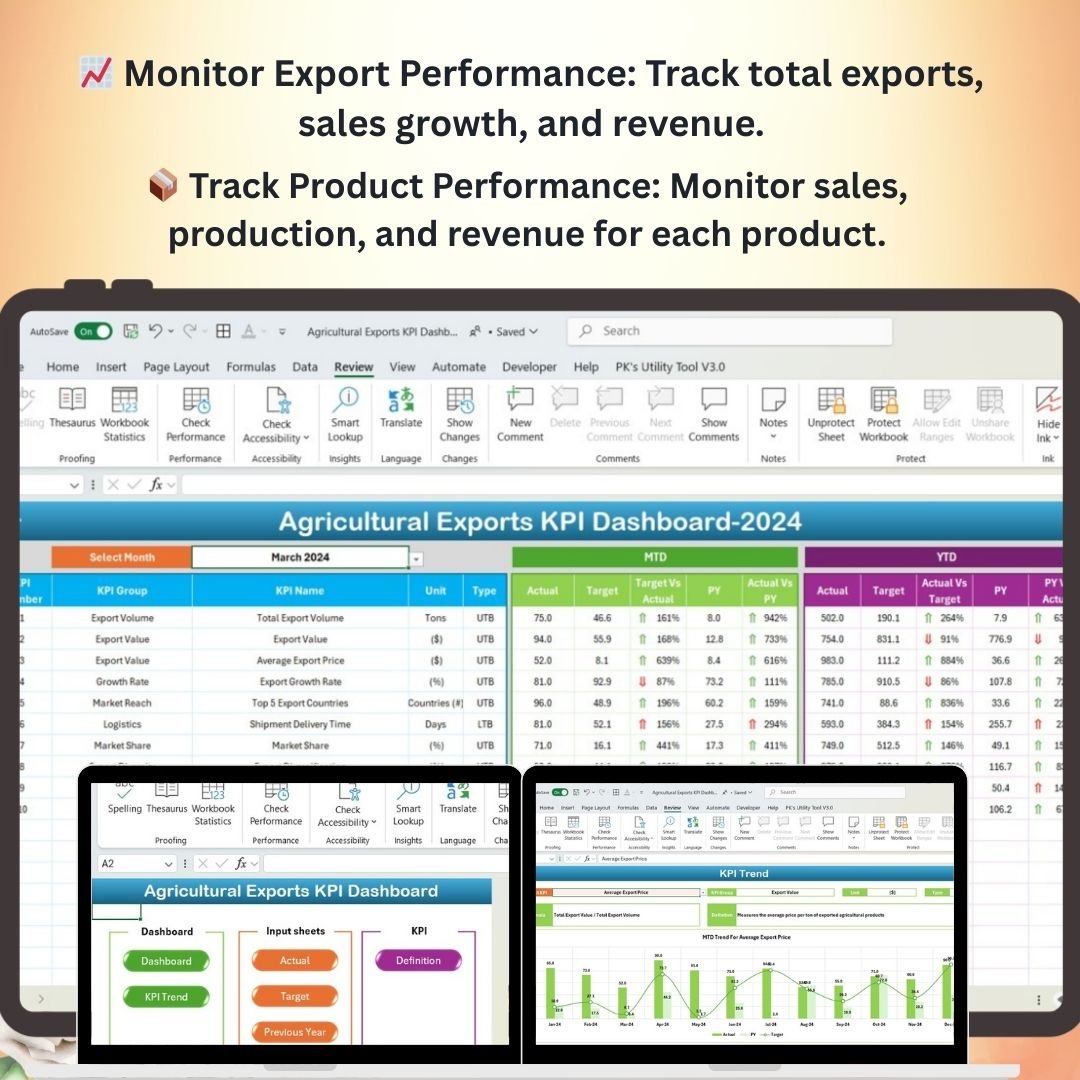
📈 Track Export Performance
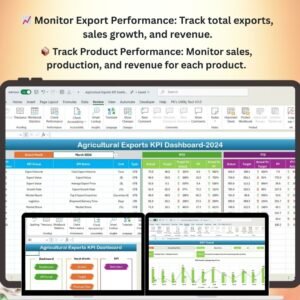
Monitor total exports, export revenue, and sales growth over time. This feature helps you stay on top of your export performance, identify top-selling products, and optimize your export strategies.
🌍 Analyze Export Destinations & Markets
Track the performance of exports to various regions and countries. Identify high-performing markets, track demand trends, and explore new market opportunities for growth.
📦 Monitor Product Performance
Evaluate the performance of individual agricultural products based on sales data, revenue, and production volumes. Use this data to identify which products are performing well and which need more attention.
🔗 Supply Chain Efficiency
Assess the efficiency of your supply chain, including production timelines, transportation, and distribution. Monitor supplier performance to ensure timely delivery and reduce delays in the export process.
💬 Customer Satisfaction & Feedback
Track customer satisfaction through surveys, feedback, and retention rates. Analyze this data to improve the quality of your products and customer service.
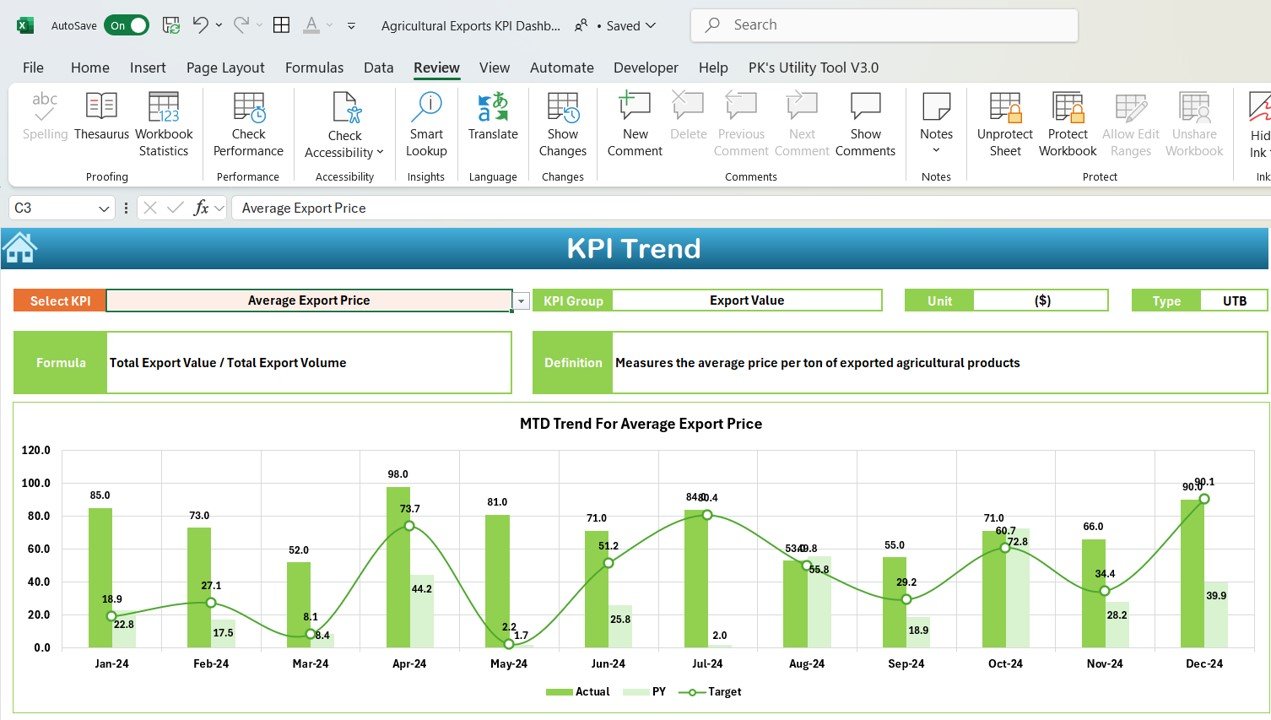
🖥️ Real-Time Data Insights
The Excel dashboard provides real-time updates and interactive features, allowing you to analyze KPIs on-demand. Use filters, slicers, and drill-down options to gain deeper insights into your export performance.
Why You’ll Love the Agricultural Exports KPI Dashboard in Excel
✅ Comprehensive Export Tracking
Easily track all aspects of your agricultural exports, from sales growth to product performance, ensuring you never miss a key metric.
✅ Monitor Export Markets
Track export performance across different regions and identify new opportunities for growth by analyzing market trends and demand patterns.
✅ Optimize Supply Chain Efficiency
Analyze your supply chain to identify inefficiencies, optimize processes, and ensure timely delivery of agricultural products.
✅ Enhance Customer Satisfaction
Use customer feedback data to improve the quality of your products and services, ensuring you meet the expectations of your international clients.
✅ Fully Customizable & Scalable
Tailor the dashboard to suit your business’s specific needs, whether you’re tracking one agricultural product or managing a diverse range of products across multiple regions.
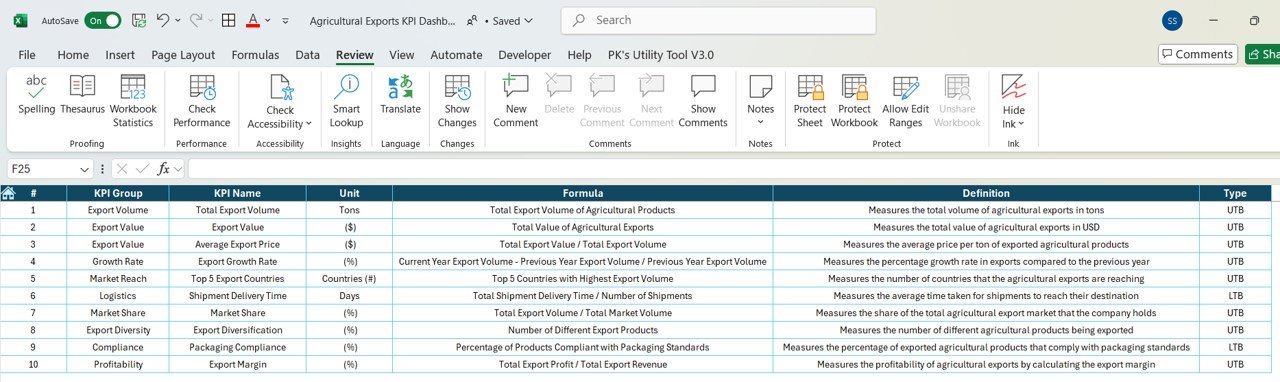
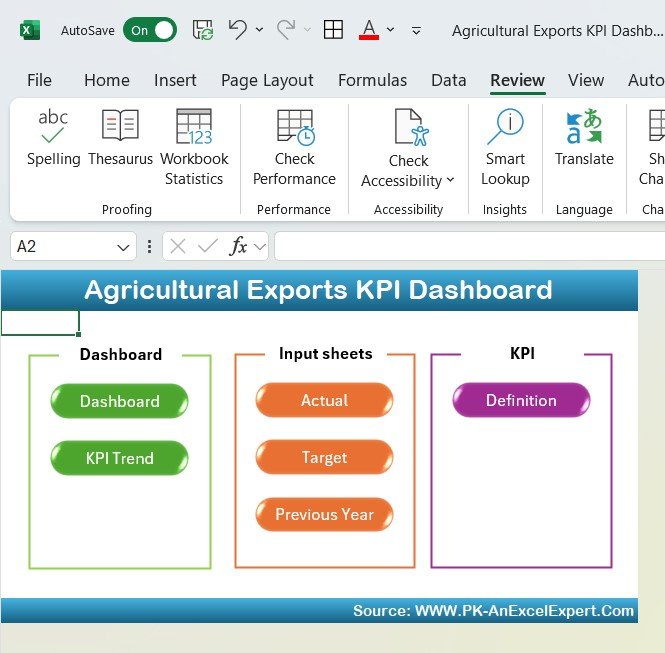
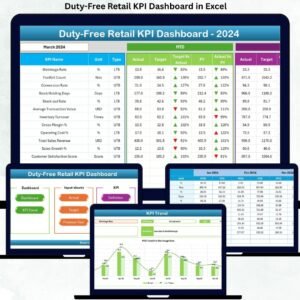
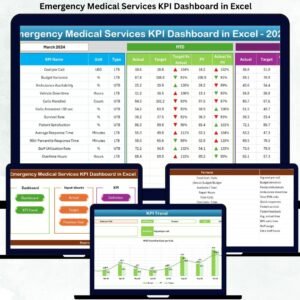
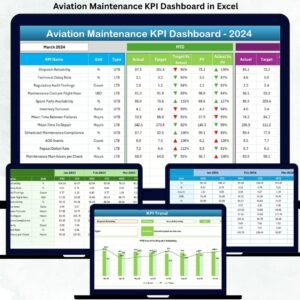
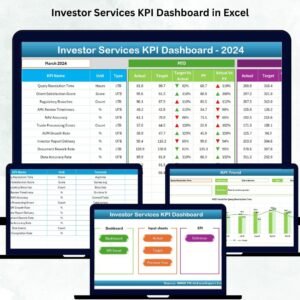
What’s Inside the Agricultural Exports KPI Dashboard Template in Excel?
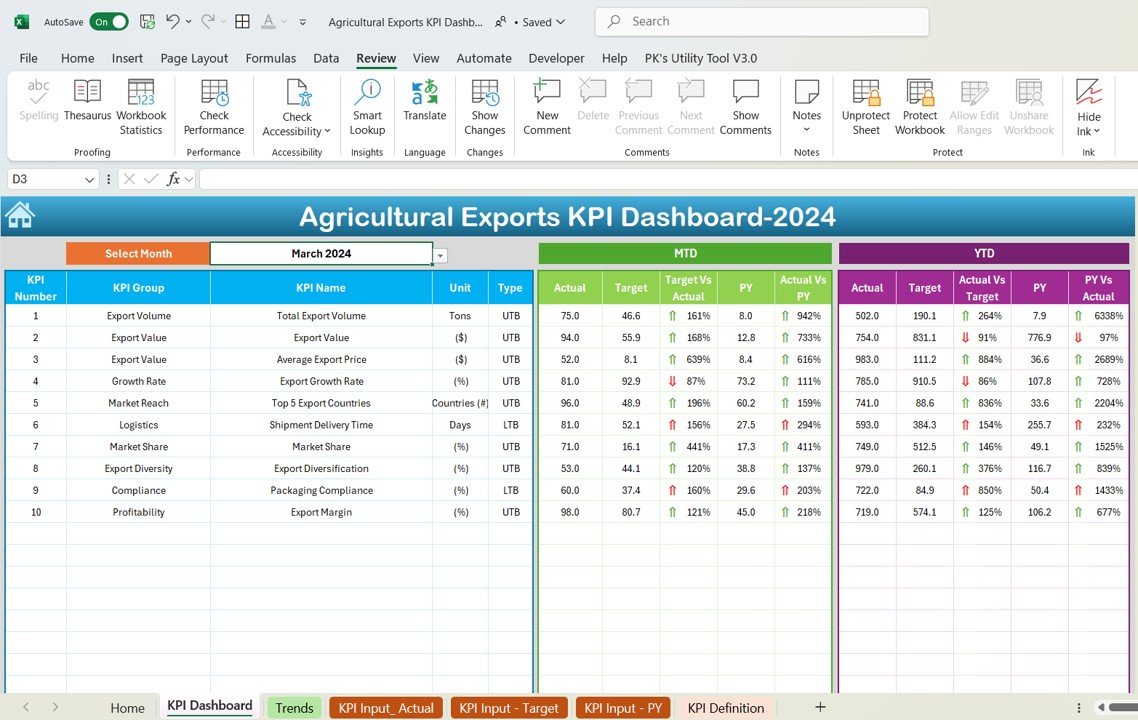
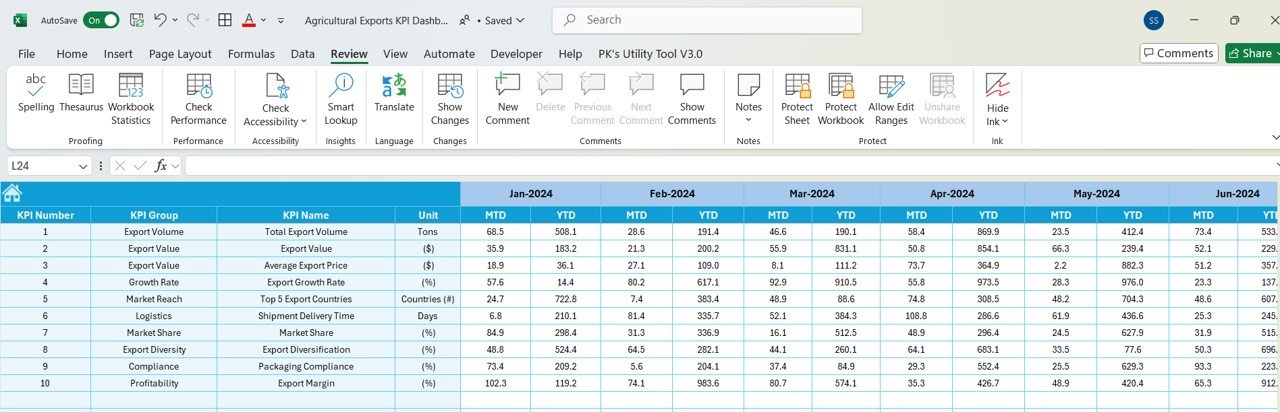
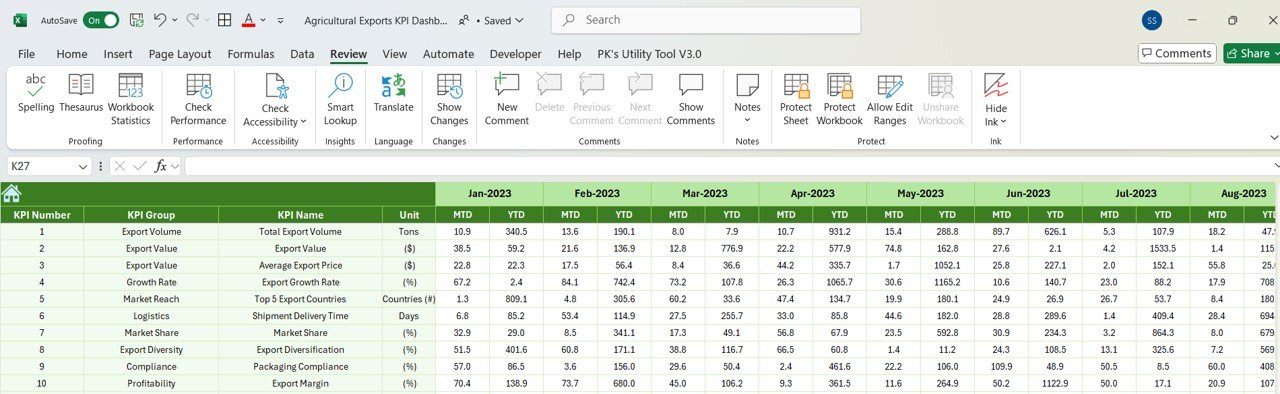
- Export Performance Metrics: Track revenue, sales growth, and total exports over time.
- Market & Export Destination Analysis: Monitor the performance of exports to various regions and countries.
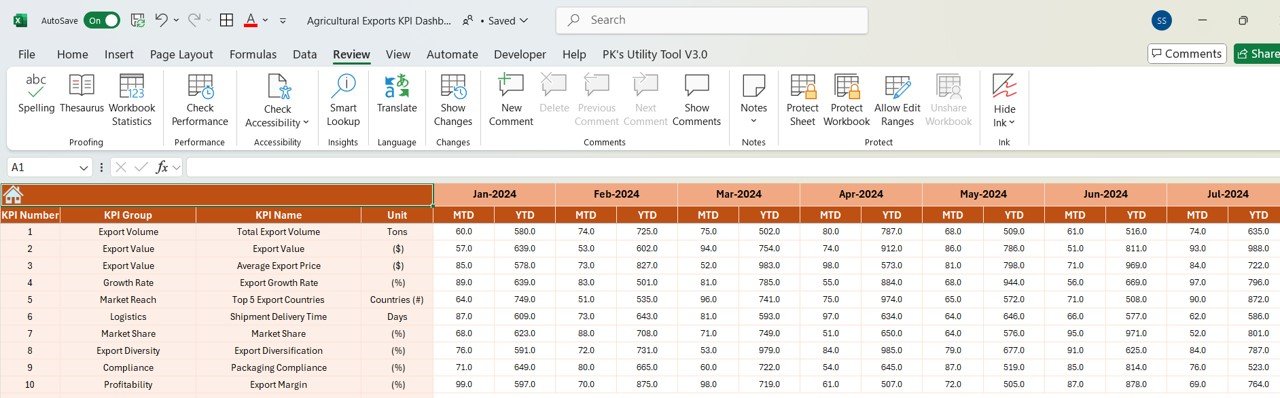
- Product Performance Tracking: Evaluate individual agricultural products by sales, revenue, and production volume.
- Supply Chain Efficiency Monitoring: Analyze transportation, distribution, and supplier performance to improve supply chain efficiency.
- Customer Satisfaction Monitoring: Track customer feedback, retention, and satisfaction to improve your service quality.
- Real-Time Data Insights: Use interactive features to get live updates and insights on your export performance.
How to Use the Agricultural Exports KPI Dashboard in Excel
1️⃣ Download the Template: Get immediate access to the Agricultural Exports KPI Dashboard in Excel.
2️⃣ Input Your Data: Enter your export data, sales figures, product information, and customer feedback into the dashboard.
3️⃣ Track & Monitor KPIs: Use the dashboard to monitor all aspects of your export performance, including sales, market demand, product performance, and supply chain efficiency.
4️⃣ Analyze & Optimize: Use the real-time data and insights to identify areas for improvement, optimize supply chains, and enhance customer satisfaction.
Who Can Benefit from the Agricultural Exports KPI Dashboard in Excel?
🔹 Agricultural Exporters
🔹 Producers & Farmers
🔹 Supply Chain Managers
🔹 Export Managers & Consultants
🔹 Trade Organizations & Agencies
🔹 Business Analysts in the Agricultural Sector
Ensure the success and growth of your agricultural export operations with the Agricultural Exports KPI Dashboard in Excel. Track key metrics, optimize supply chains, monitor product performance, and expand your market reach with this customizable, interactive tool.
Click here to read the Detailed blog post
Visit our YouTube channel to learn step-by-step video tutorials
Youtube.com/@PKAnExcelExpert


Reviews
There are no reviews yet.