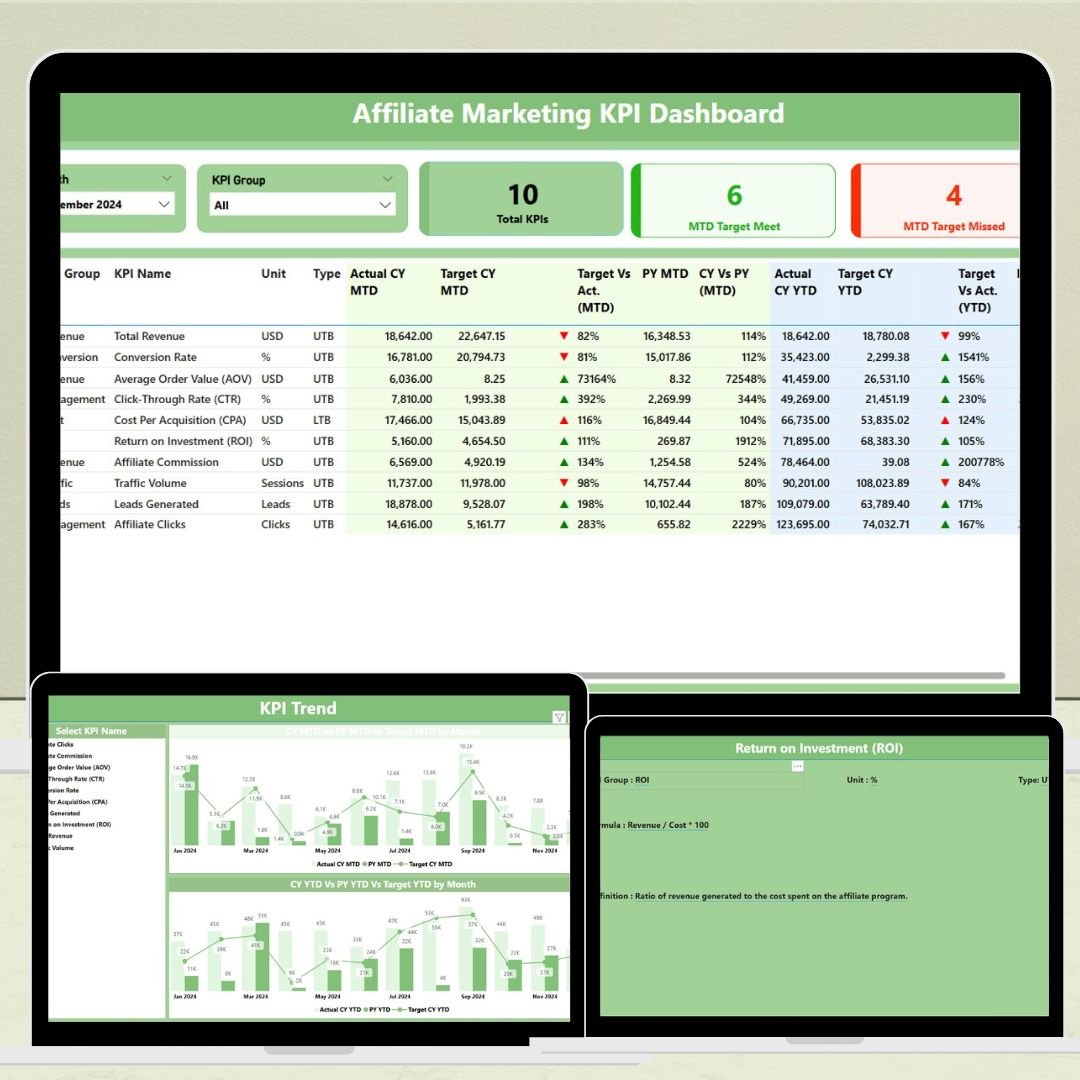

The Affiliate Marketing KPI Dashboard in Power BI is a powerful and intuitive tool designed to help businesses and affiliate marketers track and optimize their affiliate marketing performance. This Power BI dashboard provides a comprehensive view of essential key performance indicators (KPIs), such as affiliate sales, conversion rates, commissions earned, traffic sources, and overall campaign performance.
Whether you’re a seasoned affiliate marketer, a marketing manager, or an e-commerce business owner, this dashboard helps you make data-driven decisions to improve your affiliate marketing strategies. By monitoring and analyzing KPIs in real-time, you can identify top-performing affiliates, optimize commissions, and maximize ROI on your affiliate marketing efforts.
Key Features of the Affiliate Marketing KPI Dashboard in Power BI
📊 Comprehensive KPI Tracking
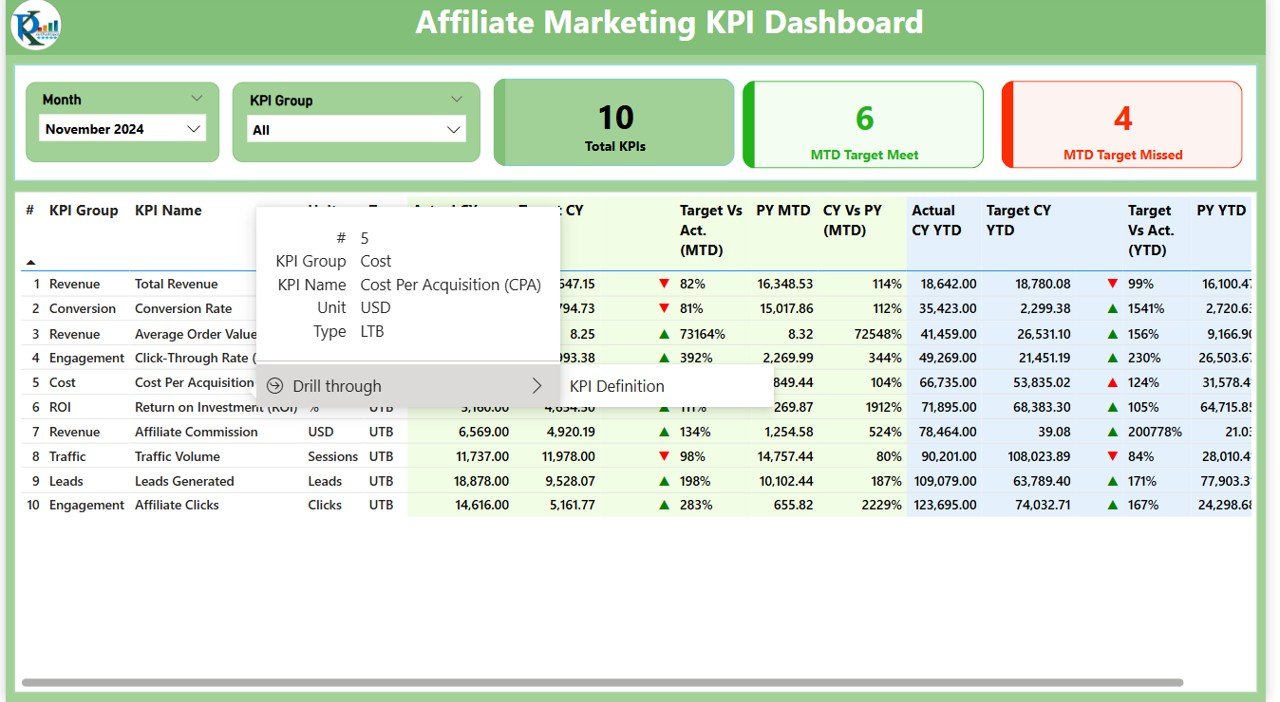
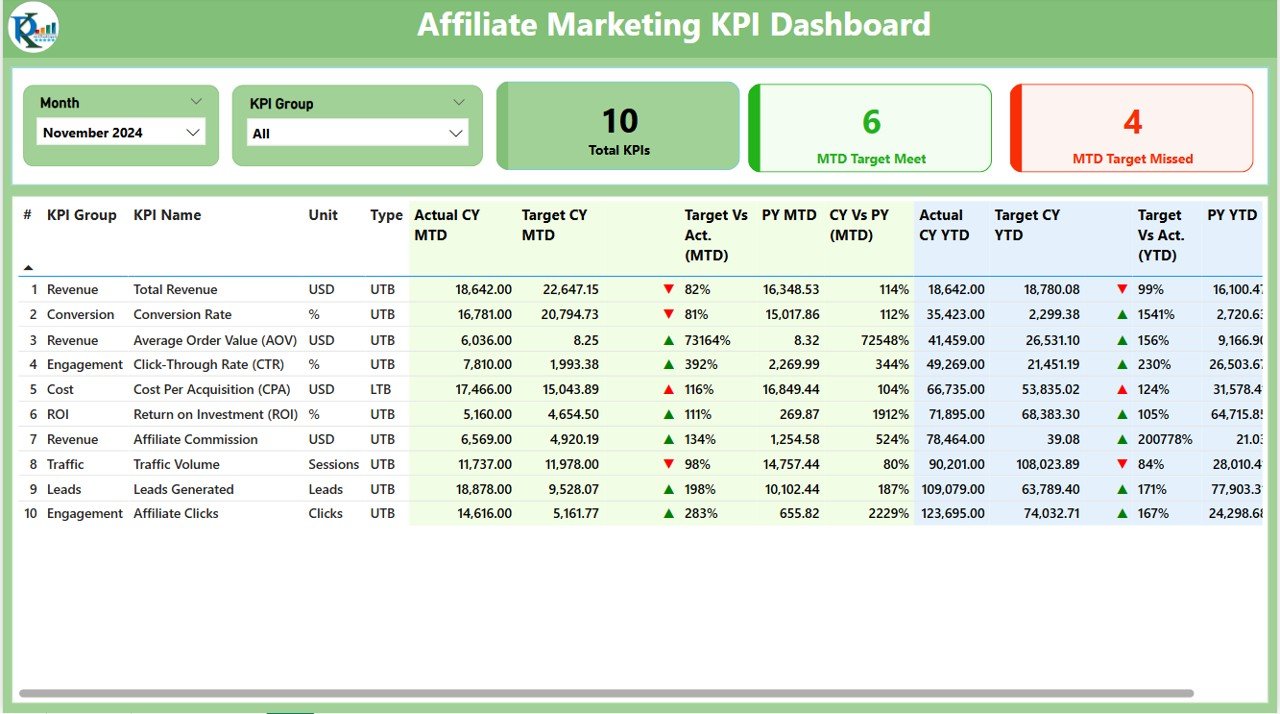
Track essential affiliate marketing metrics such as total sales, affiliate commissions, click-through rates (CTR), conversion rates, and traffic performance. Get a complete picture of your affiliate marketing efforts in real-time.
💸 Commission & Sales Tracking
Monitor affiliate sales, track commissions earned by affiliates, and see how these relate to overall sales and conversions. This feature helps you understand which affiliates are generating the most revenue and allows for better commission planning.
🔗 Affiliate Performance Monitoring
Track the performance of individual affiliates, including the number of clicks, conversions, and commissions earned. Identify top affiliates and assess which marketing channels are most effective.
📈 Traffic Source & Conversion Analysis
Analyze which traffic sources are driving the most affiliate traffic and conversions. Use this data to refine your marketing campaigns and invest in the most profitable channels.
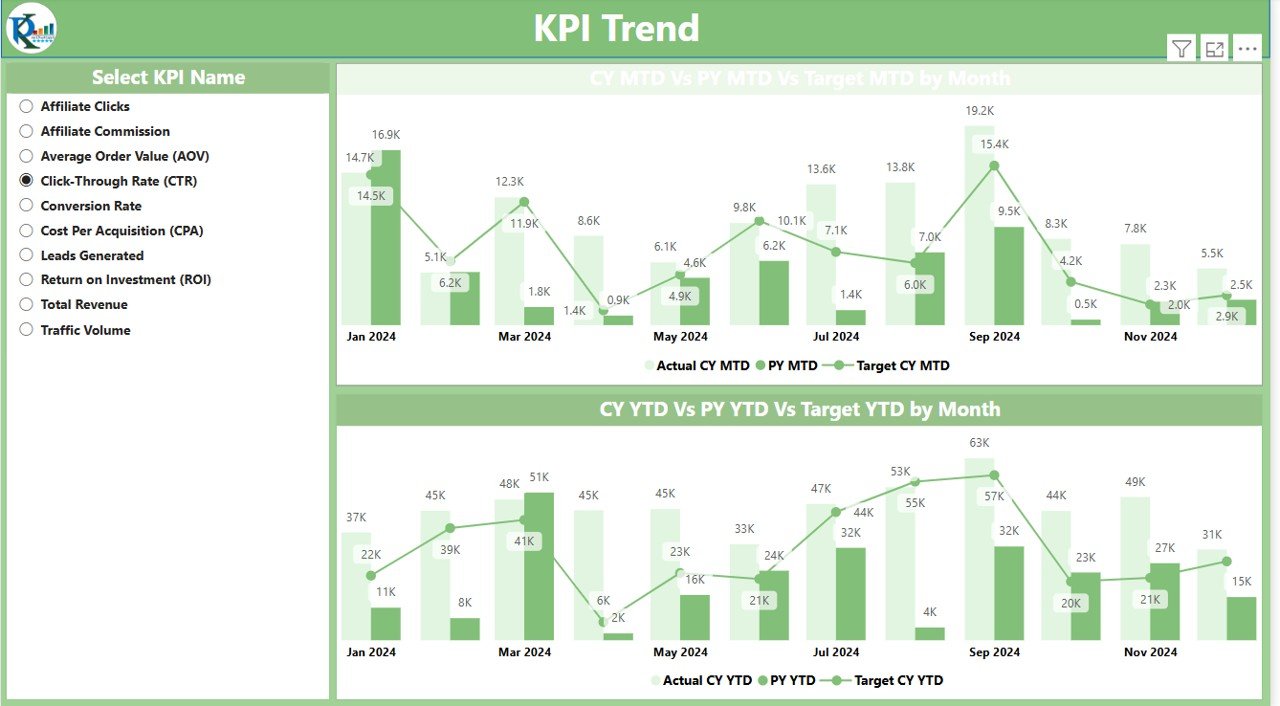
📅 Time-Based Performance Tracking
Monitor affiliate performance over different time periods (daily, weekly, monthly) and track the effectiveness of your campaigns over time. Understand trends and adjust strategies accordingly.
⚙️ Customizable & Scalable
The dashboard is fully customizable to suit your specific affiliate marketing goals and needs. Add new KPIs, change data sources, and adjust visuals to track the metrics that matter most to your business.
Why You’ll Love the Affiliate Marketing KPI Dashboard in Power BI
✅ Real-Time Insights
Track affiliate performance in real time, allowing you to make data-driven decisions and take action quickly to optimize your campaigns.
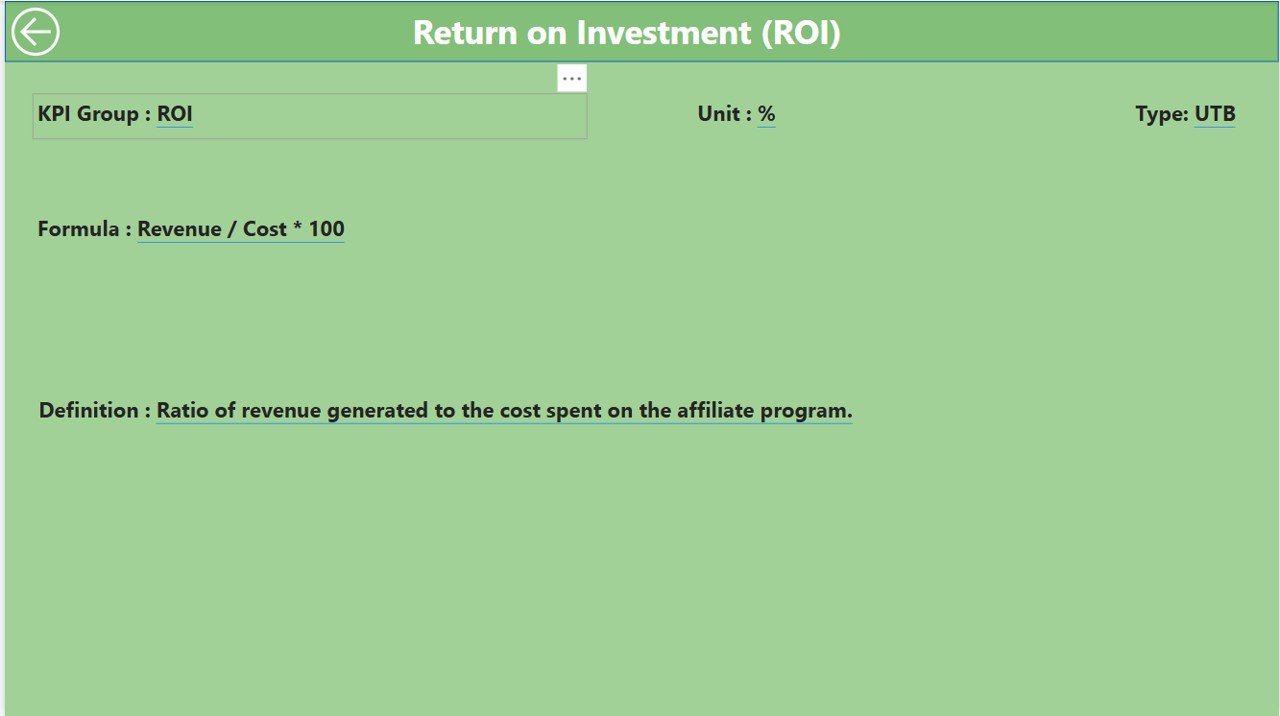
✅ Maximize ROI
Identify top-performing affiliates and optimize your commission structure to maximize ROI. Allocate resources to high-performing affiliates and improve overall profitability.
✅ Improve Campaign Effectiveness
Analyze traffic sources, conversion rates, and commissions to refine your marketing campaigns. Understand what’s working and adjust strategies for better results.
✅ Efficient Affiliate Management
Monitor affiliate activity and identify opportunities for improvement. Use insights to better manage and support affiliates, ensuring that your relationships remain strong and profitable.
✅ Scalable for Growing Businesses
Whether you have a small affiliate program or are managing a large network of affiliates, this dashboard can scale to meet your needs and provide in-depth insights.
What’s Inside the Affiliate Marketing KPI Dashboard in Power BI?
-
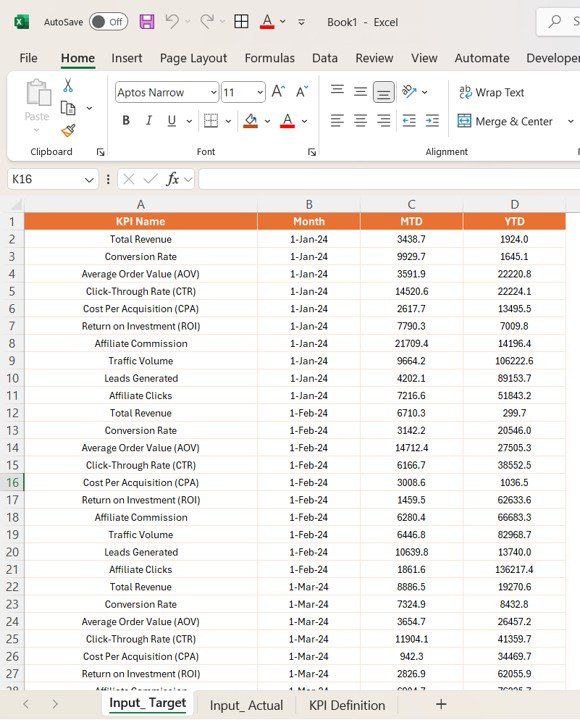
Affiliate Sales Tracking: Monitor sales generated by affiliates and track their performance over time.
-
Commission Tracking: Track commissions earned by affiliates and evaluate their contributions to overall sales.
-
Conversion Rate Monitoring: Analyze the conversion rates of affiliate traffic to identify which affiliates and channels are driving the best results.
-
Traffic Source Analysis: Track the effectiveness of different traffic sources, such as organic, paid, and referral traffic.
-
Time-Based Performance: Monitor KPIs over daily, weekly, and monthly periods for trend analysis.
-
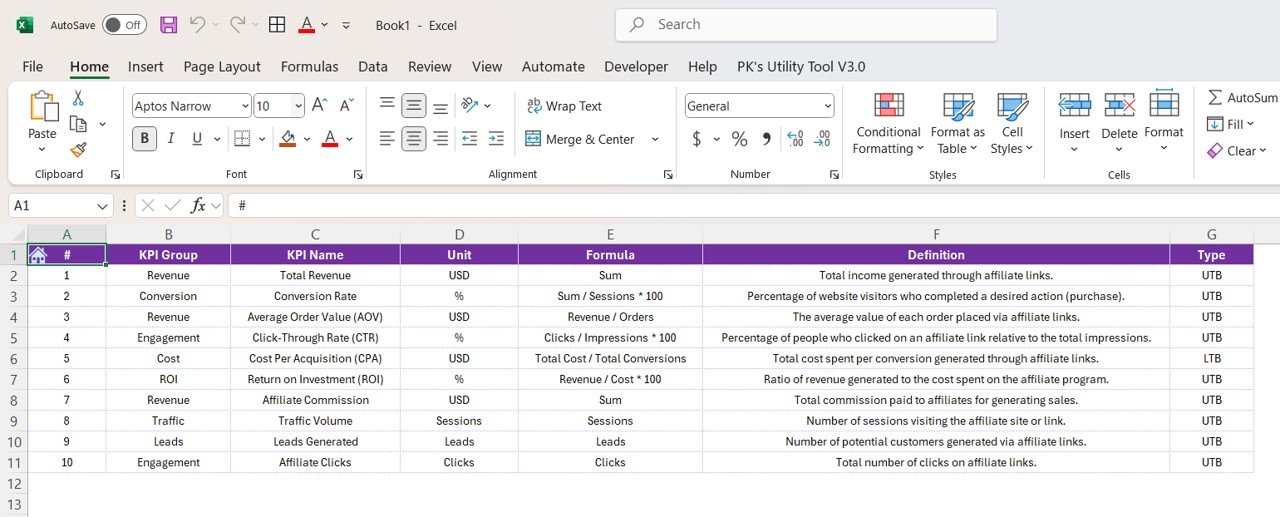
Customizable Features: Tailor the dashboard to track any specific KPIs relevant to your affiliate marketing program.
How to Use the Affiliate Marketing KPI Dashboard in Power BI
1️⃣ Download the Template: Access the Affiliate Marketing KPI Dashboard in Power BI instantly.
2️⃣ Integrate Data Sources: Connect your affiliate program data, including sales, commissions, and traffic data, to the dashboard.
3️⃣ Monitor Affiliate Performance: Track performance metrics for individual affiliates and evaluate their contributions to your marketing efforts.
4️⃣ Analyze Traffic & Conversions: Use traffic source and conversion rate data to optimize marketing campaigns and focus on the most profitable channels.
5️⃣ Optimize ROI & Campaigns: Leverage the insights from the dashboard to optimize your affiliate marketing strategy, improve relationships with affiliates, and maximize ROI.
Who Can Benefit from the Affiliate Marketing KPI Dashboard in Power BI?
🔹 Affiliate Marketers
🔹 Marketing Managers & Teams
🔹 E-commerce Business Owners
🔹 Digital Marketing Agencies
🔹 Affiliate Program Managers
🔹 Brands and Companies Running Affiliate Programs
🔹 Performance Marketing Analysts
Boost your affiliate marketing efforts and maximize ROI with the Affiliate Marketing KPI Dashboard in Power BI. Track key metrics, optimize campaigns, and take your affiliate marketing program to the next level.
Click here to read the Detailed blog post
Visit our YouTube channel to learn step-by-step video tutorials
Youtube.com/@PKAnExcelExpert


Reviews
There are no reviews yet.