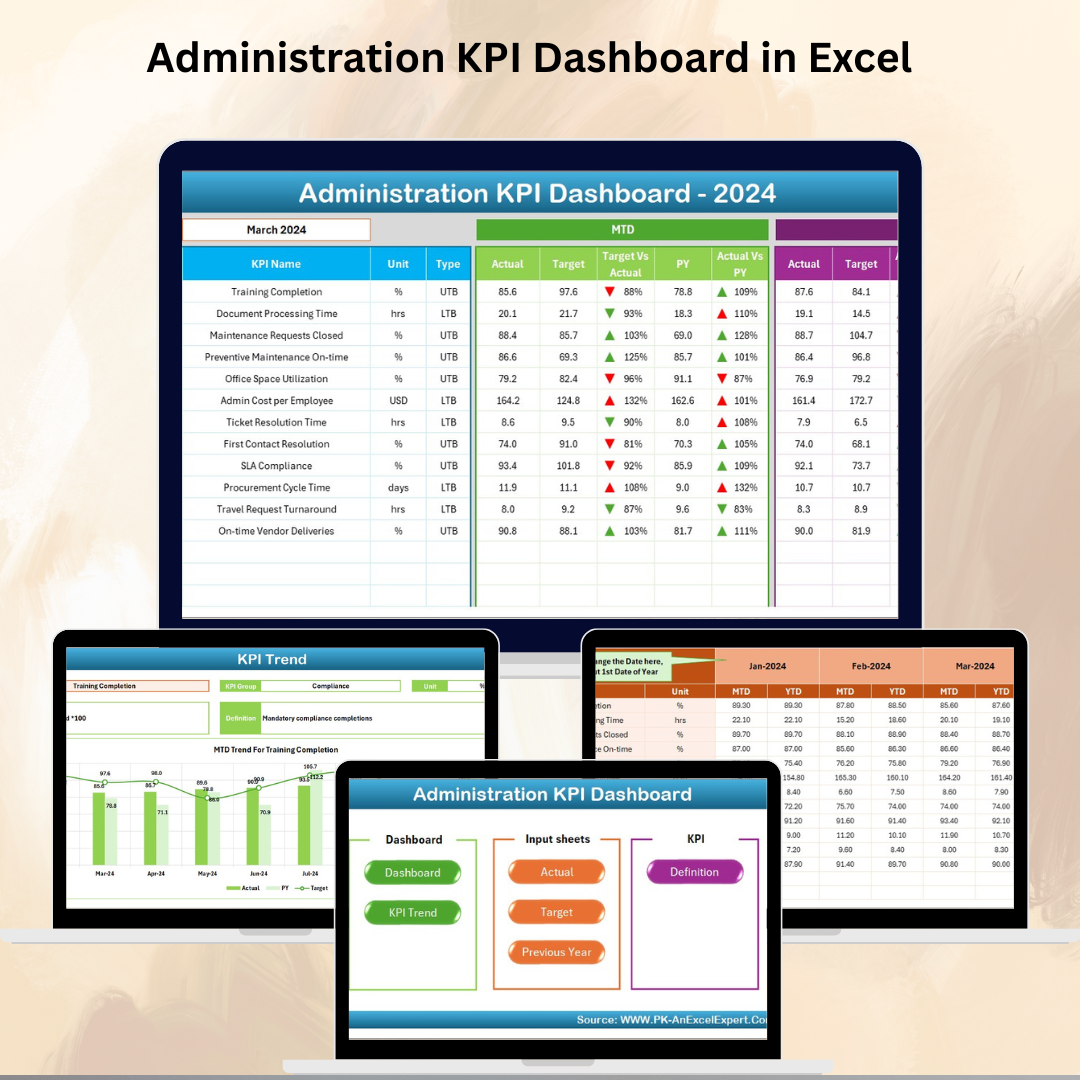
Running administration smoothly is essential for organizational success. Administrative teams are responsible for everything from employee support and document processing to facility operations and compliance tracking. Without proper measurement, inefficiencies and gaps often go unnoticed, leading to wasted resources and delays. That’s why the Administration KPI Dashboard in Excel is a game-changer.
This ready-to-use Excel dashboard helps managers consolidate all administrative KPIs into one structured file. With interactive features such as slicers, charts, KPI cards, and automated comparisons, it provides real-time insights into performance trends. Instead of relying on scattered reports, you’ll have a clear, centralized view of administrative efficiency at your fingertips.
✨ Key Features of the Administration KPI Dashboard
-
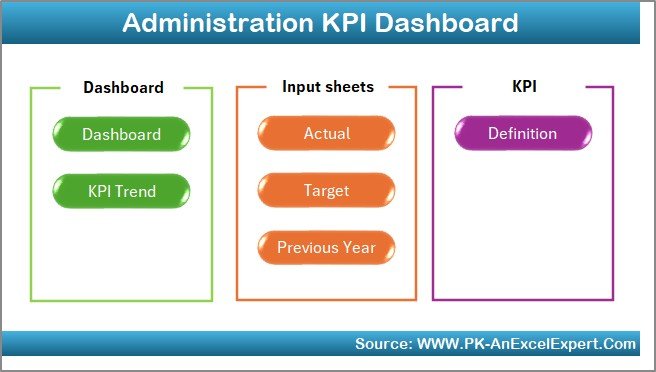
🏠 Home Sheet – Acts as the navigation hub with quick-access buttons to other sheets.
-
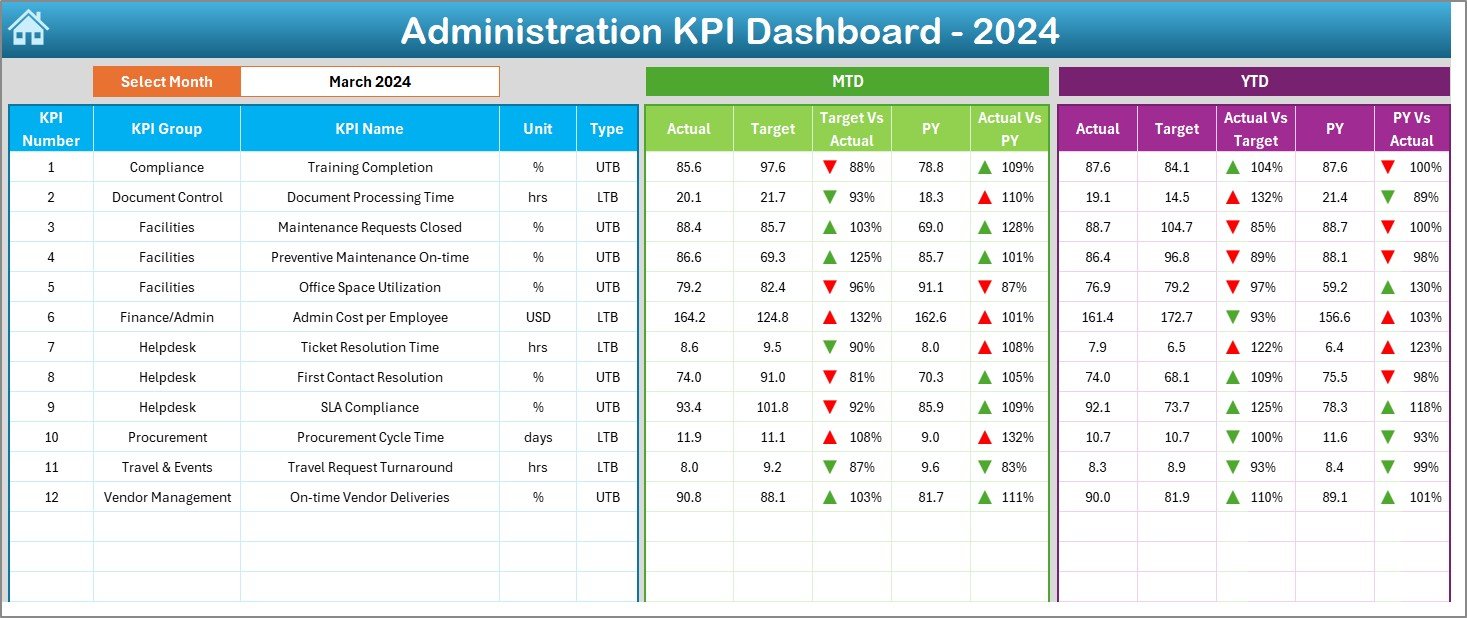
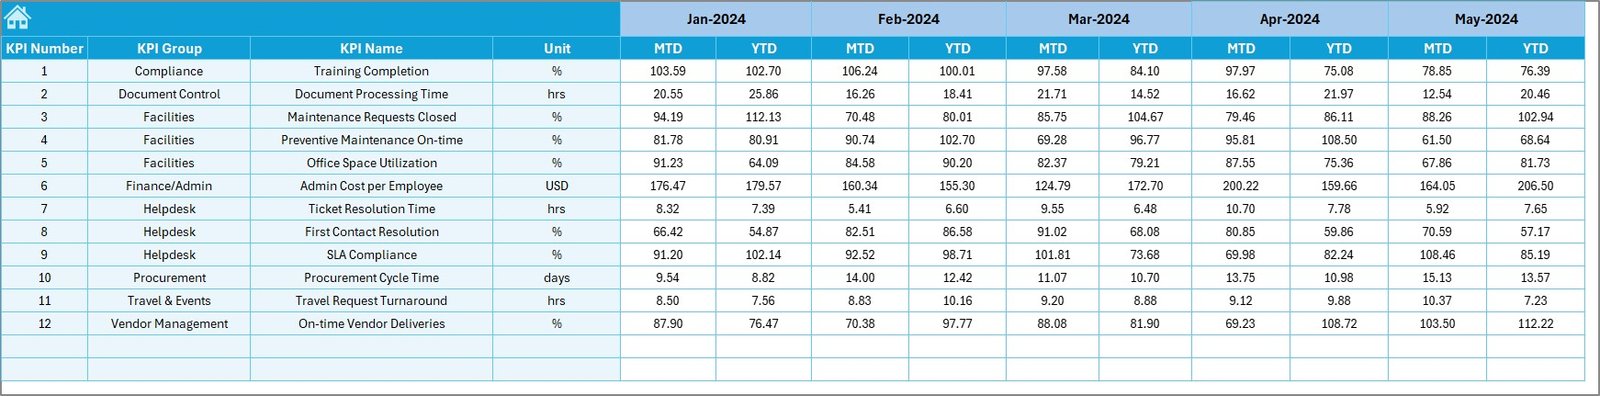
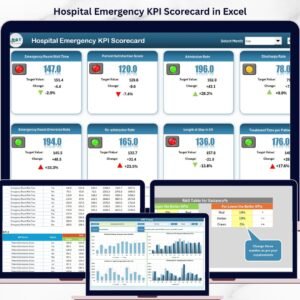
📊 Dashboard Sheet – The main performance screen. Select a reporting month, and instantly view Month-to-Date (MTD) and Year-to-Date (YTD) results with Actual vs. Target and Actual vs. Previous Year comparisons. Conditional formatting with arrows highlights trends.
-
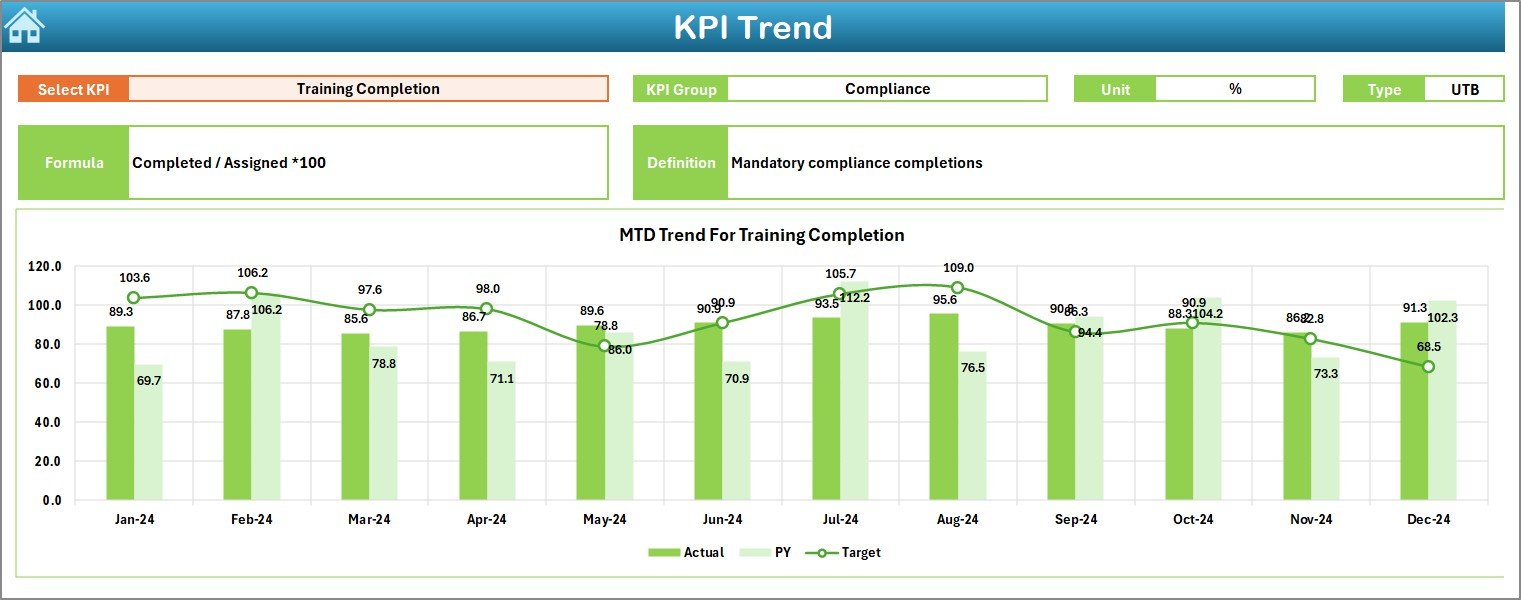
📈 KPI Trend Sheet – Drill down into specific KPIs. See details like KPI group, unit, type (UTB/LTB), formula, and definition along with MTD and YTD trend charts.
-
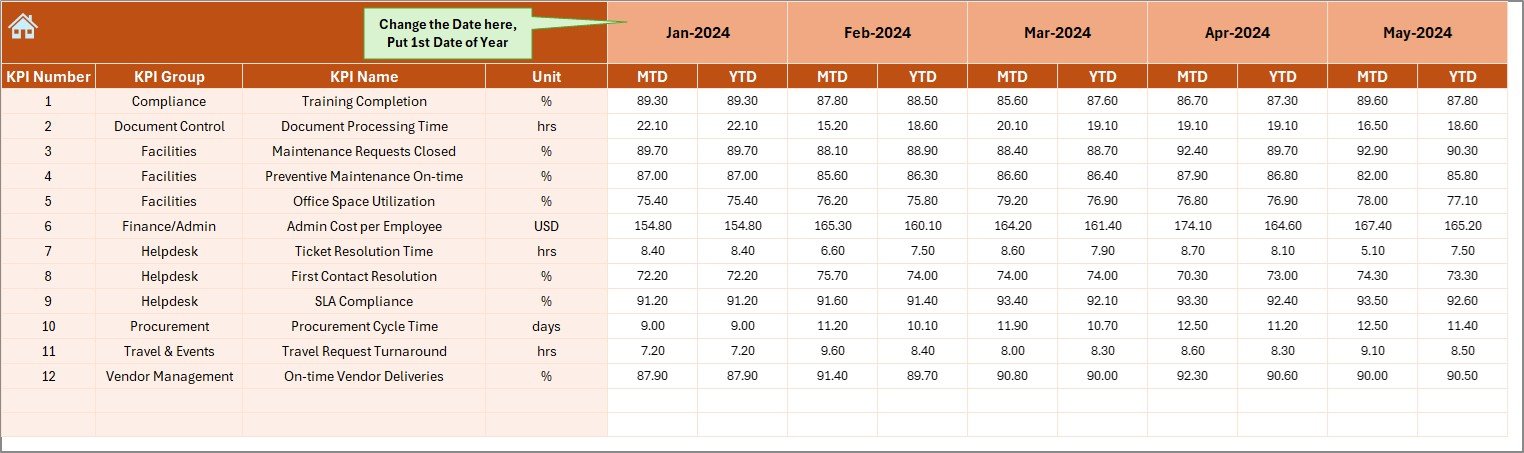
📥 Actual Numbers Input Sheet – Enter actual monthly performance figures. Includes an option to set your fiscal year starting month.
-
🎯 Target Sheet – Record monthly and yearly KPI targets for accurate comparisons.
-
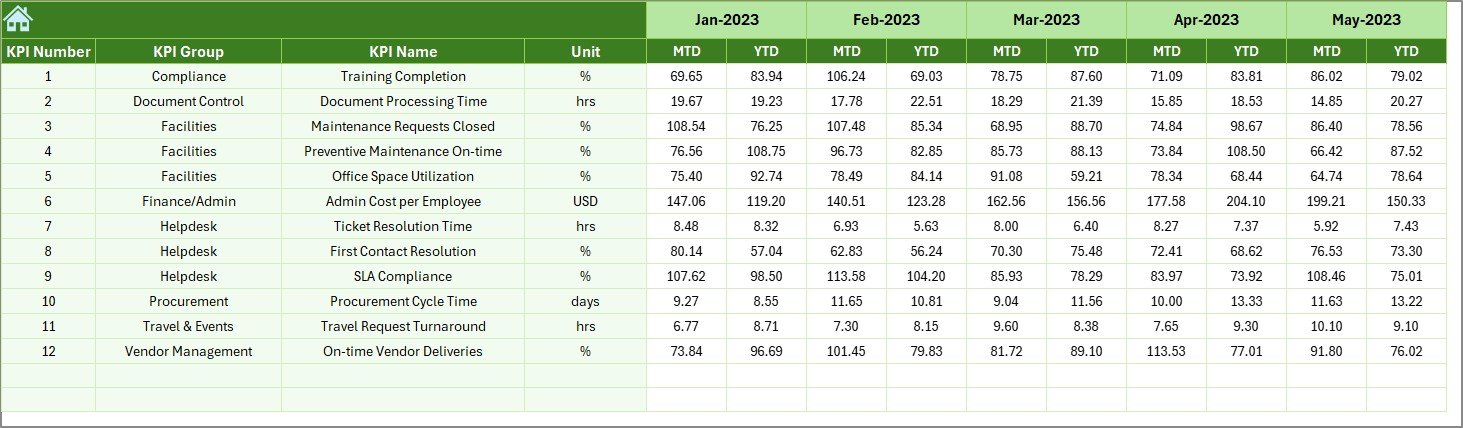
📆 Previous Year Numbers Sheet – Store historical performance data for side-by-side analysis.
-
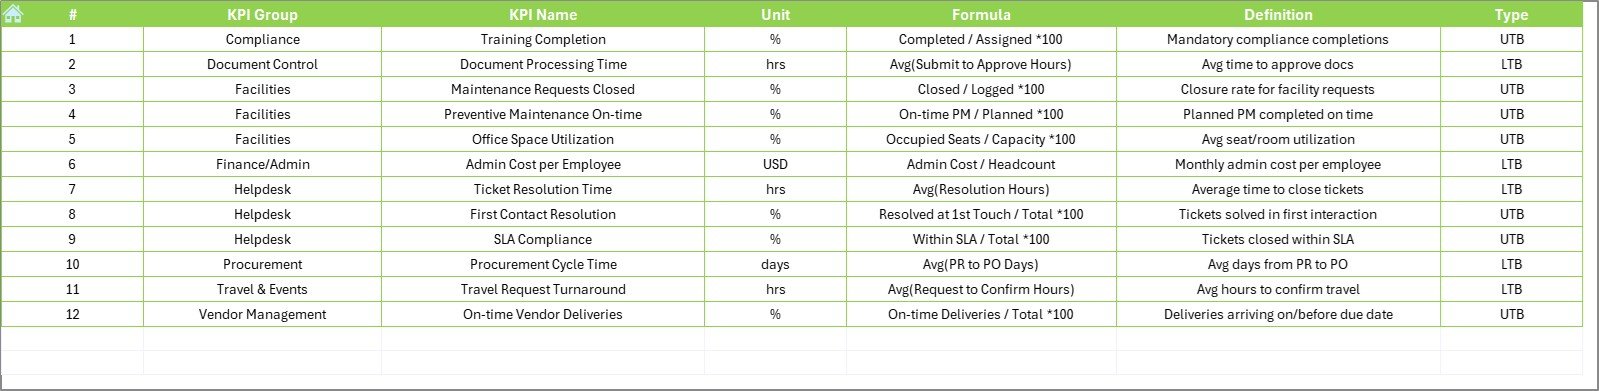
📖 KPI Definition Sheet – A reference library that lists KPI names, formulas, definitions, and classifications (Upper the Better or Lower the Better).
📊 What’s Inside the Dashboard
-
KPI Cards – Track key metrics like response time, facility maintenance cost per employee, compliance scores, and budget utilization.
-
Dynamic Charts – Visualize performance trends across months, years, and targets.
-
Interactive Slicers – Filter by KPI group or time frame for customized reporting.
-
Performance Comparisons – Instantly see Actual vs. Target and Actual vs. Previous Year data.
-
Structured Data Sheets – Keep raw data, targets, and historical information organized and audit-ready.
🛠️ How to Use the Administration KPI Dashboard
1️⃣ Input Actual Data in the Actual Numbers sheet each month.
2️⃣ Enter Targets in the Target sheet for MTD and YTD goals.
3️⃣ Add Historical Data in the Previous Year sheet for comparison.
4️⃣ Review the Dashboard for instant KPI snapshots.
5️⃣ Analyze Trends in the KPI Trend sheet for detailed insights.
6️⃣ Use Conditional Formatting indicators to quickly spot problem areas.
7️⃣ Share Reports with managers or auditors to support decision-making.
👥 Who Can Benefit from This Dashboard?
-
🏢 Corporate Administration Teams – Streamline employee support and resource tracking.
-
🏭 Manufacturing & Operations – Monitor facility costs, compliance, and resource utilization.
-
📚 Educational Institutions – Manage administrative efficiency across campuses.
-
🏥 Healthcare Organizations – Track compliance and operational KPIs.
-
👔 Small Businesses – Gain structured reporting without expensive software.
💡 Advantages of the Administration KPI Dashboard in Excel
-
⚡ Real-Time Insights – Automated calculations and charts update instantly.
-
✅ Standardized Reporting – Consistent formats across all departments.
-
⏳ Time Savings – Reduce hours spent preparing manual reports.
-
📈 Transparency – Clear KPI definitions improve accountability.
-
💰 Cost-Effective – Built entirely in Excel; no extra software required.
-
🔧 Customizable – Modify KPIs, charts, or formulas as per your organization’s needs.
🚀 Opportunities for Improvement
-
🔄 Automation – Add Power Query or VBA for automatic data refresh.
-
🔗 Integration – Connect with HR or ERP systems for real-time data feeds.
-
☁️ Collaboration – Share via Excel Online or SharePoint for team access.
-
📊 Advanced Visualization – For larger datasets, integrate with Power BI.
✅ Best Practices
-
Define KPIs clearly before implementation.
-
Set realistic and achievable targets aligned with business strategy.
-
Update actual numbers regularly to maintain accuracy.
-
Use conditional formatting to highlight underperformance.
-
Keep the dashboard clean and simple—focus on the most impactful KPIs.
-
Review both monthly and yearly trends to drive continuous improvement.
Click here to read the Detailed blog post
Visit our YouTube channel to learn step-by-step video tutorials
👉 PKAnExcelExpert


Reviews
There are no reviews yet.