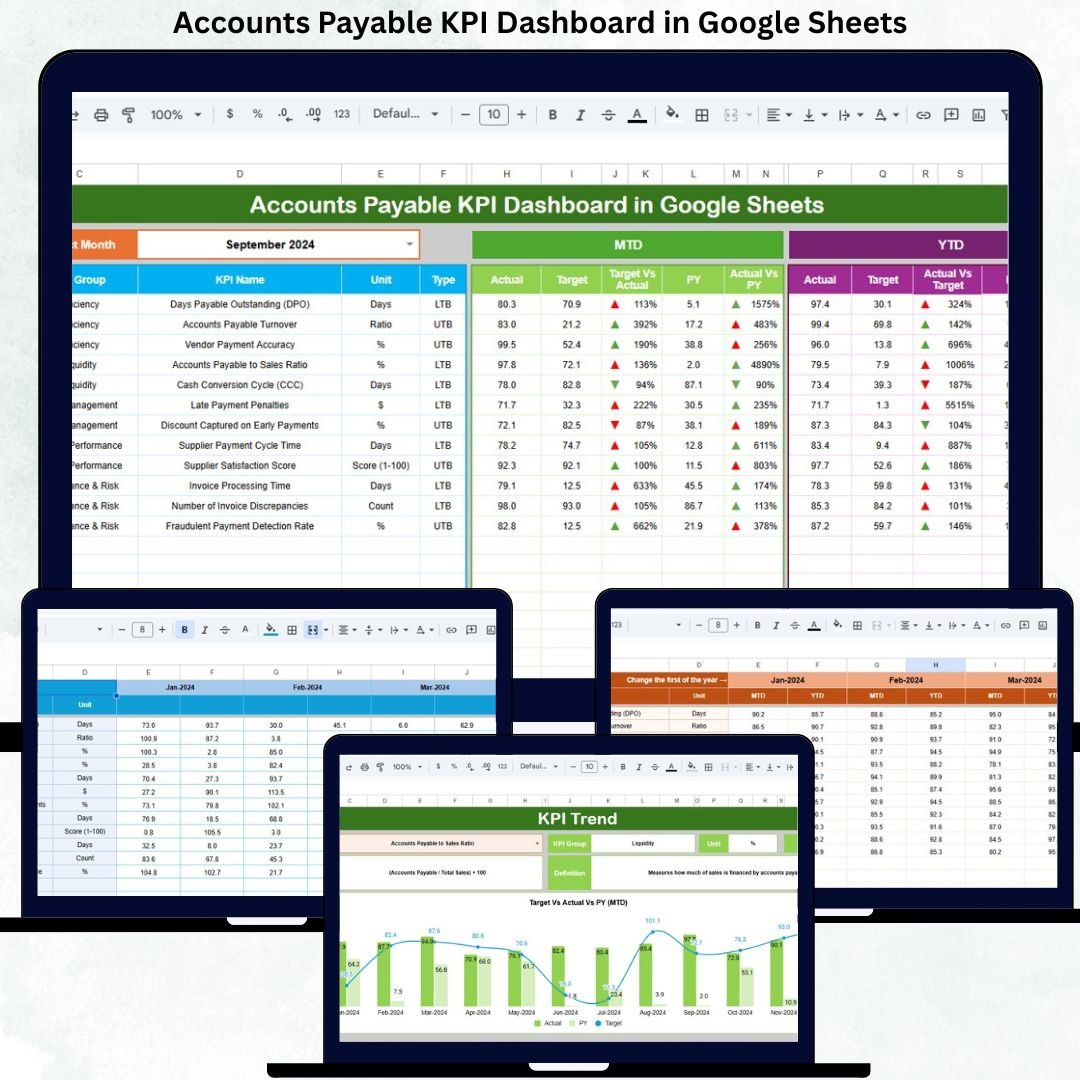
Efficient accounts payable management plays a vital role in maintaining healthy cash flow, strong vendor relationships, and financial discipline. When invoices are processed late, payments are missed, or data is scattered across spreadsheets, organizations face penalties, supplier dissatisfaction, and poor visibility into liabilities. The Accounts Payable KPI Dashboard in Google Sheets eliminates these challenges by providing a structured, automated, and real-time performance monitoring system for finance teams.
This ready-to-use dashboard transforms raw AP data into clear KPIs, comparisons, and trend insights. Instead of manually preparing reports, finance teams simply update actuals and select a month—everything else updates automatically. Because it runs on Google Sheets, the dashboard is cloud-based, collaborative, cost-effective, and easy to maintain without any technical complexity.
✨ Key Features of the Accounts Payable KPI Dashboard in Google Sheets
📊 1. Automated MTD & YTD KPI Tracking
Track Month-to-Date and Year-to-Date performance for all AP KPIs. With a simple month selection, the dashboard instantly updates actuals, targets, and previous-year comparisons.
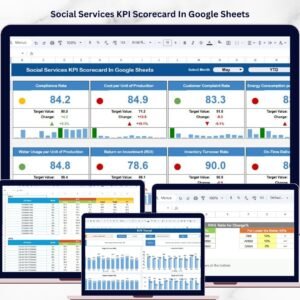
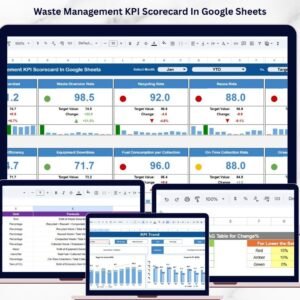
📈 2. Target vs Actual & YOY Comparisons
Every KPI includes comparisons against targets and last year’s performance. Conditional formatting arrows highlight improvements and problem areas instantly.
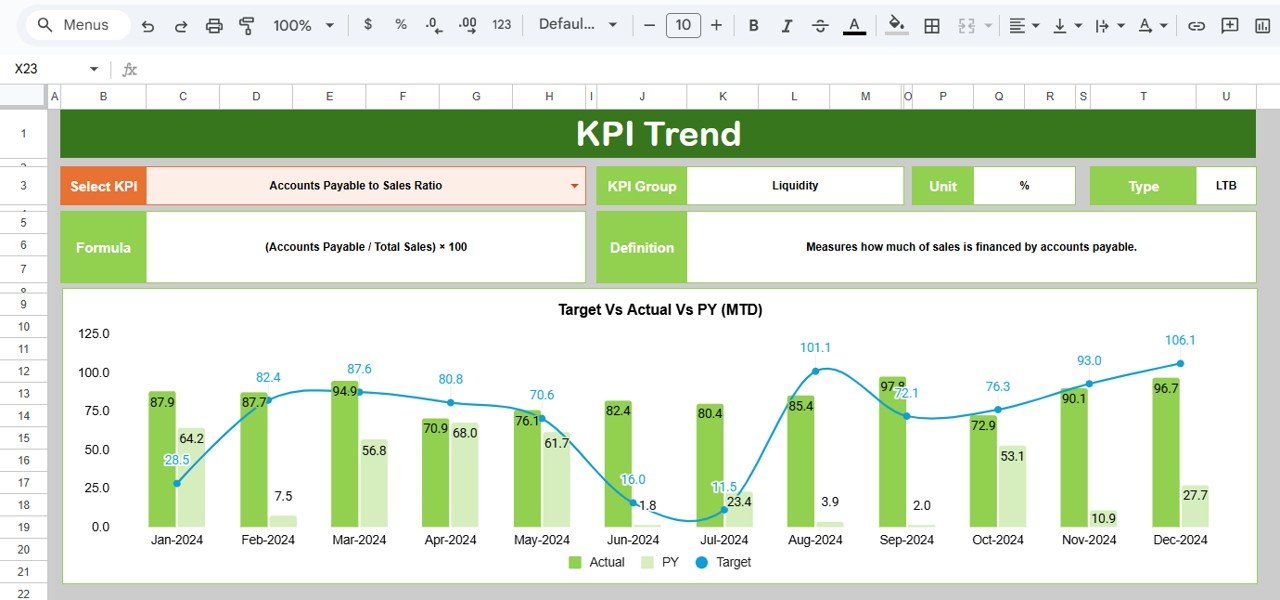
📉 3. Trend Analysis for Individual KPIs
Analyze month-wise behavior of any KPI using the KPI Trend Sheet. This helps identify seasonal delays, long-term improvements, or recurring issues.
📘 4. Structured & Clean Worksheet Design
Six well-defined worksheets ensure clean data flow, consistent calculations, and accurate reporting—ideal for audits and reviews.
🌐 5. Cloud-Based Collaboration
Multiple users can update and review data in real time using Google Sheets’ built-in sharing and access controls.
📦 What’s Inside the Accounts Payable KPI Dashboard in Google Sheets
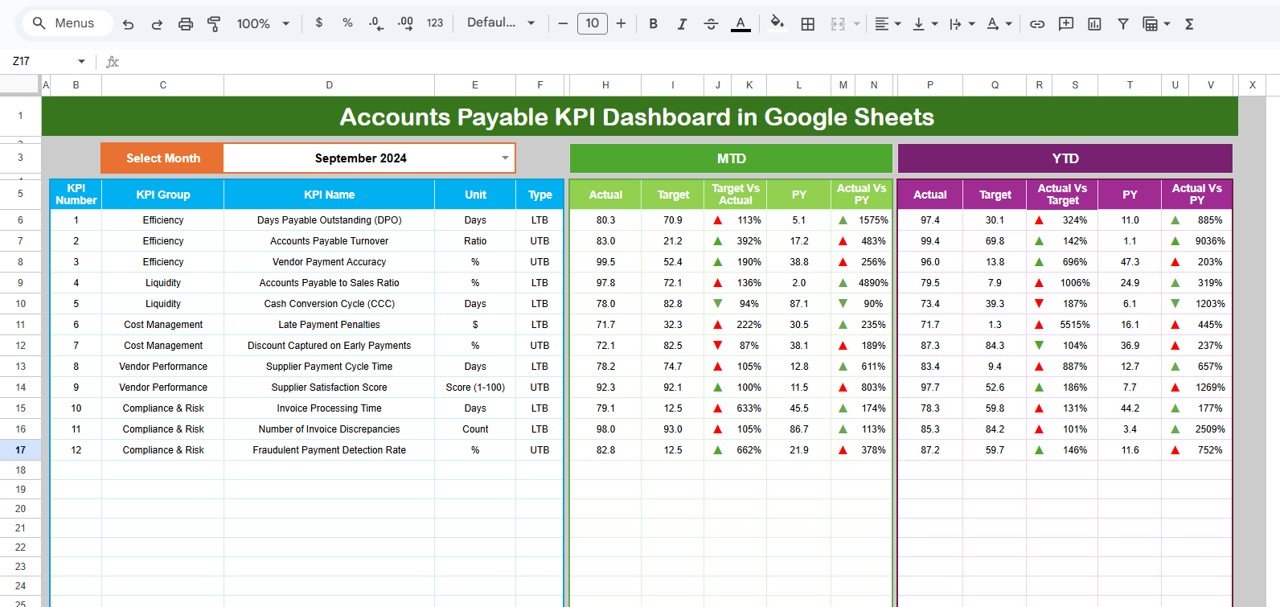
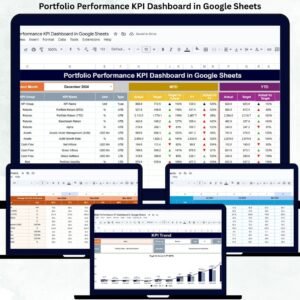
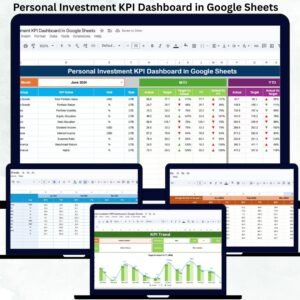
🖥️ Dashboard Sheet Tab (Main Page)
This is the control center of the dashboard. Users select the month from cell D3, and all KPIs update automatically.
Displayed metrics include:
-
MTD Actual, Target & Previous Year
-
MTD Target vs Actual & PY vs Actual
-
YTD Actual, Target & Previous Year
-
YTD Target vs Actual & PY vs Actual
Visual indicators make interpretation simple:
-
🟢 Green arrow → Improvement
-
🔴 Red arrow → Decline
Finance leaders can assess AP health in seconds.
📈 KPI Trend Sheet Tab
Select any KPI from the dropdown in cell C3 to view:
-
KPI Group
-
Unit of Measurement
-
KPI Type (LTB / UTB)
-
Formula
-
KPI Definition
This sheet supports detailed analysis, audits, and management discussions.
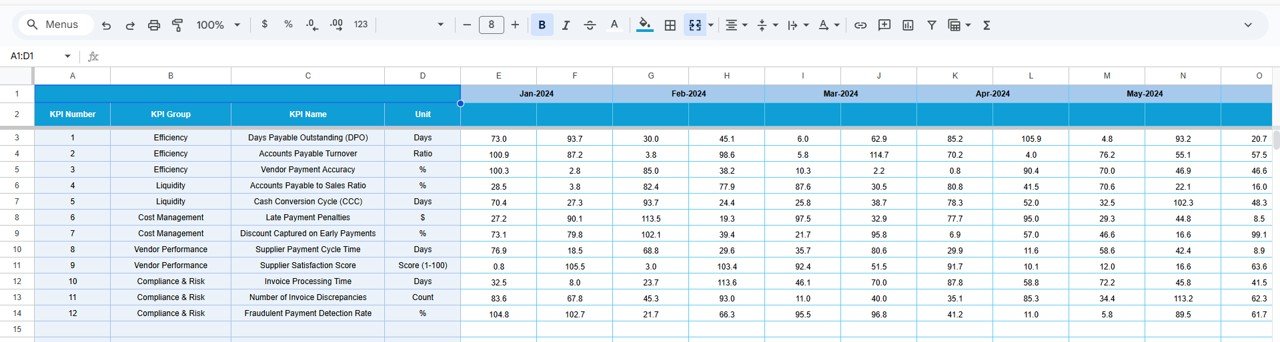
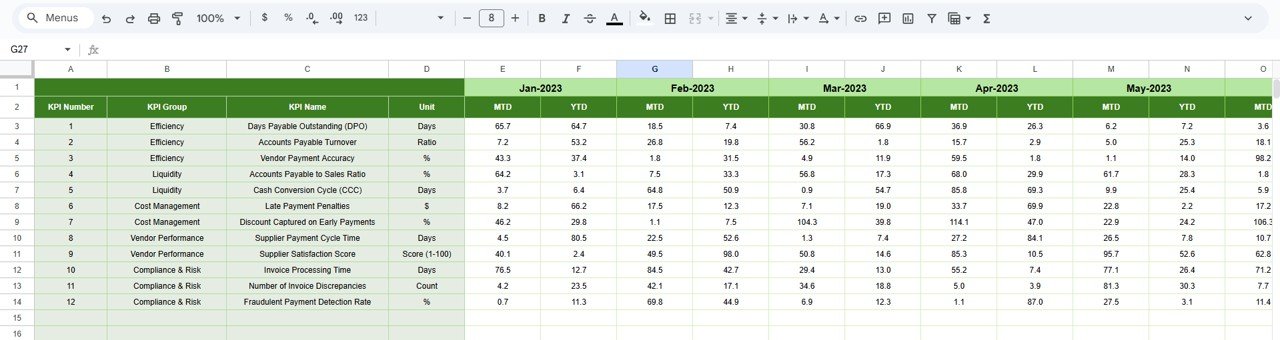
📋 Actual Number Sheet Tab
Enter MTD and YTD actual values here. The financial year setup is controlled using cell E1. Once data is entered, the dashboard refreshes automatically.
🎯 Target Sheet Tab
Define monthly and yearly targets for each KPI. These targets help drive accountability, efficiency, and continuous improvement.
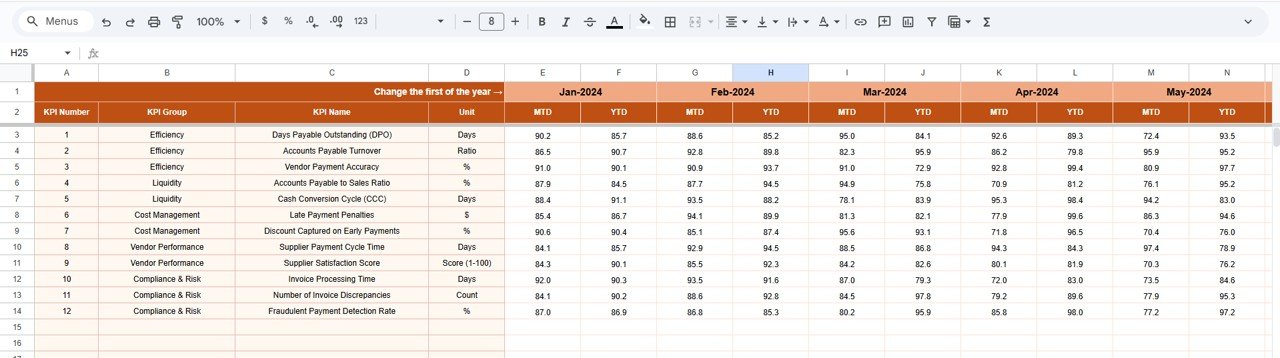
📆 Previous Year Number Sheet Tab
Stores last year’s AP data to enable accurate year-over-year analysis and performance benchmarking.
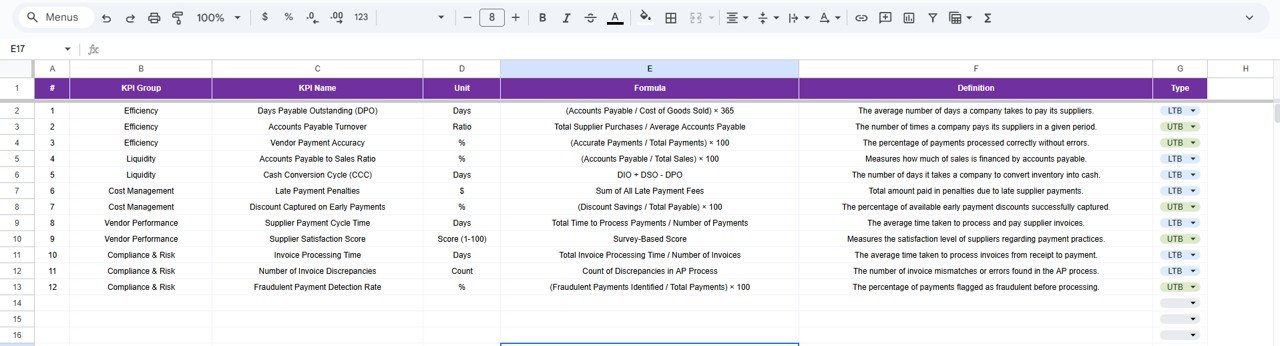
📘 KPI Definition Sheet Tab
A master reference sheet containing:
-
KPI Name
-
KPI Group
-
Unit
-
Formula
-
KPI Definition
-
KPI Type
This ensures consistency and clarity across the finance team.
🛠️ How to Use the Accounts Payable KPI Dashboard in Google Sheets
1️⃣ Update Actual Invoice Data Regularly
Enter new MTD and YTD values weekly or monthly.
2️⃣ Set Clear Targets
Targets guide performance improvement and payment discipline.
3️⃣ Select the Month to Refresh KPIs
One dropdown refreshes the entire dashboard.
4️⃣ Review Trends & Variances
Use KPI Trend and variance views to identify issues early.
5️⃣ Compare with Previous Year Performance
YOY insights help measure long-term improvement.
🎯 Who Can Benefit from This Accounts Payable KPI Dashboard
💼 Accounts Payable Teams
Improve invoice processing speed and reduce errors.
📊 Finance Managers & Controllers
Gain real-time visibility into liabilities and payment efficiency.
🏢 CFOs & Leadership Teams
Monitor cash flow impact and vendor payment performance.
📋 Audit & Compliance Teams
Use structured KPI data for reviews and audits.
🚀 Growing Businesses & Enterprises
Scale AP operations with clarity and control.
### Click here to read the Detailed blog post
Watch the step-by-step video tutorial:


Reviews
There are no reviews yet.