

Retail KPIs are the measured numbers that tell you whether a store is healthy: sales per square foot, GMROI, inventory turnover, sell-through, conversion rate and shrinkage. Track these 12 monthly, hold each to a benchmark range, and you catch margin leaks before they become markdowns.
Last updated: September 2026
Key takeaways
- The 12 retail KPIs every operator should track split into three groups: sales productivity (sales per sq ft, ATV, UPT, conversion), inventory health (GMROI, turnover, sell-through, stock-to-sales, shrinkage) and growth (gross margin %, comp-store sales, retention).
- GMROI above 1.0 means an inventory category earns more than it costs to carry; healthy specialty retail runs 2.0–4.0.
- US brick-and-mortar shrinkage averages about 1.6% of sales (National Retail Federation) — anything over 2% needs investigation, not acceptance.
- The best-value option here is the Retail & Store Analytics Bundle at $65.99 — 8 Excel and Google Sheets templates that calculate all 12 KPIs out of the box.
- The single most common mistake across every KPI is comparing a number to another store instead of to your own trailing 12 months — the trend beats the benchmark.
Retail KPI dashboard templates compared
| Template | Format | Best for | Price |
|---|---|---|---|
| Retail & Store Analytics Bundle (Best value) | Excel + Google Sheets | Every KPI in one purchase, 8 templates | $65.99 |
| Retail KPI Dashboard in Excel (Best overall) | Excel | A single store or manager who lives in Excel | $14.99 |
| Omnichannel Retail KPI Dashboard in Excel | Excel | Blending store + online channels | $14.99 |
| Retail KPI Dashboard in Power BI | Power BI | Interactive filtering across many stores | $11.99 |
| Luxury Retail KPI Dashboard in Power BI | Power BI | High-AOV, low-volume boutiques | $11.99 |
| Retail KPI Dashboard in Google Sheets | Google Sheets | Free, cloud, share-a-link teams | $9.99 |
| Hardware Store POS Web App | Web App | Capturing the transaction data itself | $39.99 |
| General Store POS Web App | Web App | General retail POS + reporting | $39.99 |
Prices shown in USD and current at the time of writing. Every template is a one-time purchase with no subscription.
How we picked these
We searched the full NextGenTemplates catalogue of 150+ retail and analytics products and kept only templates that calculate the KPIs in this guide directly, without a paid add-on. We prioritised multi-format coverage — Excel, Google Sheets, Power BI and a live POS web app — so a reader can pick the tool their team already uses.
We excluded single-industry dashboards (furniture, baby products, duty-free) even though they are well built, because this guide is about the universal retail KPIs rather than one vertical. We also excluded free templates: a store’s numbers are worth protecting, and the paid templates here ship with the formulas, validation and refresh macros already wired up.
The 12 retail KPIs to track in 2026
Each KPI below gives you a one-sentence definition, the exact formula, a realistic benchmark range and the single mistake that most retail teams make with it. Track all 12 on a monthly cadence; the templates in the next section calculate every one of them for you.
Quick-reference metric table
| Metric | Formula | Benchmark range | Where to see it |
|---|---|---|---|
| Sales per square foot | Net sales ÷ selling area (sq ft) | $300–$400 avg; $1,000+ top tier | Retail KPI Dashboard (Excel) |
| GMROI | Gross margin $ ÷ average inventory cost | 2.0–4.0 healthy; >1.0 minimum | Retail & Store Analytics Bundle |
| Inventory turnover | COGS ÷ average inventory at cost | 4–6x general; 12–15x grocery | Retail KPI Dashboard (Power BI) |
| Sell-through rate | Units sold ÷ units received × 100 | 40–80% per season | Retail & Store Analytics Bundle |
| Conversion rate | Transactions ÷ foot traffic × 100 | 20–40% in-store; 2–3% online | Omnichannel Retail KPI Dashboard |
| Average transaction value | Total revenue ÷ transactions | Track trend, category-specific | Retail KPI Dashboard (Google Sheets) |
| Units per transaction | Units sold ÷ transactions | 1.5–3.0 typical | Retail KPI Dashboard (Excel) |
| Shrinkage rate | (Book inventory − actual) ÷ sales × 100 | ~1.6% of sales | Retail & Store Analytics Bundle |
| Gross margin % | (Revenue − COGS) ÷ revenue × 100 | 25–50% retail | Retail KPI Dashboard (Excel) |
| Comparable-store sales growth | (Comp sales − LY comp sales) ÷ LY × 100 | +2–5% healthy | Retail KPI Dashboard (Power BI) |
| Customer retention rate | ((End − new) ÷ start) × 100 | 60–75% retail | Luxury Retail KPI Dashboard |
| Stock-to-sales ratio | Beginning-of-month stock ÷ month sales | Set by open-to-buy plan | Retail & Store Analytics Bundle |
1. Sales per square foot
Definition: How much revenue each square foot of selling space generates over a period.
Formula: Net sales ÷ total selling area in square feet.
Benchmark: The US average sits around $300–$400 per square foot; strong specialty retailers clear $600, and the very best (jewellery, electronics) pass $1,000.
The mistake teams make: Including stockroom, offices and back-of-house in the area. Sales per square foot should use selling floor only, or the number is meaninglessly low and you cannot compare stores of different layouts.
2. Gross margin return on investment (GMROI)
Definition: How many gross-margin dollars you earn for every dollar tied up in inventory.
Formula: Gross margin dollars ÷ average inventory cost.
Benchmark: Above 1.0 means the category earns more than it costs to hold; healthy specialty retail runs 2.0–4.0, while high-volume grocery lives nearer 1.5.
The mistake teams make: Using the retail value of inventory instead of its cost. GMROI is a cost-basis ratio; mixing retail value in overstates it wildly and hides slow, cash-trapping stock.
3. Inventory turnover
Definition: How many times you sell and replace your entire inventory in a period.
Formula: Cost of goods sold ÷ average inventory at cost.
Benchmark: General retail turns 4–6 times a year; grocery and fast-moving consumer goods turn 12–15; apparel often sits at 2–4.
The mistake teams make: Comparing turnover across categories with different margins. A low-turn, high-margin luxury line can be more profitable than a fast-turn commodity — always read turnover alongside GMROI.
4. Sell-through rate
Definition: The share of received stock you sold within a defined window.
Formula: Units sold ÷ units received × 100, measured over a fixed period.
Benchmark: 40–80% over a season is normal; consistently above 80% can mean you under-ordered and left sales on the table.
The mistake teams make: Measuring lifetime sell-through instead of a fixed window (say the first four weeks). Without a window you cannot tell a fast seller from a slow one that eventually cleared on markdown.
5. Conversion rate
Definition: The percentage of visitors who actually buy.
Formula: Transactions ÷ foot traffic (or online visitors) × 100.
Benchmark: Physical stores convert 20–40%; specialty and appointment retail higher; ecommerce sits at 2–3%.
The mistake teams make: Comparing in-store conversion to online conversion as if they were the same metric. They are not — a browser walking past a window is not a checkout session. Track them separately, which is exactly what an omnichannel retail KPI dashboard is built to do.
6. Average transaction value (ATV)
Definition: The average dollar amount of a single sale, also called average basket size.
Formula: Total revenue ÷ number of transactions.
Benchmark: Highly category-specific; the useful signal is the trend against your own trailing months, not another store’s figure.
The mistake teams make: Confusing ATV (dollars) with units per transaction (units). They move for different reasons — ATV rises with upsell and price, UPT rises with cross-sell and bundling.
7. Units per transaction (UPT)
Definition: The average number of items in each sale.
Formula: Total units sold ÷ number of transactions.
Benchmark: 1.5–3.0 is typical; anything above 2.0 signals strong cross-selling and merchandising.
The mistake teams make: Letting returns quietly inflate UPT. If a customer buys five and returns three, the honest UPT is net of returns — otherwise you reward the wrong basket behaviour.
8. Shrinkage rate
Definition: Inventory lost to theft, error and fraud, expressed against sales.
Formula: (Book inventory − physically counted inventory) ÷ total sales × 100.
Benchmark: The National Retail Federation puts average shrink near 1.6% of sales; above 2% warrants a real investigation.
The mistake teams make: Assuming shrink is all theft. A large share is administrative error and supplier fraud — fixing receiving and cycle-count discipline often recovers more than security cameras do.
9. Gross margin %
Definition: The share of revenue left after the cost of the goods you sold.
Formula: (Revenue − COGS) ÷ revenue × 100.
Benchmark: General retail runs 25–50%; grocery is thinner; apparel and specialty higher.
The mistake teams make: Confusing markup with margin. A 50% markup on cost is only a 33% margin — pricing off the wrong one silently erodes profit on every ticket.
10. Comparable-store (same-store) sales growth
Definition: Sales growth from stores open at least a full year, stripping out new openings.
Formula: (This period’s comp sales − last year’s comp sales) ÷ last year’s comp sales × 100.
Benchmark: Positive 2–5% is healthy organic growth; flat-to-negative comps mean the existing base is softening.
The mistake teams make: Including new-store revenue, which inflates the number and hides weakness in the mature base. Comp sales only count stores open 12+ months.
11. Customer retention rate
Definition: The percentage of existing customers you keep over a period.
Formula: ((Customers at end − new customers acquired) ÷ customers at start) × 100.
Benchmark: Retail retention typically lands 60–75%; loyalty-driven and luxury brands run higher.
The mistake teams make: Measuring retention without a defined period. “Retention” over an undefined span is a vanity number; pick a month or quarter and hold to it.
12. Stock-to-sales ratio
Definition: How much inventory you carry relative to the sales it supports.
Formula: Beginning-of-month inventory value ÷ that month’s sales.
Benchmark: Set by your open-to-buy plan rather than a universal number; the point is to keep it stable and planned.
The mistake teams make: Using end-of-month stock, which misaligns with open-to-buy budgeting. The ratio is a beginning-of-month planning figure.
The 8 best retail KPI templates for 2026
Knowing the formulas is half the job; the other half is a dashboard that pulls them every month without you rebuilding it. Here are the eight NextGenTemplates dashboards that calculate these retail KPIs, ranked. Number one is the bundle because it is the only option that covers all 12 KPIs across both Excel and Google Sheets in a single purchase.
1. Retail & Store Analytics Bundle — best overall & best value

What it is: A pack of 8 premium retail templates in Excel and Google Sheets — sales, inventory, store analytics and KPI dashboards bundled together.
Who it is for: An operator who wants every KPI in this guide calculated in one purchase rather than stitching single dashboards together.
- Covers all 12 retail KPIs: turnover, GMROI, sell-through, shrinkage and more.
- Ships in both Excel and Google Sheets, so store and head office can each use their tool.
- Pre-built formulas and refresh macros — paste your sales export and the numbers populate.
- Inventory management sheet feeds the KPI dashboard automatically.
A 3-store chain using the bundle can drop monthly POS exports into the inventory sheet and read GMROI, turnover and sales per square foot side by side in minutes rather than rebuilding a spreadsheet each period. Price: $65.99. Get the Retail & Store Analytics Bundle →
Best for: Anyone who wants the whole retail KPI toolkit in one buy.
2. Retail KPI Dashboard in Excel — best single dashboard
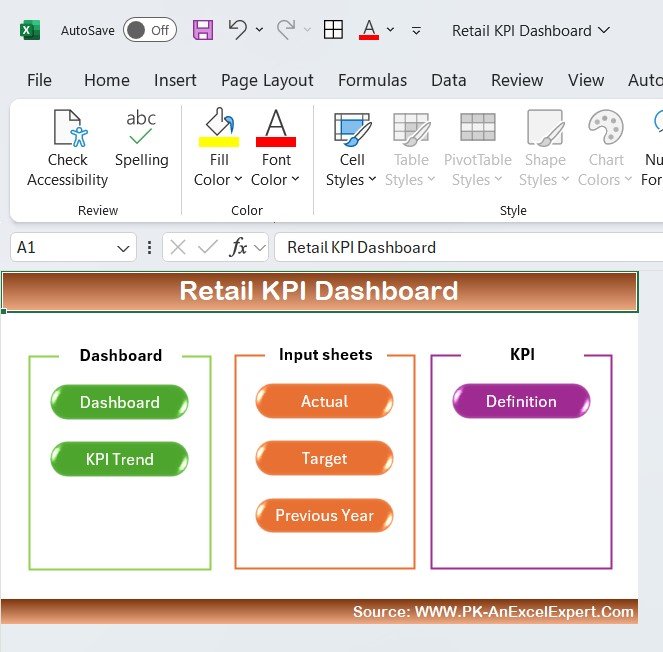
What it is: A single-file Excel dashboard with dashboard, KPI-trend and input sheets wired to a definition table.
Who it is for: A single store or a manager who wants their retail KPIs in the tool they already know.
- Sales per square foot, ATV, UPT, gross margin % and conversion on one page.
- Actual-versus-target inputs drive traffic-light status automatically.
- KPI-trend sheet charts each metric month over month.
Enter this month’s actuals and targets and the dashboard flags which KPIs are below plan — a manager can spot a slipping conversion rate before the quarter closes. Price: $14.99. Buy the Retail KPI Dashboard in Excel →
Best for: One store, one operator, all core KPIs.
3. Omnichannel Retail KPI Dashboard in Excel — best for online + store
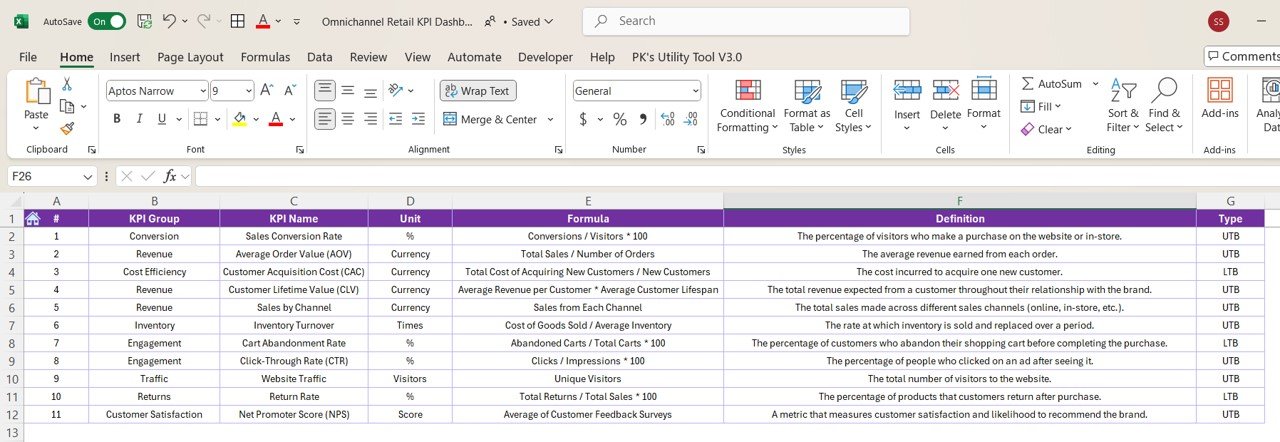
What it is: An Excel KPI dashboard built to separate and combine store and ecommerce channels.
Who it is for: Retailers selling through both a physical store and an online storefront.
- Keeps in-store conversion (20–40%) and online conversion (2–3%) as distinct metrics.
- Blended and per-channel revenue, margin and basket-size views.
- Channel-mix reporting so you see where growth is really coming from.
Price: $14.99. Get the Omnichannel Retail KPI Dashboard →
Best for: Blending store and online without double-counting.
4. Retail KPI Dashboard in Power BI — best for multi-store filtering

What it is: An interactive Power BI report with slicers for store, category and period.
Who it is for: Chains and analysts who want to filter KPIs across many stores at once.
- Slice turnover, comp-store growth and margin by store or region instantly.
- Refreshes from a data model rather than manual paste.
- Drill from company total down to a single location.
Price: $11.99. Buy the Retail KPI Dashboard in Power BI →
Best for: Interactive analysis across a store network.
5. Luxury Retail KPI Dashboard in Power BI — best for high-AOV boutiques
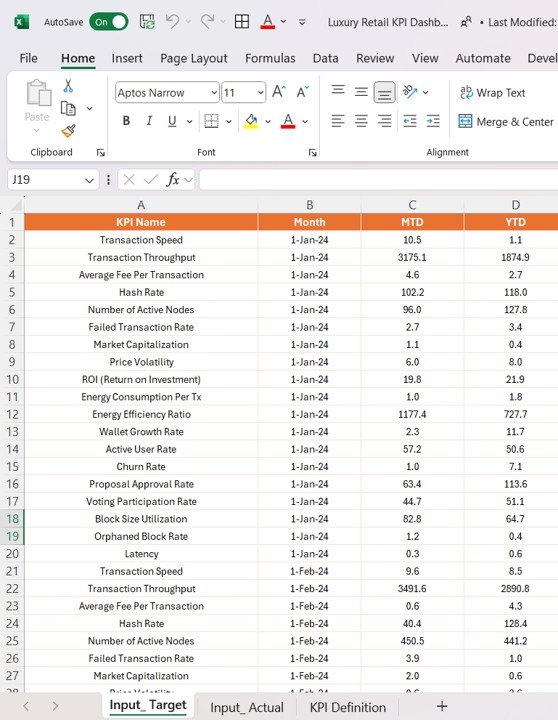
What it is: A Power BI dashboard tuned for low-volume, high-value luxury retail.
Who it is for: Boutiques where retention and ATV matter more than raw footfall.
- Foregrounds average transaction value, retention and clienteling metrics.
- Handles low transaction counts without noisy conversion swings.
- Margin and full-price sell-through focus rather than markdown volume.
Price: $11.99. Get the Luxury Retail KPI Dashboard →
Best for: High-value, relationship-driven retail.
6. Retail KPI Dashboard in Google Sheets — best free-cloud option

What it is: The core retail KPI dashboard rebuilt natively in Google Sheets.
Who it is for: Teams that live in Google Workspace and want to share a live link.
- No software cost beyond a Google account.
- Real-time collaboration and mobile access.
- Same core KPIs: turnover, margin, ATV, conversion, sell-through.
Price: $9.99. Buy the Retail KPI Dashboard in Google Sheets →
Best for: Cloud-first, share-a-link teams.
7. Hardware Store POS Web App — best for capturing the data
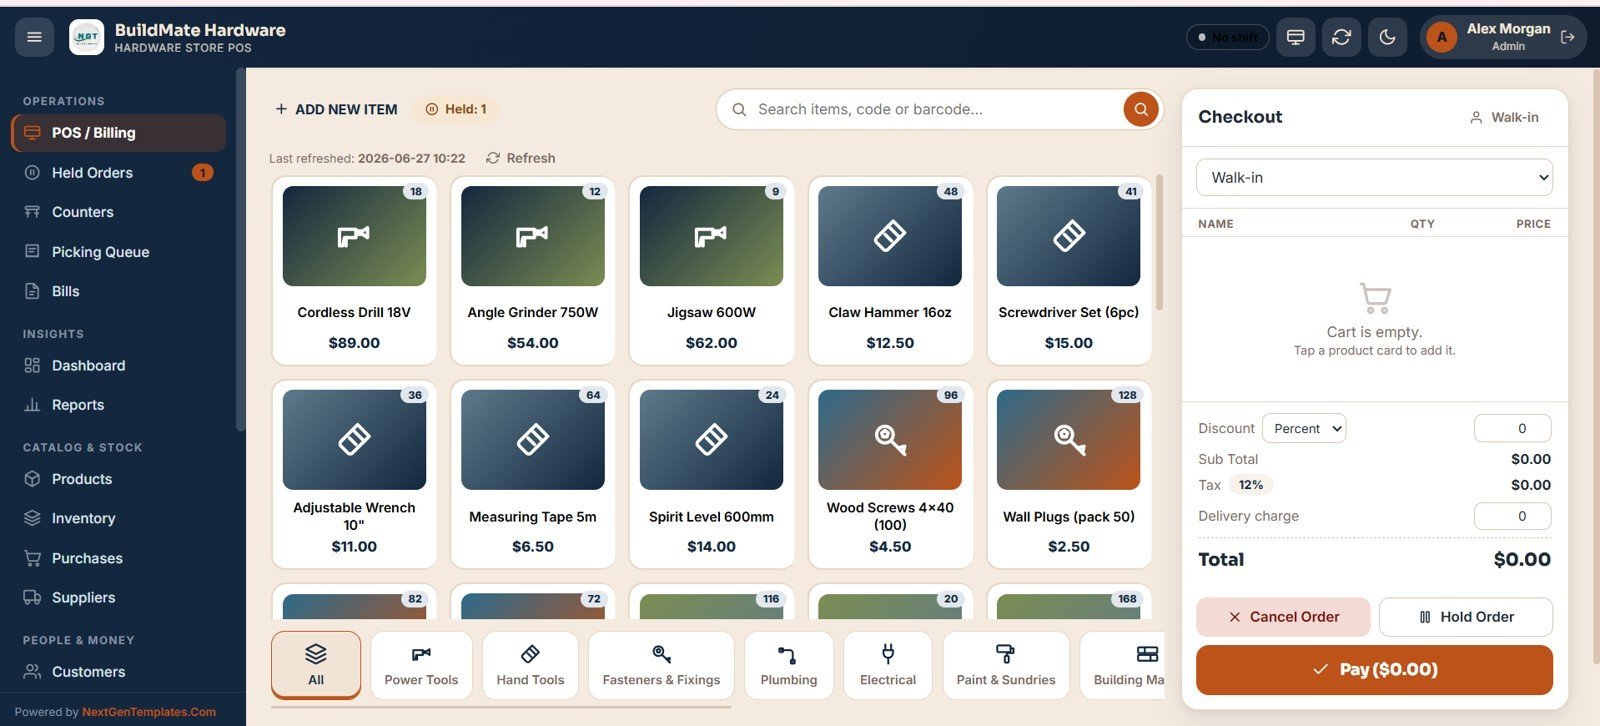
What it is: A point-of-sale web application that records every hardware-store sale at source.
Who it is for: Hardware and building-supply stores that need the raw transactions before any KPI exists.
- Captures transactions, units and margin that feed ATV, UPT and turnover.
- Built-in sales and inventory reporting.
- Runs in the browser — no install.
Price: $39.99. Get the Hardware Store POS Web App →
Best for: Generating clean data a KPI dashboard can read.
8. General Store POS Web App — best all-round POS
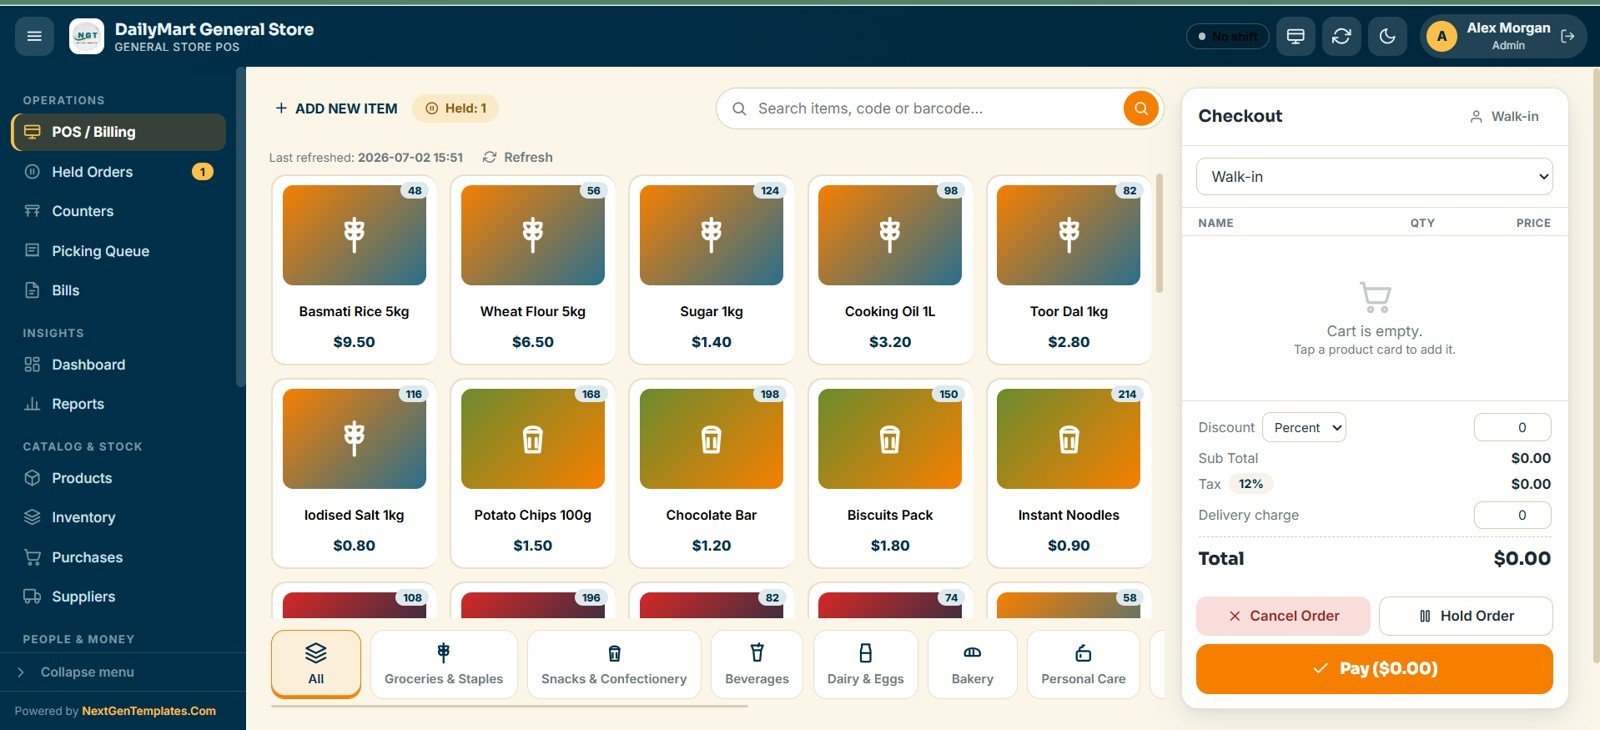
What it is: A general-purpose retail POS web app with billing, inventory and reporting.
Who it is for: General retail stores that want POS and basic KPI reporting in one browser tool.
- Records sales and stock movements that drive shrinkage and turnover.
- Daily and monthly sales summaries out of the box.
- Feeds cleanly into any of the KPI dashboards above.
Price: $39.99. Buy the General Store POS Web App →
Best for: General retail POS plus first-pass reporting.
How to choose between them
| If you… | Choose |
|---|---|
| Want every KPI in one purchase | Retail & Store Analytics Bundle ($65.99) |
| Run one store and live in Excel | Retail KPI Dashboard in Excel ($14.99) |
| Sell in-store and online | Omnichannel Retail KPI Dashboard ($14.99) |
| Manage many stores interactively | Retail KPI Dashboard in Power BI ($11.99) |
| Run a high-value boutique | Luxury Retail KPI Dashboard ($11.99) |
| Work entirely in Google Workspace | Retail KPI Dashboard in Google Sheets ($9.99) |
| Still need to capture the sales data | Hardware or General Store POS Web App ($39.99) |
If you are unsure, start with the bundle: it is cheaper than buying three single dashboards and it future-proofs you as new KPIs become relevant. For related metric sets, see our guides to store analytics, profitability KPIs and sales KPIs.
When a KPI template is NOT the right answer
A spreadsheet dashboard is the right tool for measuring and reviewing retail KPIs, but it is the wrong tool in three situations, and being honest about them saves you a refund:
- You need real-time inventory across dozens of stores. A monthly Excel or Google Sheets dashboard reports the past; live multi-store stock control belongs in a dedicated retail ERP, not a template.
- You have no clean transaction data yet. KPIs are only as good as their inputs. If sales are still on paper, start with a POS web app to capture the data first, then layer a dashboard on top.
- You want automated alerting and forecasting. Predictive replenishment and anomaly alerts need a BI platform with scheduled refresh and models — the Power BI dashboards get you part way, but not to full automation.
For everyone else — a single store, a small chain, a boutique, an online-plus-store operator — a well-built template is faster to deploy and far cheaper than software, and it makes the KPIs in this guide visible from month one.
Frequently asked questions
What are the most important retail KPIs to track?
The core retail KPIs are sales per square foot, GMROI, inventory turnover, sell-through rate, conversion rate and gross margin %. These six cover sales productivity, inventory health and profitability. Add shrinkage, ATV, UPT, comp-store sales, retention and stock-to-sales for a complete monthly picture.
How do you calculate GMROI for a retail store?
Divide your gross margin dollars by your average inventory at cost. For example, $80,000 gross margin on $40,000 average inventory cost gives a GMROI of 2.0, meaning every dollar in inventory returns two dollars of margin. Always use inventory cost, not its retail value.
What is a good inventory turnover ratio for retail?
General retail turns inventory 4–6 times a year, grocery and fast-moving goods 12–15 times, and apparel typically 2–4 times. Read turnover alongside GMROI: a low-turn, high-margin category can be more profitable than a fast-turning commodity line.
What is the average shrinkage rate in retail?
US retail shrinkage averages around 1.6% of sales according to the National Retail Federation. Anything above 2% signals a problem worth investigating. Remember that shrink is not only theft — administrative error and supplier fraud make up a large share.
What is a good conversion rate for a retail store?
Physical stores typically convert 20–40% of visitors into buyers, with specialty and appointment retail running higher. Online retail converts far lower, at 2–3%. Never compare the two directly — in-store footfall and website visitors are different denominators.
What is the difference between markup and margin?
Markup is the amount added to cost, expressed against cost; margin is profit expressed against the selling price. A 50% markup on a $10 cost gives a $15 price but only a 33% gross margin. Pricing off markup while reporting margin is a common, costly error.
How often should I review my retail KPIs?
Review core retail KPIs monthly, with a weekly glance at sales, conversion and sell-through during peak seasons. Monthly is frequent enough to act before markdowns while avoiding the noise of daily swings. The dashboards in this guide are built around a monthly actual-versus-target cadence.
Do I need Excel or Power BI for retail KPI tracking?
Use Excel or Google Sheets for a single store or small chain — they are fast to deploy and easy to edit. Choose Power BI when you need to filter KPIs interactively across many stores or refresh from a data model. The bundle includes Excel and Google Sheets versions so you are not locked in.
What is comparable-store (same-store) sales growth?
Comp-store sales growth measures revenue change from stores open at least 12 months, excluding new openings. It isolates organic performance of the mature base. Positive 2–5% is healthy; including new stores inflates the figure and hides softness in existing locations.
Can these retail KPI templates work for an online-only store?
Yes for the profitability and inventory KPIs — margin, turnover, GMROI, ATV and retention all apply. The Omnichannel Retail KPI Dashboard is the best fit because it treats online conversion (2–3%) as its own metric rather than forcing it onto in-store benchmarks.
Selling vehicles rather than general merchandise? Our ranked list of the 8 best car dealership dashboard templates for 2026 applies these retail KPIs to automotive sales, F&I and used-car turn.
Get more retail KPI templates
The fastest way to put all 12 of these retail KPIs on one screen is the Retail & Store Analytics Bundle for $65.99 — eight Excel and Google Sheets templates that calculate every metric in this guide. Prefer a single tool? Start with the Retail KPI Dashboard in Excel ($14.99) or the Google Sheets version ($9.99).
For more ready-made dashboards, browse our retail and e-commerce dashboard templates, and see the metric guides for marketing KPIs and customer service KPIs. Watch build walkthroughs on our YouTube channel, NextGenTemplates.