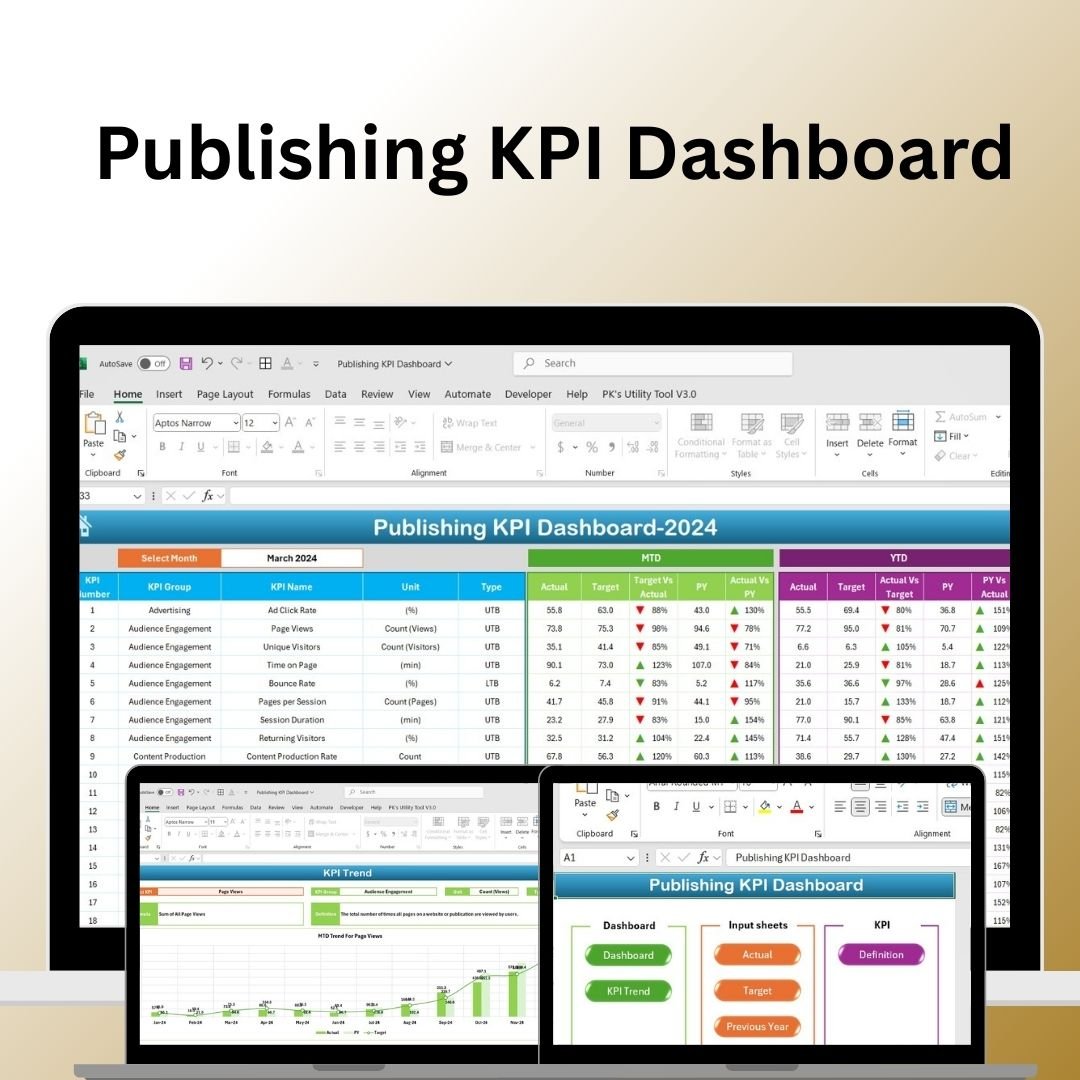

The Publishing KPI Dashboard in Excel is an essential tool for businesses in the publishing industry, including publishers, editors, content creators, and marketing teams. Whether you’re tracking book sales, magazine subscriptions, content engagement, or ad revenue, this comprehensive dashboard helps you monitor and analyze all key performance indicators (KPIs) related to your publishing business.
With dynamic charts, real-time data updates, and customizable features, this Excel-based dashboard allows publishing professionals to make data-driven decisions, optimize revenue, and improve audience engagement. It’s an invaluable tool for improving efficiency and profitability while streamlining your operations.
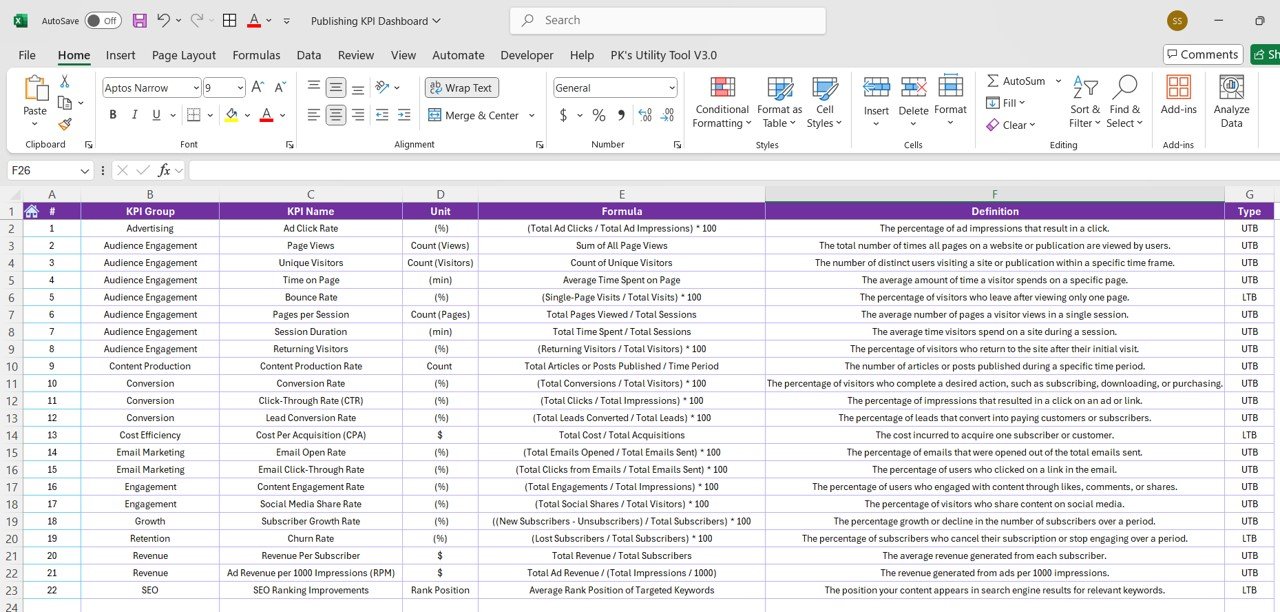
Key Features of the Publishing KPI Dashboard in Excel:
📊 Comprehensive KPI Tracking
Track crucial KPIs such as content engagement, subscriptions, revenue generation, and customer acquisition—all in one dashboard.
📈 Real-Time Performance Monitoring
Monitor sales, subscriptions, ad performance, and content engagement metrics in real time, providing you with instant insights into how your content and business are performing.
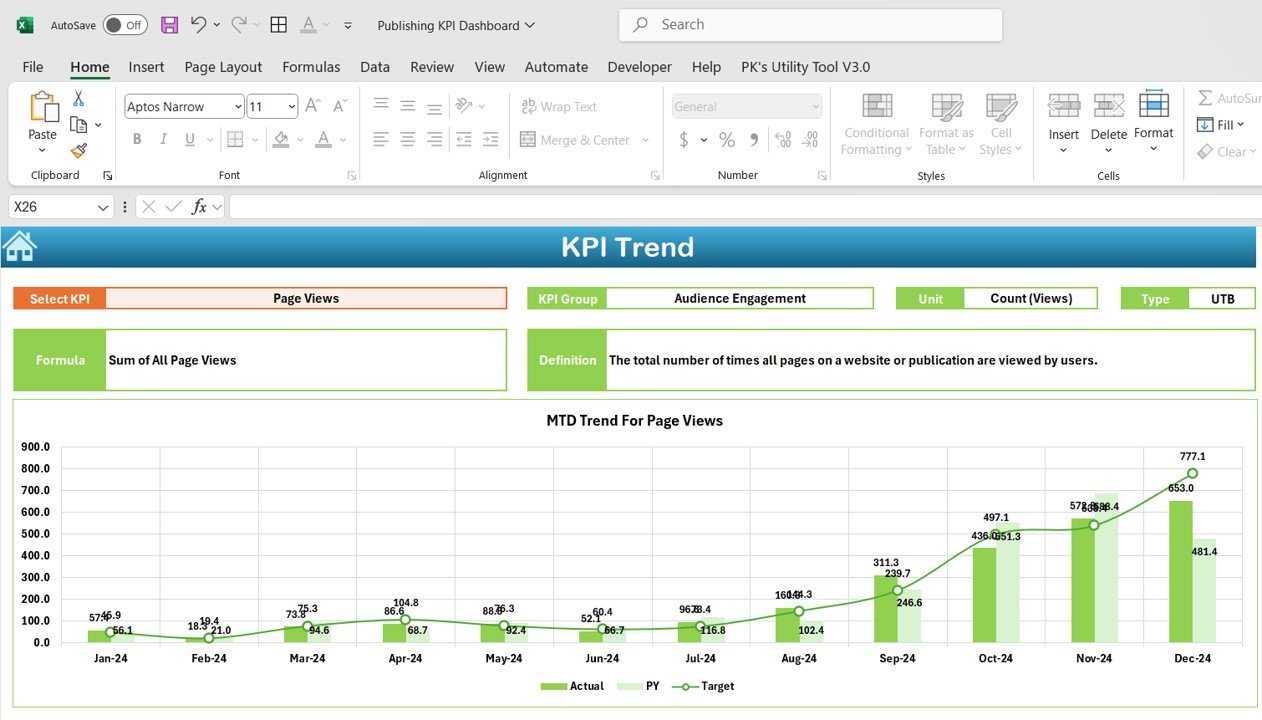
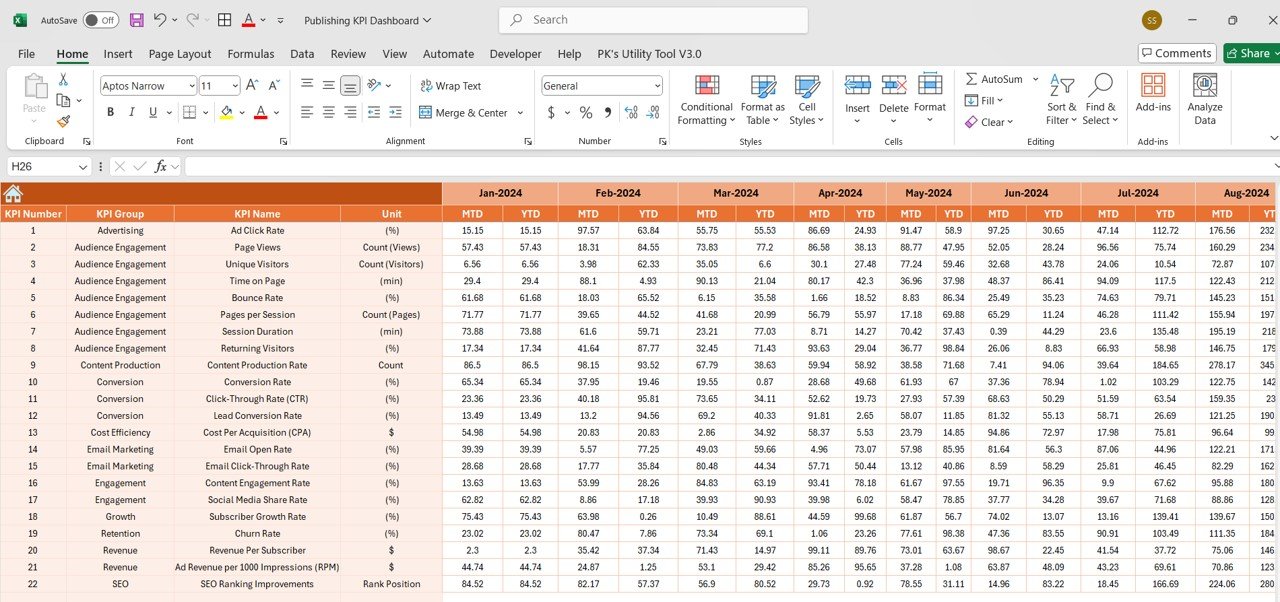
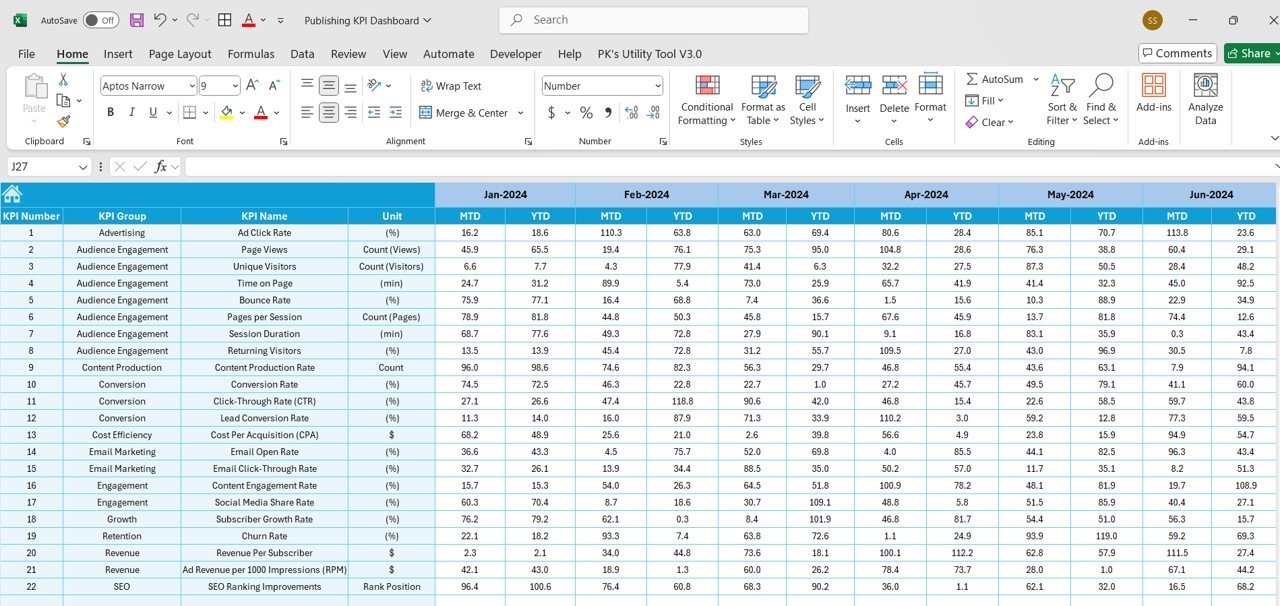
📅 Month-to-Date (MTD) and Year-to-Date (YTD) Tracking
Track your publishing performance across different periods, comparing current data to historical performance to identify trends and opportunities for growth.
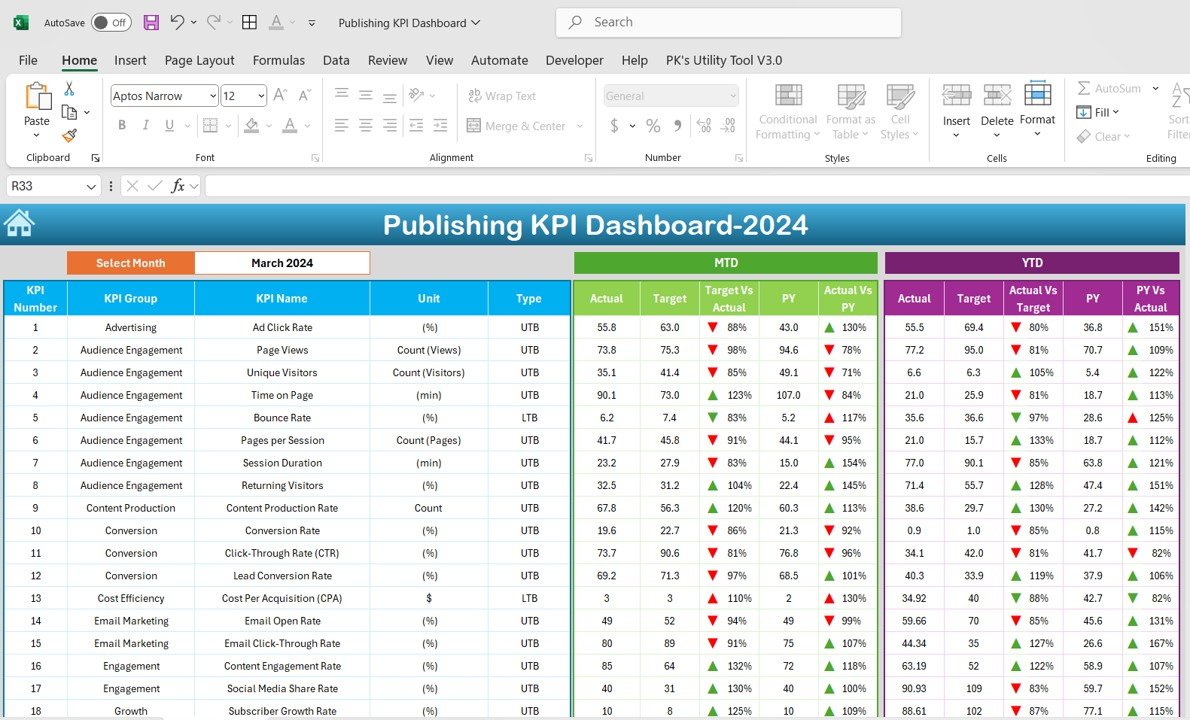
🎯 Goal Setting and Performance Comparison
Set specific targets for each KPI and compare actual performance against those targets, ensuring that your publishing operations are aligned with your business goals.
🛠 Customizable Inputs
Easily input data such as content views, subscription rates, ad revenues, and sales figures, while customizing the dashboard to suit your publishing business needs.
🔔 Conditional Formatting Alerts
Get real-time alerts using color-coded indicators to quickly identify areas of concern, such as low sales, declining engagement, or underperforming revenue streams.
📈 Revenue and Content Insights
Gain insights into content performance, ad revenue, and subscription growth, helping you make informed decisions about your publishing strategy.
🚀 Why You’ll Love the Publishing KPI Dashboard in Excel:
✅ Track Content Performance – Monitor how well your content is performing across multiple channels and formats, from digital articles to print publications.
✅ Boost Revenue Generation – Track ad revenue, subscription rates, and book sales to maximize profitability and optimize revenue generation strategies.
✅ Enhance Audience Engagement – Measure audience engagement metrics such as comments, shares, and time spent on content to understand how to better serve your readers.
✅ Improve Subscription Retention – Monitor subscription growth and retention rates to identify areas of improvement and reduce churn.
✅ User-Friendly Interface – The dashboard is simple to use, even for those with limited technical experience, allowing you to easily input data and interpret results.
✅ Fully Customizable – Tailor the dashboard to fit your specific publishing needs, whether you focus on books, magazines, newspapers, or digital content.
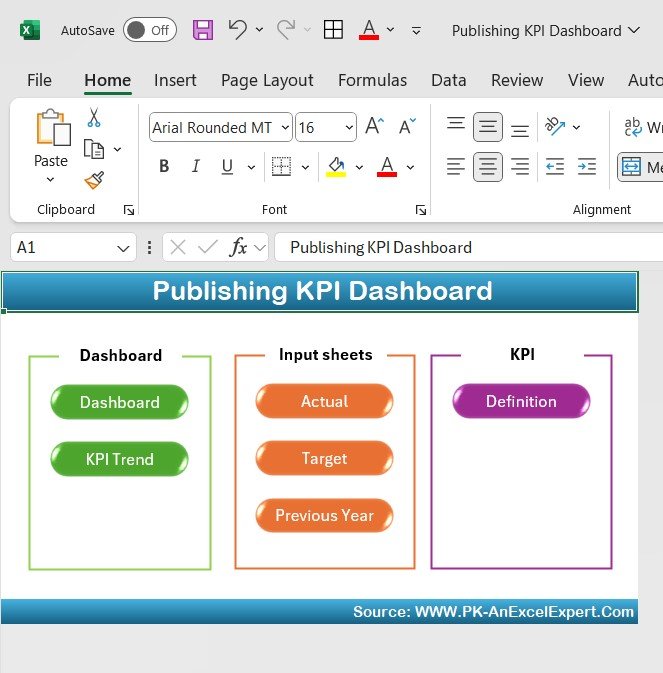
What’s Inside the Publishing KPI Dashboard in Excel:
- Sales and Revenue KPI: Track book sales, magazine subscriptions, and digital content revenue to monitor overall business profitability.
- Subscription and Retention KPI: Measure new subscriptions, renewals, and churn to ensure steady growth in your subscriber base.
- Content Engagement KPI: Monitor content performance across different platforms, including social media, web traffic, and reader interaction.
- Advertising Performance KPI: Track ad revenue, CPM (cost per thousand impressions), and ad engagement metrics to optimize advertising strategies.
- Customer Acquisition KPI: Monitor new customer acquisition through various channels, including direct sales, online marketing, and referrals.
- Reader Satisfaction KPI: Measure customer satisfaction through feedback, surveys, and ratings to enhance content quality and customer service.
How to Use the Publishing KPI Dashboard in Excel:
1️⃣ Download the Template – Instantly access your Excel file upon purchase.
2️⃣ Input Your Data – Enter sales figures, subscription data, ad revenue, and content engagement metrics into the provided fields.
3️⃣ Set Targets – Define specific KPIs for sales, subscriptions, and engagement to guide your business decisions.
4️⃣ Track Performance – Monitor real-time performance across multiple KPIs and make adjustments to improve your publishing efforts.
5️⃣ Generate Reports – Use the dashboard to generate detailed reports for management meetings, investor presentations, or content strategy reviews.
Who Can Benefit from the Publishing KPI Dashboard in Excel:
- Publishing Companies
- Content Creators
- Magazine and Newspaper Editors
- Marketing Teams
- Subscription-based Services
- Digital Publishers
- Business Owners
- Advertising Teams
The Publishing KPI Dashboard in Excel is the perfect tool for any publishing business looking to track content performance, optimize revenue, and enhance reader engagement.
Click here to read the Detailed blog post
https://www.pk-anexcelexpert.com/publishing-kpi-dashboard/
Visit our YouTube channel to learn step-by-step video tutorials
Youtube.com/@PKAnExcelExpert


Reviews
There are no reviews yet.