

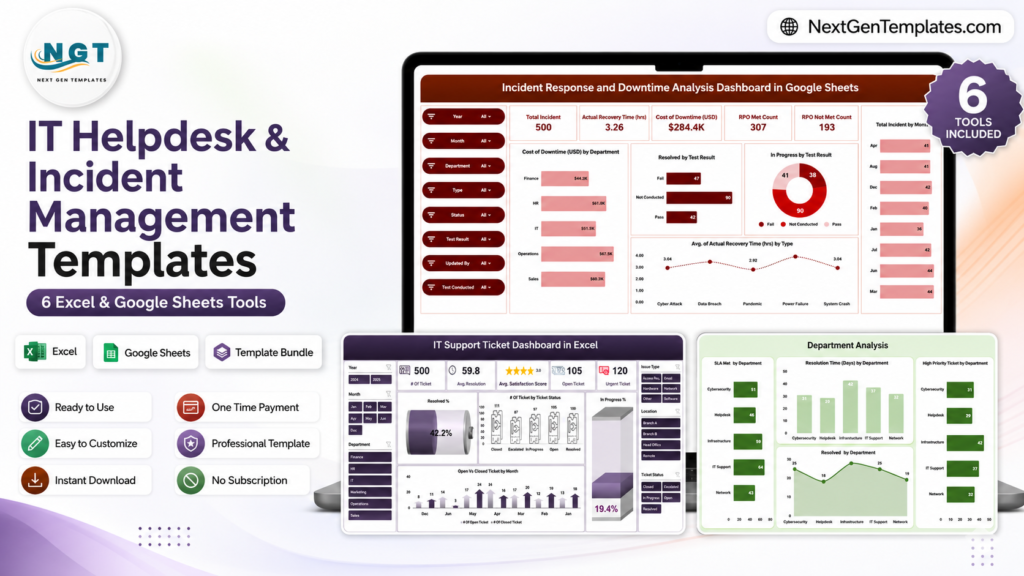
IT helpdesk Excel and Google Sheets templates help support teams track tickets, SLA compliance, incidents, downtime, and cybersecurity response KPIs without paying for a full ITSM platform. The need is real: the IBM 2025 Cost of a Data Breach Report lists the global average cost of a data breach at $4.44 million. When teams do not track ticket queues, SLA misses, MTTR, downtime cost, and incident response KPIs in one place, small support issues can become costly operational risks.
This guide compares six paid NextGenTemplates tools for IT helpdesk, incident response, and cybersecurity teams. The mix includes Excel dashboards for offline reporting, Google Sheets dashboards for collaboration, and KPI scorecards for leadership reviews. Use it to choose the right incident tracker, IT support template, or cybersecurity KPI dashboard for your team.
Key Features of IT Helpdesk and Incident Management Templates
The best IT support template should make ticket status, ownership, priority, SLA compliance, recovery time, and response quality visible at a glance. These six templates focus on practical service desk and security operations workflows: logging tickets, tracking open and urgent issues, measuring response and recovery time, reviewing downtime cost, comparing actuals against targets, and reporting trends to managers.IT Helpdesk & Incident Management Templates
| Template | Platform | Best Use | Sale Price |
|---|---|---|---|
| IT Support Ticket Dashboard in Excel | Excel | Helpdesk ticket tracking, technician performance, issue analysis | $17.99 |
| IT SLA Compliance and Ticket Monitoring Dashboard in Google Sheets | Google Sheets | SLA compliance, agent analysis, ticket monitoring | $9.99 |
| Incident Response and Downtime Analysis Dashboard in Google Sheets | Google Sheets | Incident response, recovery time, downtime cost, RPO review | $6.99 |
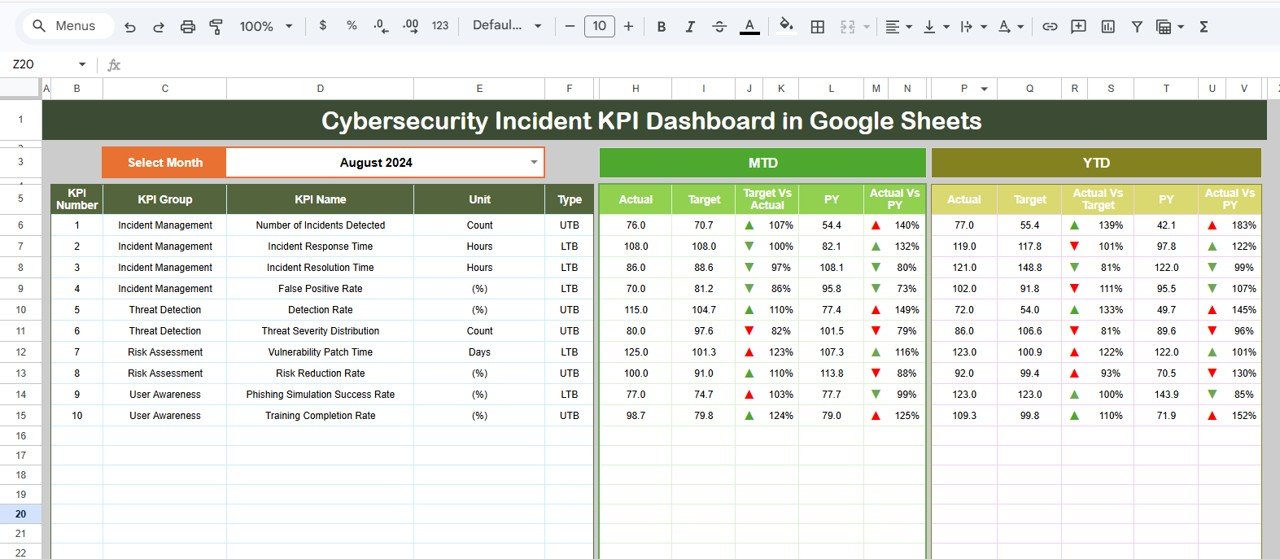
| Cybersecurity Incident KPI Dashboard in Google Sheets | Google Sheets | Collaborative cybersecurity KPI monitoring | $9.99 |
| Cybersecurity Incident KPI Dashboard in Excel | Excel | Security incident tracking, response time, resolution progress | $12.99 |
| Cyber Incident Response KPI Scorecard In Excel | Excel | SOC scorecards, CISO reporting, actual vs target review | $14.99 |
 Launch offer
SUMIFS, XLOOKUP, FILTER, LAMBDA and checking AI-written formulas, with real business projects. 11h 47m of video by PK, with practice files, quizzes and a capstone.
Dashboard Pages Explanation
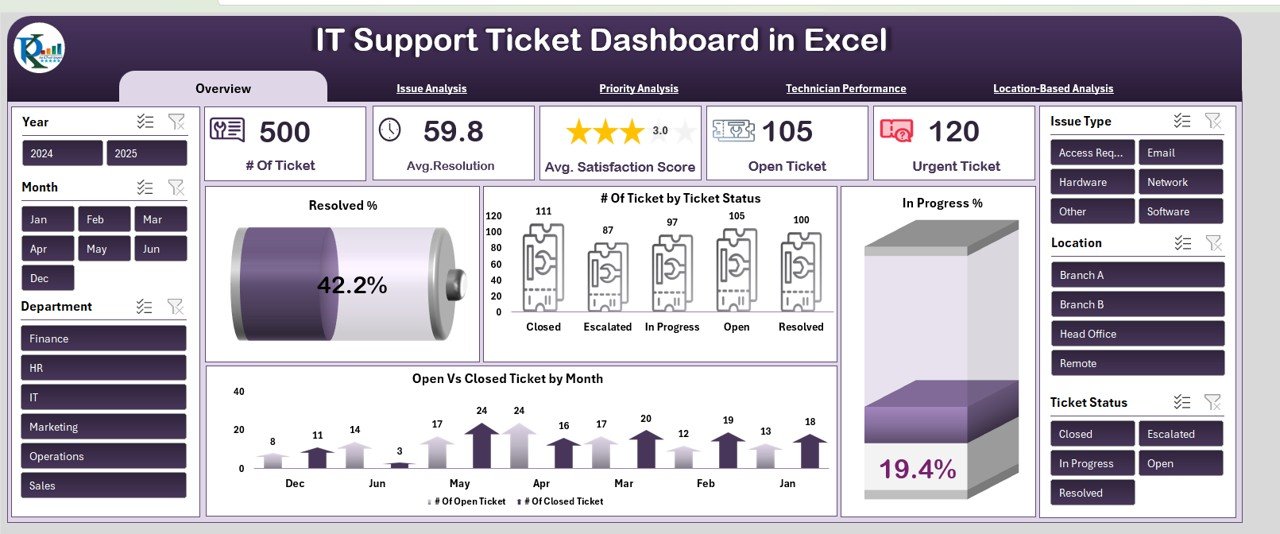
Each tool is built around a different reporting job. The IT Support Ticket Dashboard in Excel gives a classic service desk view with overview KPIs, issue analysis, priority analysis, technician performance, location analysis, and a data sheet.
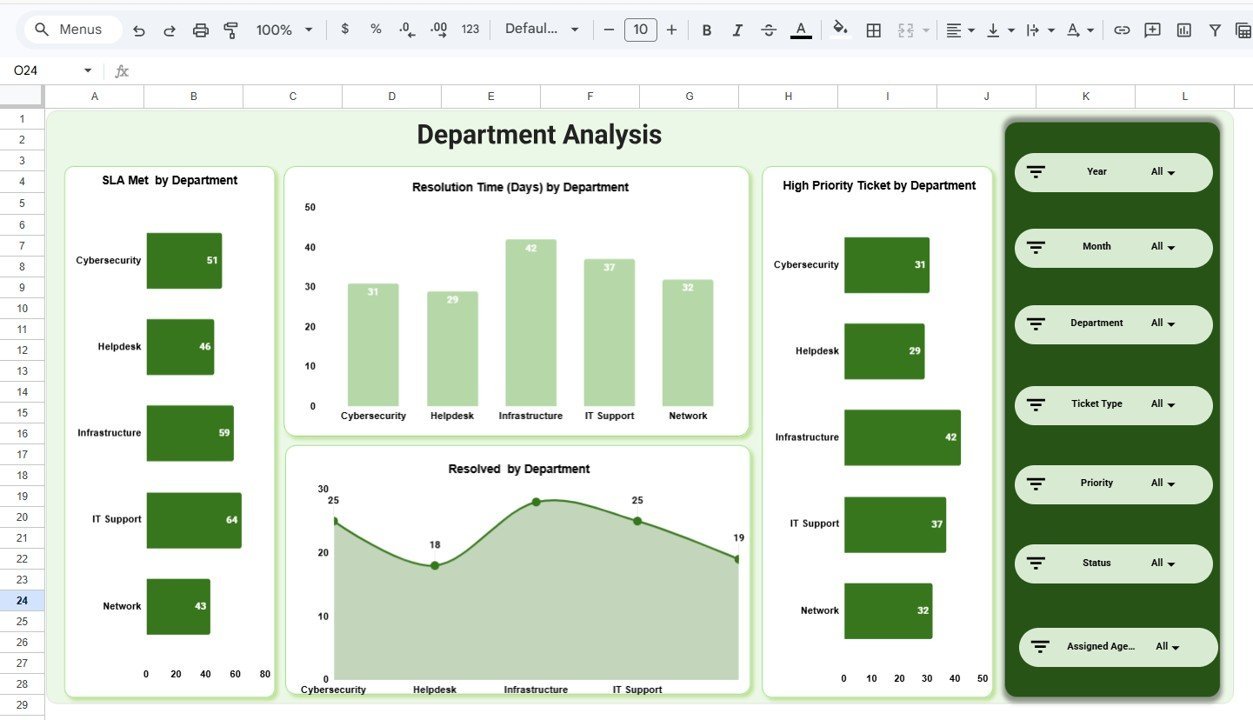
The IT SLA Compliance and Ticket Monitoring Dashboard in Google Sheets is better for teams that need shared SLA reporting. It includes overview, department analysis, ticket analysis, assigned agent analysis, monthly trends, and a structured data sheet.IT Helpdesk & Incident Management Templates
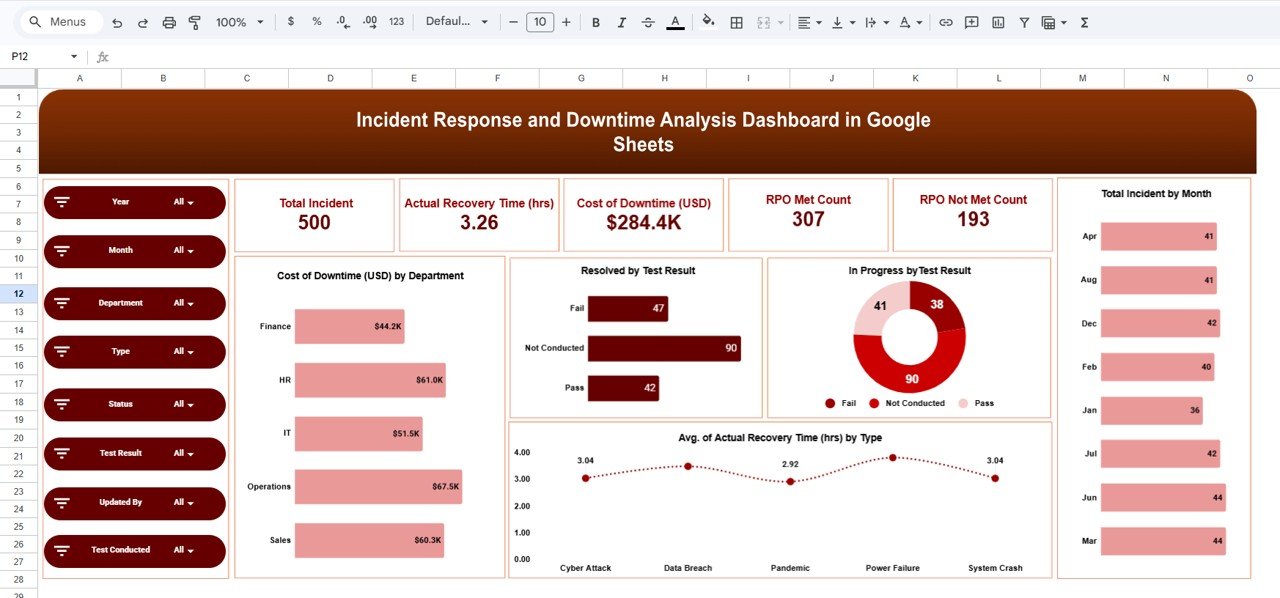
The Incident Response and Downtime Analysis Dashboard in Google Sheets focuses on incident count, recovery time, downtime cost, RPO performance, department-level analysis, and monthly trends. It is useful when the support question is not just how many tickets were closed, but how much downtime the organization absorbed.
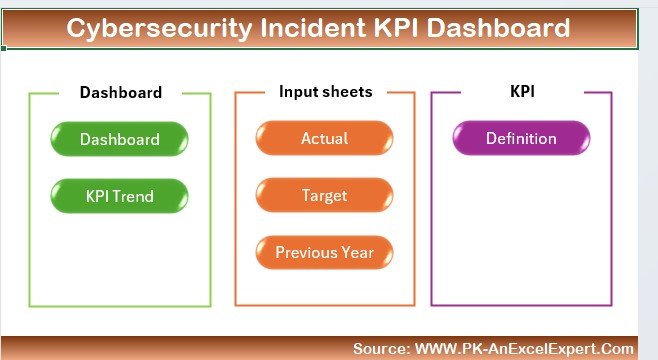
The two cybersecurity incident dashboards help security teams track incident frequency, severity, response performance, and KPI trends. Use the Google Sheets version when collaboration matters most. Use the Excel version when you want a downloadable workbook and offline analysis.IT Helpdesk & Incident Management Templates
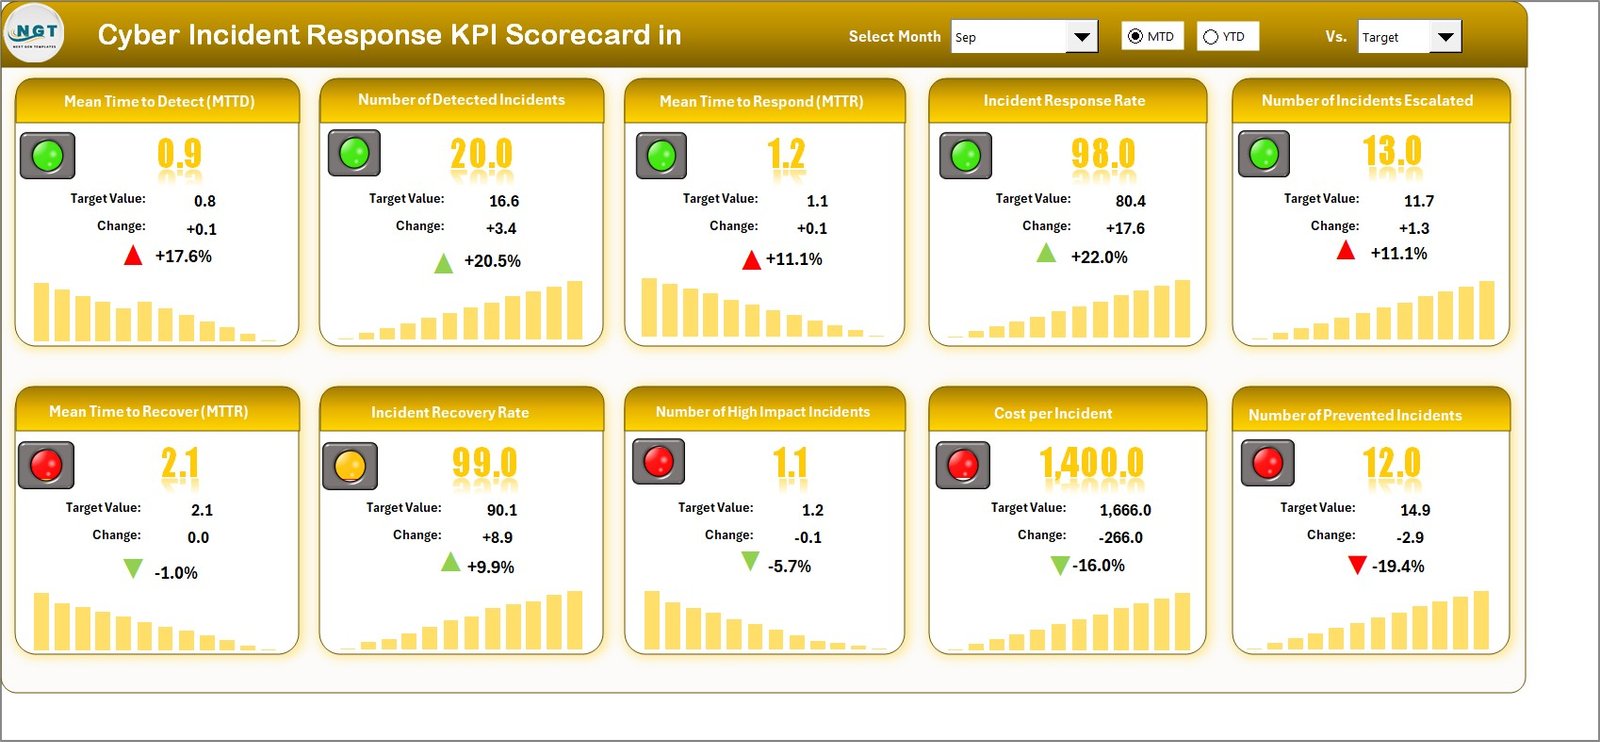
The Cyber Incident Response KPI Scorecard In Excel is the leadership reporting option. It is built for MTD and YTD performance review, actual vs target gaps, KPI definitions, trend charts, and color-coded status indicators.IT Helpdesk & Incident Management Templates
IT Helpdesk and Incident Management Templates vs Paid ITSM Software – Feature Comparison
Spreadsheet templates are not a replacement for enterprise ITSM systems, but they are often the fastest way to introduce structured reporting. Atlassian highlights common incident metrics such as MTTA and MTTR in its incident management KPI guide, and these templates give teams a practical way to start measuring those metrics.
| Feature | Excel and Google Sheets Templates | ITSM Platform Setup | Enterprise SaaS Suite |
|---|---|---|---|
| Cost | One-time template purchase | Subscription plus configuration time | Higher annual cost and admin overhead |
| Setup time | Minutes after download | Days or weeks depending on workflow | Longer implementation cycle |
| Collaboration | Google Sheets templates can be shared with a link using Google Sheets collaboration | Role-based queues and portals | Enterprise access controls and integrations |
| Customization | Edit fields, KPIs, sheets, charts, and targets | Configurable with admin knowledge | Configurable but often governed by IT policy |
| Best fit | Small teams, managers, analysts, consultants, MSP reporting | Teams already running a ticketing workflow | Large organizations needing deep automation |
Who Should Use This Template
These templates are built for IT support managers, helpdesk leads, service delivery teams, MSPs, cybersecurity analysts, SOC managers, CIOs, and business analysts who need clean reporting quickly. They are especially useful when you already have ticket exports, incident logs, or monthly KPI numbers but need a better way to analyze and present them.IT Helpdesk & Incident Management Templates
They are not the right fit if you need live ticket creation, automated alert routing, user authentication, API-based CMDB sync, or full audit trails. In that case, use them as a reporting layer or management summary while your main ITSM platform remains the system of record.
Real-World Use Cases
Helpdesk manager: Use the IT Support Ticket Dashboard in Excel to review open tickets, urgent issues, technician workload, and customer satisfaction before the weekly support meeting.
MSP service lead: Use the SLA Compliance Dashboard in Google Sheets to share monthly SLA performance with clients and compare departments, ticket types, agents, and monthly trends.
Cybersecurity analyst: Use the Cybersecurity Incident KPI Dashboard to track incident severity, response time, resolution progress, and historical trend movement.IT Helpdesk & Incident Management Templates
CISO or IT director: Use the Cyber Incident Response KPI Scorecard in Excel to present MTD/YTD status, actual vs target gaps, and KPI definitions in a leadership-friendly format.IT Helpdesk & Incident Management Templates
Advantages of IT Helpdesk and Incident Management Templates
The biggest advantage is speed. You can start with exported ticket data, paste it into the data sheet, and immediately see operational metrics. Excel works well for offline analysis, controlled monthly reporting, and polished PDF outputs. Google Sheets works well for collaborative review, shared dashboards, and teams that want one live reporting workbook.
These templates also lower the barrier to KPI discipline. Instead of debating which numbers to track, teams can begin with common measures such as open tickets, high-priority tickets, SLA met rate, resolution time, recovery time, downtime cost, incident severity, and actual vs target performance.
Opportunities for Improvement
Spreadsheet dashboards depend on good data hygiene. If ticket exports are incomplete, agent names are inconsistent, or incident severity is not defined, the dashboard will show those data quality problems. The templates also do not automatically create support tickets or replace an ITSM workflow. For best results, treat them as reporting templates: export, clean, paste, review, and discuss actions.
Best Practices
Start with a simple KPI set: ticket volume, open tickets, urgent tickets, SLA met rate, average resolution time, customer rating, downtime cost, and incident severity. Define every KPI before using it in leadership reporting. Keep one owner for the data refresh process. Review trends monthly, but review open critical tickets daily. For Google Sheets dashboards, use controlled sharing permissions so stakeholders can view the report without accidentally editing source data.
For SLA reporting, Microsoft provides a useful overview of service level management concepts in Microsoft Learn service level management documentation. Use that kind of structure to decide which ticket types, priorities, and response targets belong in your own tracker.
Explore Relevant Templates
Best for Excel helpdesk reporting
IT Support Ticket Dashboard in Excel is the best starting point when your team needs a classic helpdesk Excel dashboard with ticket counts, priority analysis, issue analysis, technician performance, and location-level reporting.
View IT Support Ticket Dashboard in Excel
Best for SLA tracking in Google Sheets
IT SLA Compliance and Ticket Monitoring Dashboard in Google Sheets is built for support teams that want to track SLA met rates, resolution time, customer rating, open tickets, and high-priority ticket trends collaboratively.
View IT SLA Compliance Dashboard
Best for downtime and recovery analysis
Incident Response and Downtime Analysis Dashboard in Google Sheets helps teams connect incident response to business impact by tracking recovery time, downtime cost, RPO performance, and monthly incident trends.
View Incident Response Dashboard
Best for cybersecurity incident KPIs
Choose Cybersecurity Incident KPI Dashboard in Google Sheets for real-time shared reporting, or Cybersecurity Incident KPI Dashboard in Excel for offline Excel reporting.
View Google Sheets Cybersecurity Dashboard View Excel Cybersecurity Dashboard
Best for executive cyber response scorecards
Cyber Incident Response KPI Scorecard In Excel is the right fit when leadership wants a scorecard view with targets, trends, definitions, and color-coded status.
View Cyber Incident Response Scorecard
For teams that also want Power BI coverage, review the IT and Cybersecurity Operations Bundle. It expands the toolkit with IT operations, data center, asset management, and Power BI dashboards.
Frequently Asked Questions
What is the best IT helpdesk Excel template for ticket tracking?
The IT Support Ticket Dashboard in Excel is the best fit when you need ticket volume, issue analysis, priority analysis, technician performance, location analysis, and a structured data sheet in one workbook.
Which template should I use for SLA compliance?
Use the IT SLA Compliance and Ticket Monitoring Dashboard in Google Sheets when SLA met rate, resolution time, customer rating, assigned agent performance, and monthly ticket trends are your main reporting needs.
Can these templates replace Jira, Zendesk, or ServiceNow?
No. They are reporting and analysis templates, not ticketing systems. They work best with exported ticket, incident, or KPI data from your existing workflow.
Should I choose Excel or Google Sheets?
Choose Excel for offline control, monthly management packs, and flexible local analysis. Choose Google Sheets when multiple team members need shared access and collaborative review.
Can cybersecurity teams use these templates?
Yes. The cybersecurity incident dashboards and cyber incident response scorecard are built for security incident KPIs, response performance, risk visibility, and leadership reporting.
About the Author
Built by PK – Microsoft Certified Professional with 15+ years of Excel, Google Sheets, and Power BI experience. Founder of NextGenTemplates, reaching 300K+ subscribers across YouTube channels. Every template is hand-built and tested before release.
For walkthroughs and template tutorials, visit the NextGenTemplates YouTube channel.
Conclusion
If your team needs a practical IT support template, start with the IT Support Ticket Dashboard in Excel. If SLA compliance and shared reporting matter most, use the Google Sheets SLA dashboard. If your main concern is downtime, incident recovery, or cybersecurity response, choose the incident response and cyber KPI tools. Together, these six templates give IT teams a low-cost reporting layer for tickets, SLAs, downtime, and security incidents.