
The Community Management KPI Dashboard in Excel is an essential tool for community managers, social media teams, and business owners looking to track and optimize the performance of their online communities. This customizable dashboard allows you to monitor key performance indicators (KPIs) such as engagement rates, community growth, user interactions, and content effectiveness in one place.
With real-time data updates, this Excel-based dashboard provides valuable insights into how your community is performing. From measuring member engagement to analyzing growth trends, this tool helps you make data-driven decisions to foster stronger relationships, improve user engagement, and ultimately build a more vibrant community.
Key Features of the Community Management KPI Dashboard in Excel
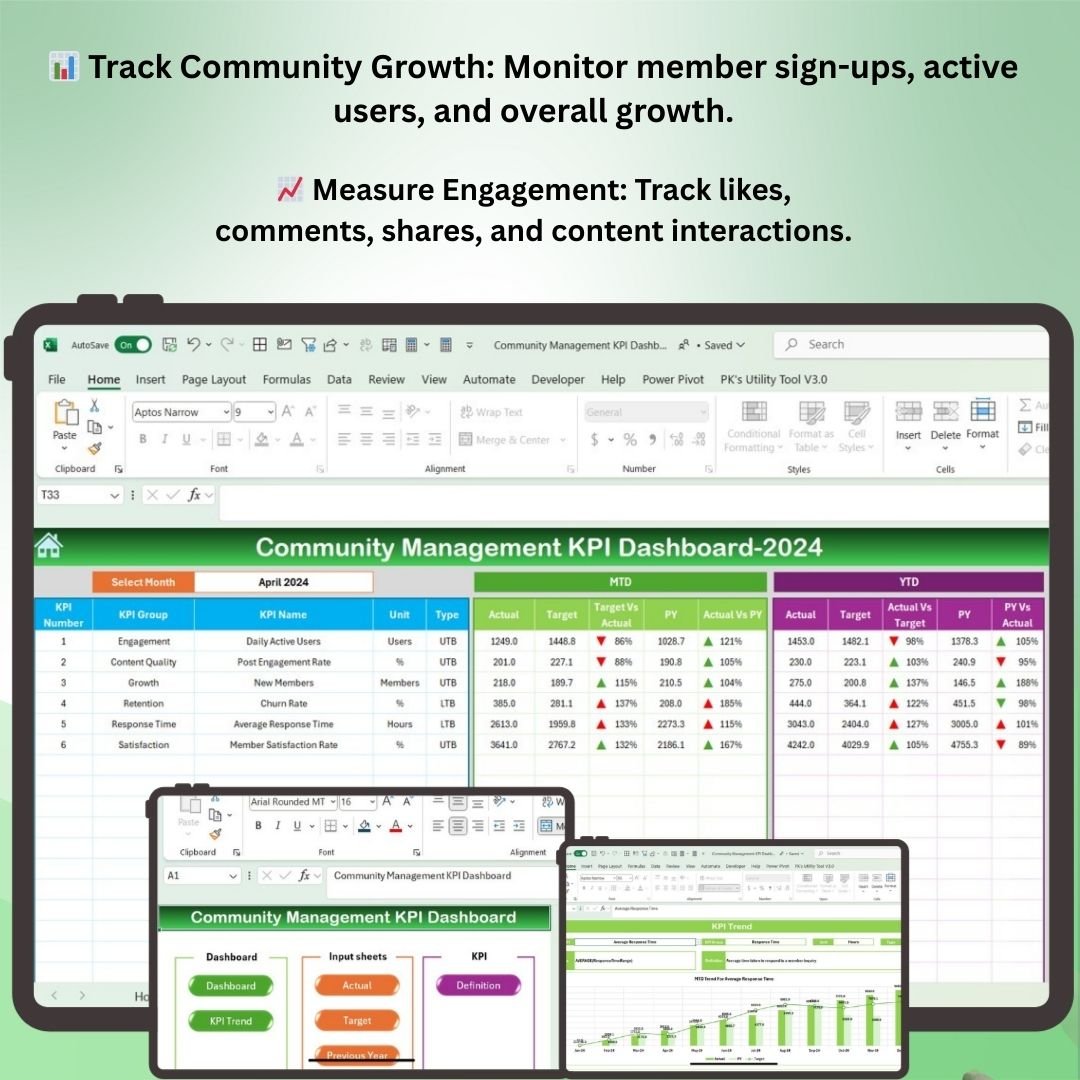
📊 Track Community Growth & Engagement
Monitor key metrics such as member growth, active users, and engagement rates. Measure how well your community is growing and how users are interacting with your content.
📈 Measure User Interactions & Content Performance
Track likes, comments, shares, and other user interactions with your content. Identify which types of content resonate most with your audience and adjust your strategy accordingly.
👥 Community Demographics & Insights
Analyze the demographics of your community members, including age, location, and interests. Gain valuable insights into who your audience is and tailor your content to better serve them.
📅 Monitor Community Events & Activities
Track community events, such as webinars, meetups, or online discussions. Measure attendance, participation, and engagement during these events to evaluate their success.
🔍 Sentiment Analysis
Monitor the sentiment of your community through engagement metrics. Track positive, neutral, and negative comments to measure overall community mood and address any issues promptly.
🖥️ Customizable & Interactive Layout
This Excel dashboard is fully customizable to meet your specific community management needs. Adjust KPIs, time periods, and visualizations to align with your community’s goals.
Why You’ll Love the Community Management KPI Dashboard in Excel
✅ Optimize Community Engagement
Monitor engagement metrics and identify areas where you can improve content and interaction. Foster stronger connections and a more active community.
✅ Track Community Growth
Easily track the growth of your community. Measure member sign-ups, active users, and overall community size to assess how well your growth strategies are working.
✅ Measure Content Effectiveness
Evaluate which types of content drive the most engagement. Use this data to improve your content strategy and increase interactions with your community.
✅ Gain Insights into Your Audience
Understand your community demographics and sentiment. Tailor your content to better meet the needs of your members and create a more engaging environment.
✅ Fully Customizable & Scalable
The dashboard is fully customizable, allowing you to filter data by date, content type, or member demographics. Scale the dashboard as your community grows to maintain valuable insights.
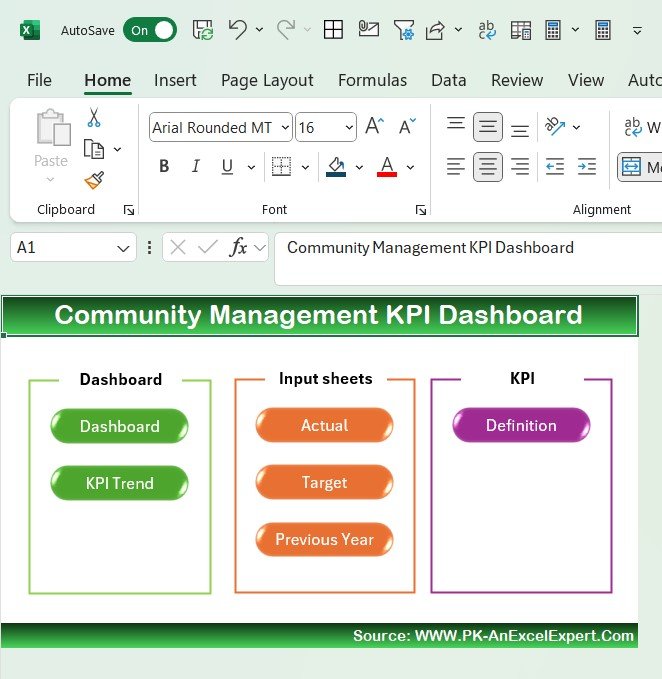
What’s Inside the Community Management KPI Dashboard Template in Excel?
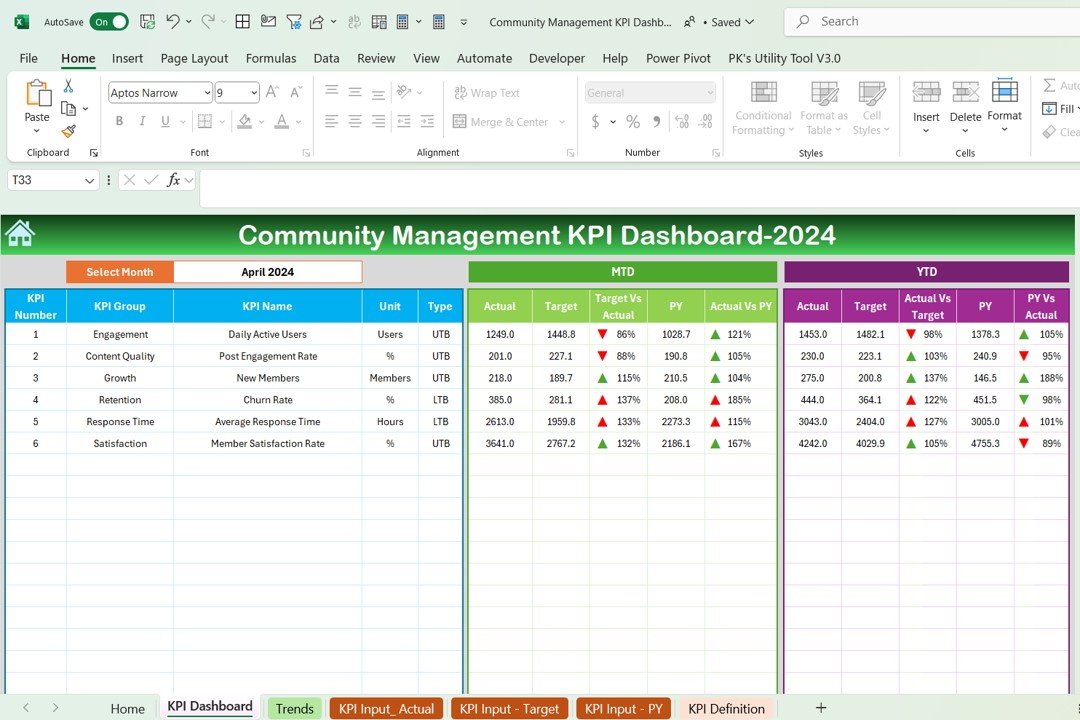
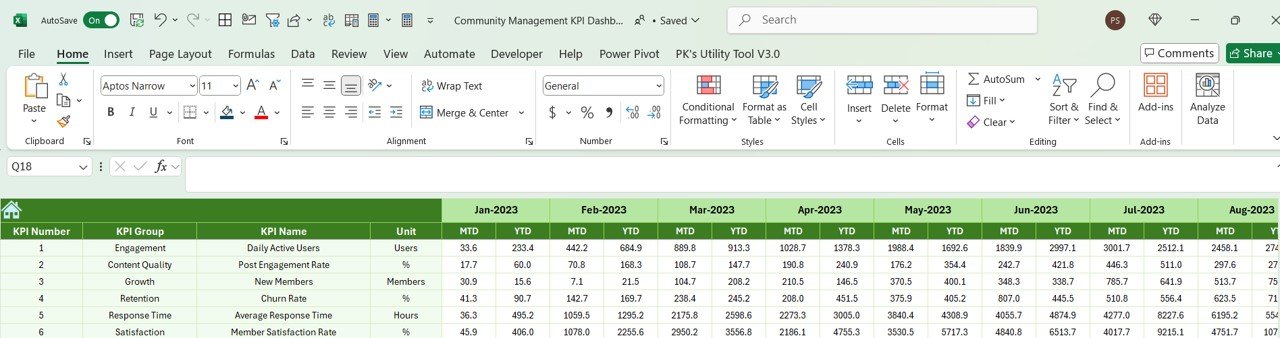
- Community Growth Tracking: Monitor member sign-ups, active users, and overall community growth.
- Engagement Metrics: Track likes, comments, shares, and overall engagement rates.
- Content Performance Monitoring: Measure the effectiveness of different types of content.
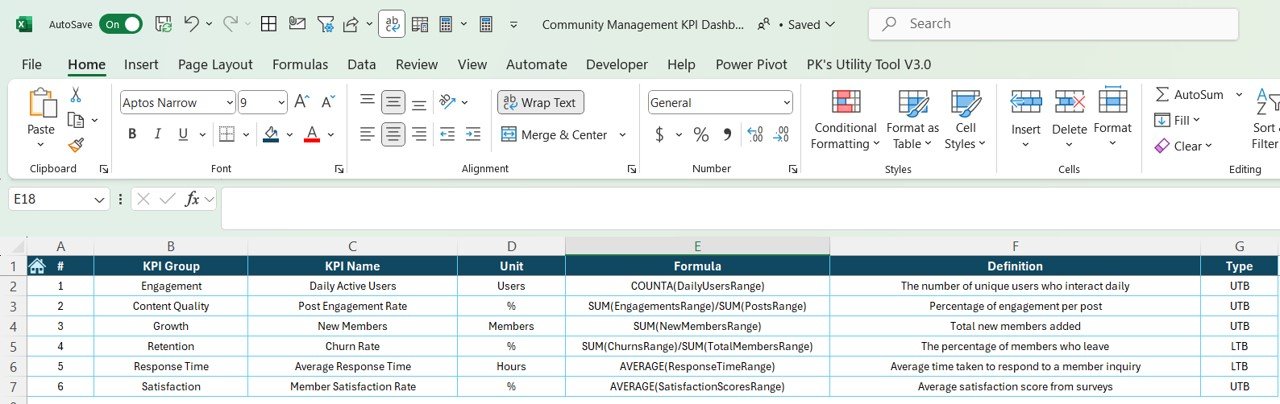
- Sentiment Analysis: Analyze the mood of the community through user interactions.
- Event Tracking: Monitor the success of community events and activities.
- Customizable Layout: Tailor the dashboard to your community management needs.
How to Use the Community Management KPI Dashboard in Excel
1️⃣ Download the Template: Get immediate access to the Community Management KPI Dashboard in Excel.
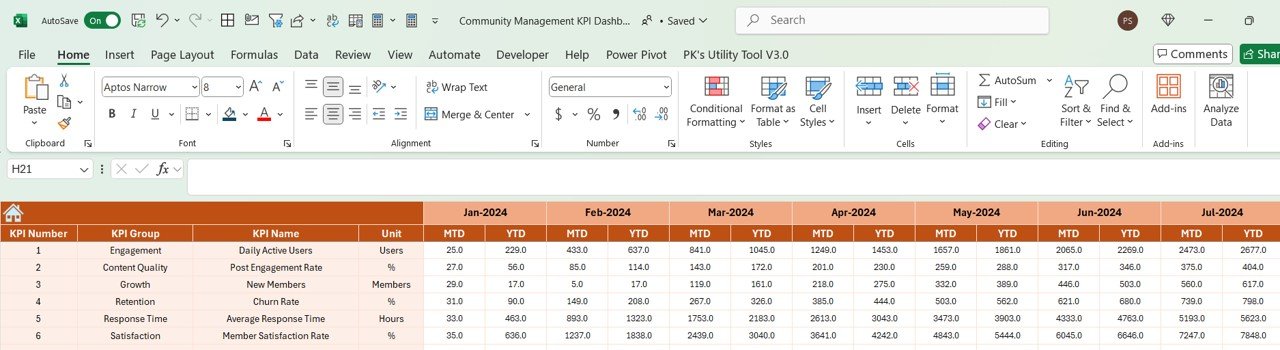
2️⃣ Input Your Community Data: Enter your community engagement data, member growth statistics, and content performance metrics.
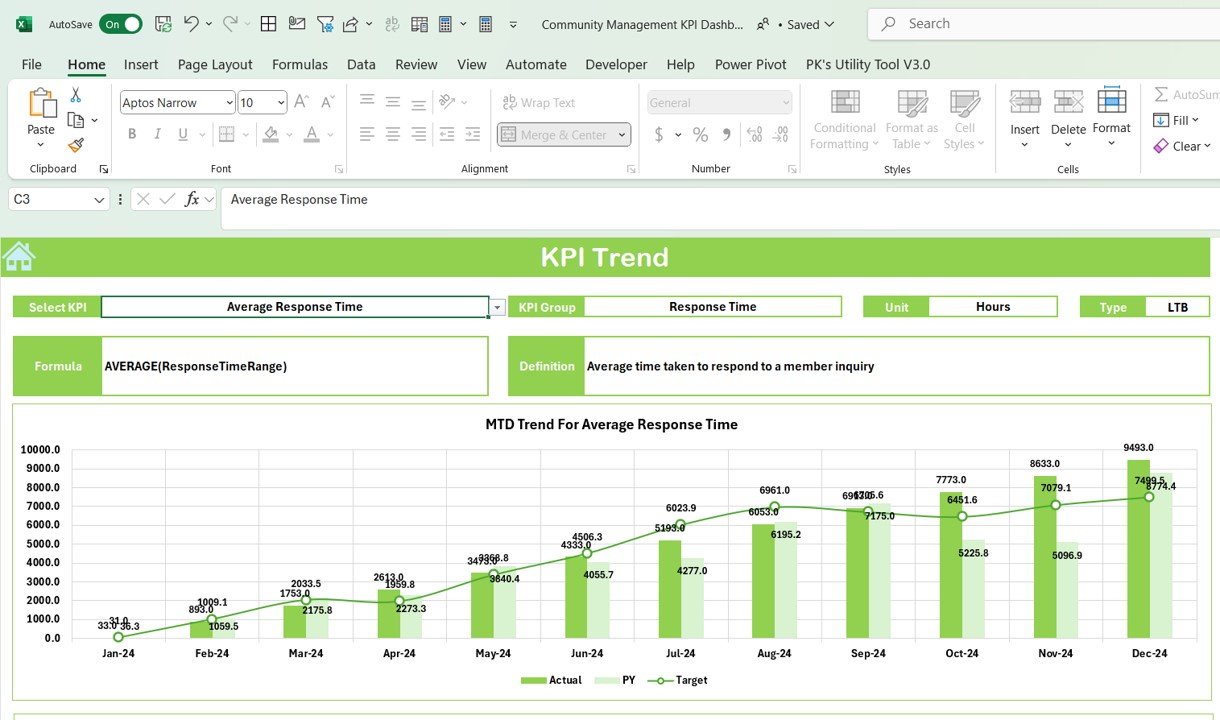
3️⃣ Track & Monitor KPIs: Use the dashboard to track KPIs such as engagement rates, community size, and content effectiveness.
4️⃣ Analyze & Optimize Content: Use insights to improve content strategies and increase community engagement.
5️⃣ Generate Reports & Insights: Create customized reports to share with stakeholders or clients.
Who Can Benefit from the Community Management KPI Dashboard in Excel?
🔹 Community Managers & social media Teams
🔹 Digital Marketers & Content Creators
🔹 Business Owners with Online Communities
🔹 Event Organizers & Webinar Hosts
🔹 Influencers & Brand Managers
🔹 Marketing Analysts & Data Analysts
Optimize your community management efforts and increase engagement with the Community Management KPI Dashboard in Excel. Track growth, engagement, content performance, and community sentiment to drive better results.
Click here to read the Detailed blog post
Visit our YouTube channel to learn step-by-step video tutorials
Youtube.com/@PKAnExcelExpert


Reviews
There are no reviews yet.