
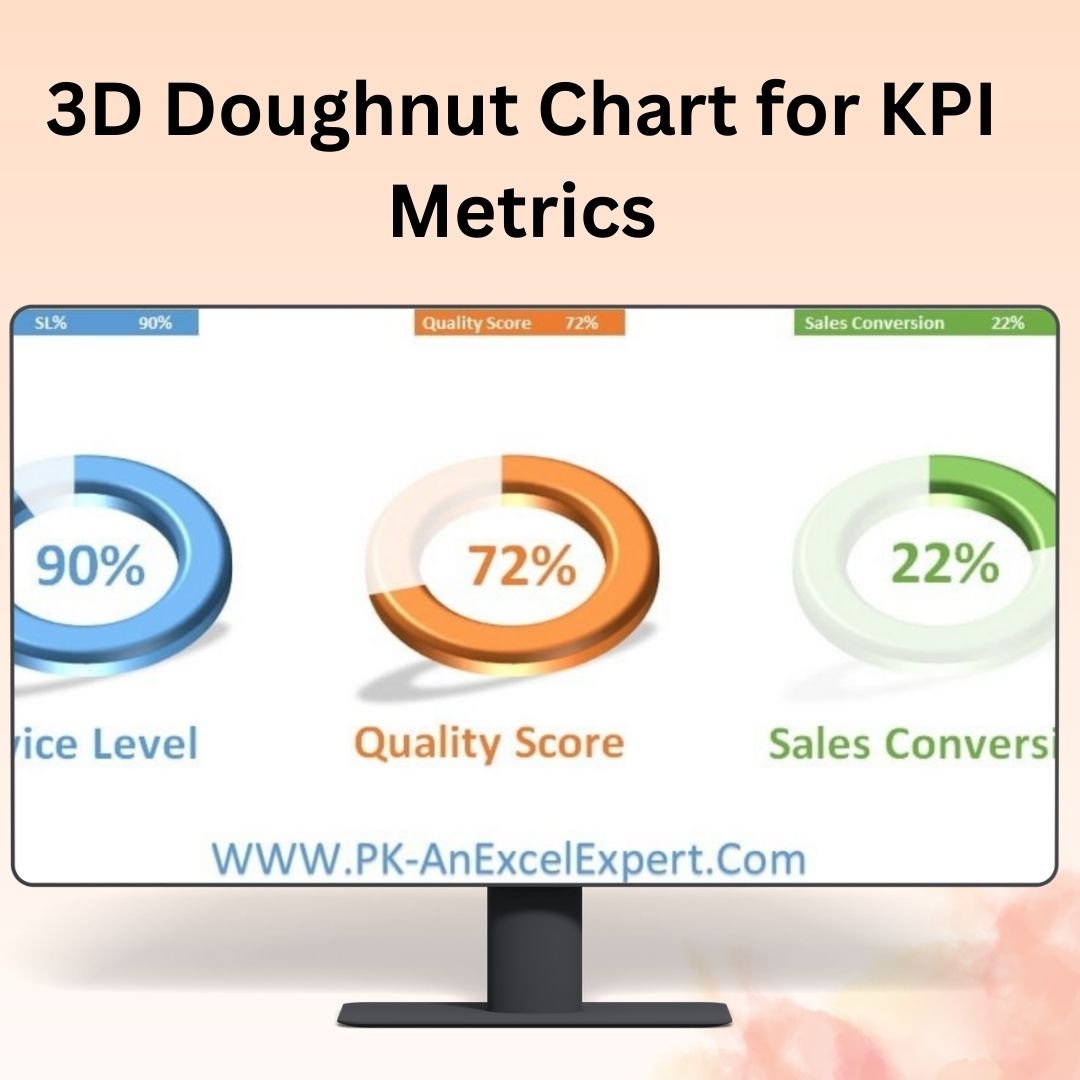
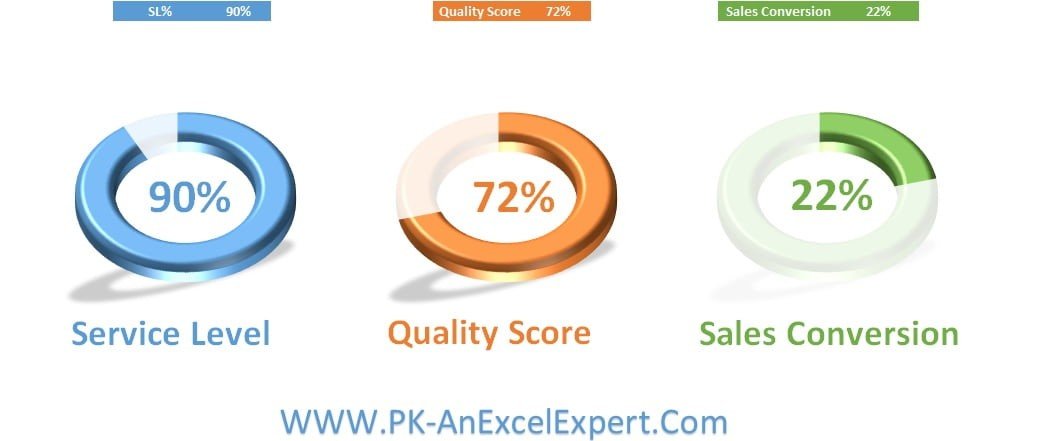
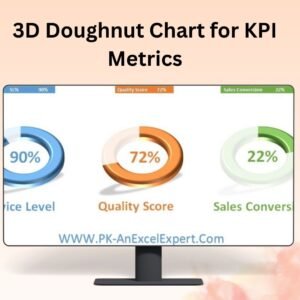
The 3D Doughnut Chart is a dynamic and visually engaging Excel tool designed to help you represent data in a three-dimensional, circular chart format. This tool is perfect for displaying key performance indicators (KPIs), sales data, project progress, and other essential metrics in a visually appealing way. By using 3D doughnut charts, you can showcase data trends and comparisons more effectively, making it easier to convey your insights and analysis in reports or presentations.
This chart is fully customizable, allowing you to adjust its appearance, color scheme, and data inputs to match your specific needs. The 3D effect adds depth and clarity to the chart, making it ideal for presentations where you need to capture the audience’s attention while providing valuable data insights. With a user-friendly interface and real-time data updates, the 3D Doughnut Chart is a powerful tool for anyone looking to elevate their data visualization.
Key Features of the 3D Doughnut Chart:
📊 Three-Dimensional Data Representation
Display your data in an eye-catching 3D doughnut chart format, allowing you to highlight different sections and provide more visually appealing comparisons.
🎨 Customizable Design
Tailor the chart’s appearance to suit your needs by adjusting the color scheme, section labels, and data values. Customize the chart to fit your branding or presentation style.
📈 Multiple Data Series
Track multiple data points or categories in one chart, making it easy to visualize relationships and trends across different metrics.
🔄 Real-Time Data Updates
As you enter or update data in the chart, it automatically adjusts, providing you with real-time insights into the performance metrics you’re tracking.
⚙️ User-Friendly Interface
Designed for ease of use, this chart is simple to customize, update, and integrate into your existing Excel files or reports.
Why You’ll Love the 3D Doughnut Chart:
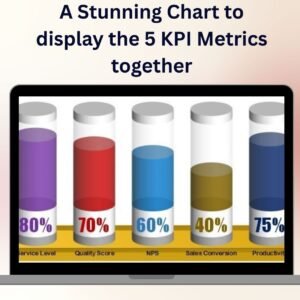
✅ Visually Engaging – The 3D effect makes it easier to highlight and compare key data points, making your reports more visually appealing and impactful. ✅ Flexible and Customizable – Fully customizable to meet your specific data visualization needs, from changing the chart’s colors to adding additional data points. ✅ Perfect for Presentations – The eye-catching design makes it ideal for presentations where you need to grab attention and convey data clearly. ✅ Real-Time Updates – The chart updates instantly as new data is entered, giving you up-to-date insights and ensuring your reports are always accurate. ✅ Track Multiple Metrics – Visualize multiple KPIs or other important metrics in a single chart, making it easier to analyze performance across various categories.
What’s Inside the 3D Doughnut Chart:
- Three-Dimensional Data Display – View your data in a 3D doughnut chart format for a more engaging and insightful presentation.
- Multiple Data Categories – Track and compare various data sets across a single chart.
- Dynamic Updates – Real-time updates as data is entered or modified.
- Customizable Design – Modify the chart’s appearance to suit your needs.
- User-Friendly Layout – Simple setup and integration into your existing Excel files.
How to Use the 3D Doughnut Chart:
1️⃣ Download the Template – Access the Excel file instantly after purchase. 2️⃣ Input Your Data – Add the data you wish to visualize into the designated fields. 3️⃣ Customize the Chart – Adjust the colors, labels, and other chart elements to match your preferences. 4️⃣ Analyze the Data – Use the 3D doughnut chart to track performance metrics, compare categories, and identify trends.
Who Can Benefit from the 3D Doughnut Chart:
- Business Analysts
- Data Analysts
- Sales and Marketing Teams
- Project Managers
- Financial Analysts
- Executives
- Anyone looking to present data in a more engaging, visually appealing format
The 3D Doughnut Chart is the ideal solution for anyone looking to make their data more visually engaging and insightful. Whether you’re tracking sales, project progress, or key performance indicators, this tool makes it easy to present your data in a way that’s both informative and visually appealing.
Click here to read the Detailed blog post
https://www.pk-anexcelexpert.com/3d-doughnut-chart/
Visit our YouTube channel to learn step-by-step video tutorials
Watch the step-by-step video tutorial:
Compatibility and Requirements
- Works in Microsoft Excel desktop (Excel 2016 or later, or Microsoft 365).
- It is built with standard Excel charts. Microsoft’s guide Create a chart from start to finish covers how to edit chart data, colors and labels.
Frequently Asked Questions
What can I show in the 3D Doughnut Chart?
KPIs, sales data, project progress or other metrics, with several data series or categories in one chart.
Can I change the colors and section labels?
Yes. You can adjust the color scheme, section labels and data values to match your branding or presentation.
Does the chart update when I enter new data?
Yes. It adjusts as you add or change values in the data fields.
Can I add it to an existing workbook?
Yes. The chart is simple to set up and can go into your existing Excel files or reports.
Related Doughnut and KPI Charts
- Multilayered Doughnut Chart : Part-2: several doughnut layers in one chart
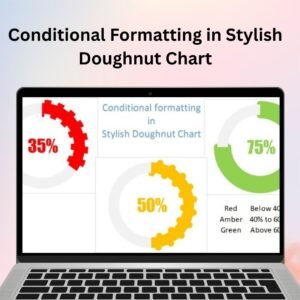
- Stylish Doughnut Charts in Excel: more doughnut chart styles
- 5 Layered Advanced Doughnut Chart: five layers for five metrics
- Half Circle KPI Charts in Excel using Doughnut Charts: KPI gauges built from doughnut charts
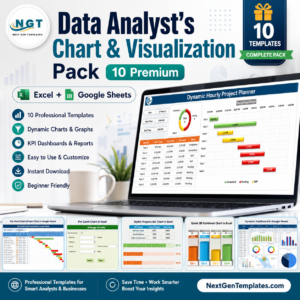
- Data Analyst’s Chart & Visualization Pack: 10 chart templates in Excel and Google Sheets
Browse all Excel chart templates or the Excel dashboard templates.










Reviews
There are no reviews yet.