
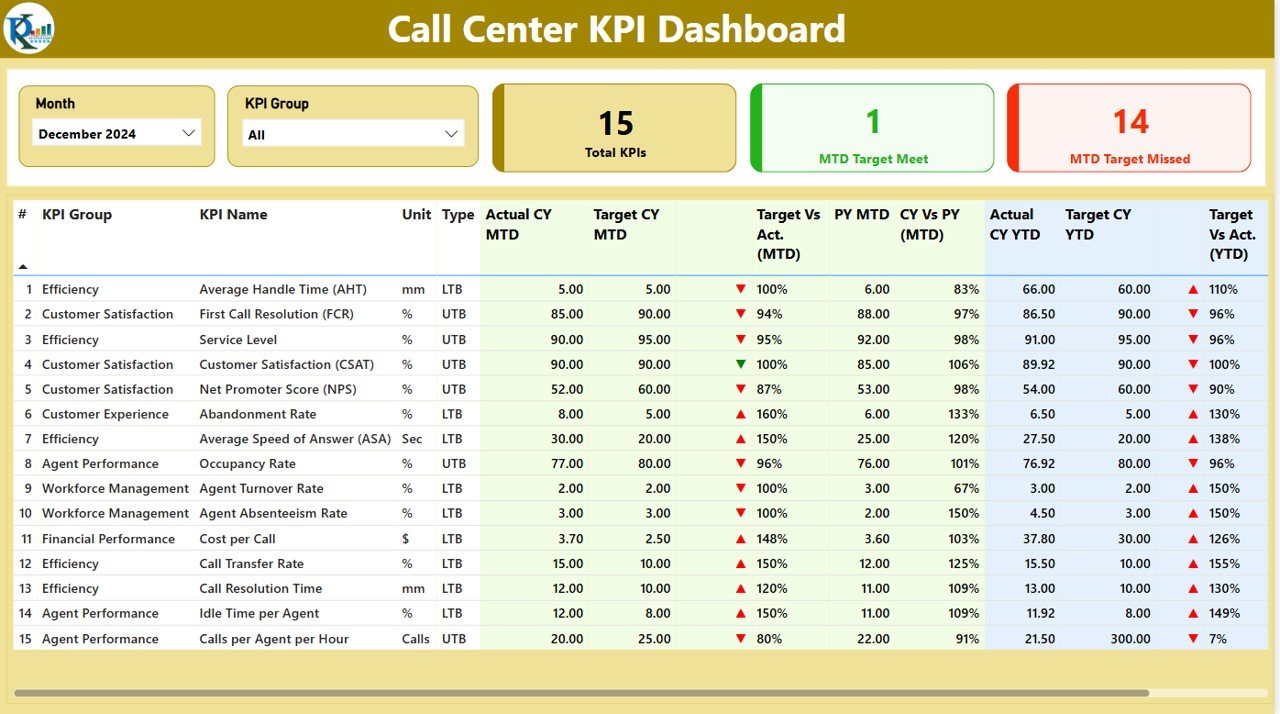
The Call Canter KPI Dashboard in Power BI is an advanced tool designed to help call center managers and teams monitor, analyze, and optimize their operations. By tracking key performance indicators (KPIs) such as call volume, response time, customer satisfaction, and agent performance, this interactive dashboard allows you to assess the efficiency of your call center in real-time.
With customizable visualizations and real-time data insights, this dashboard helps identify operational bottlenecks, improve customer service, and ensure that your call center is meeting its performance targets. Whether you are managing a small team or a large call center, this dashboard is scalable and adaptable to fit your specific needs.
Key Features of the Call Center KPI Dashboard in Power BI
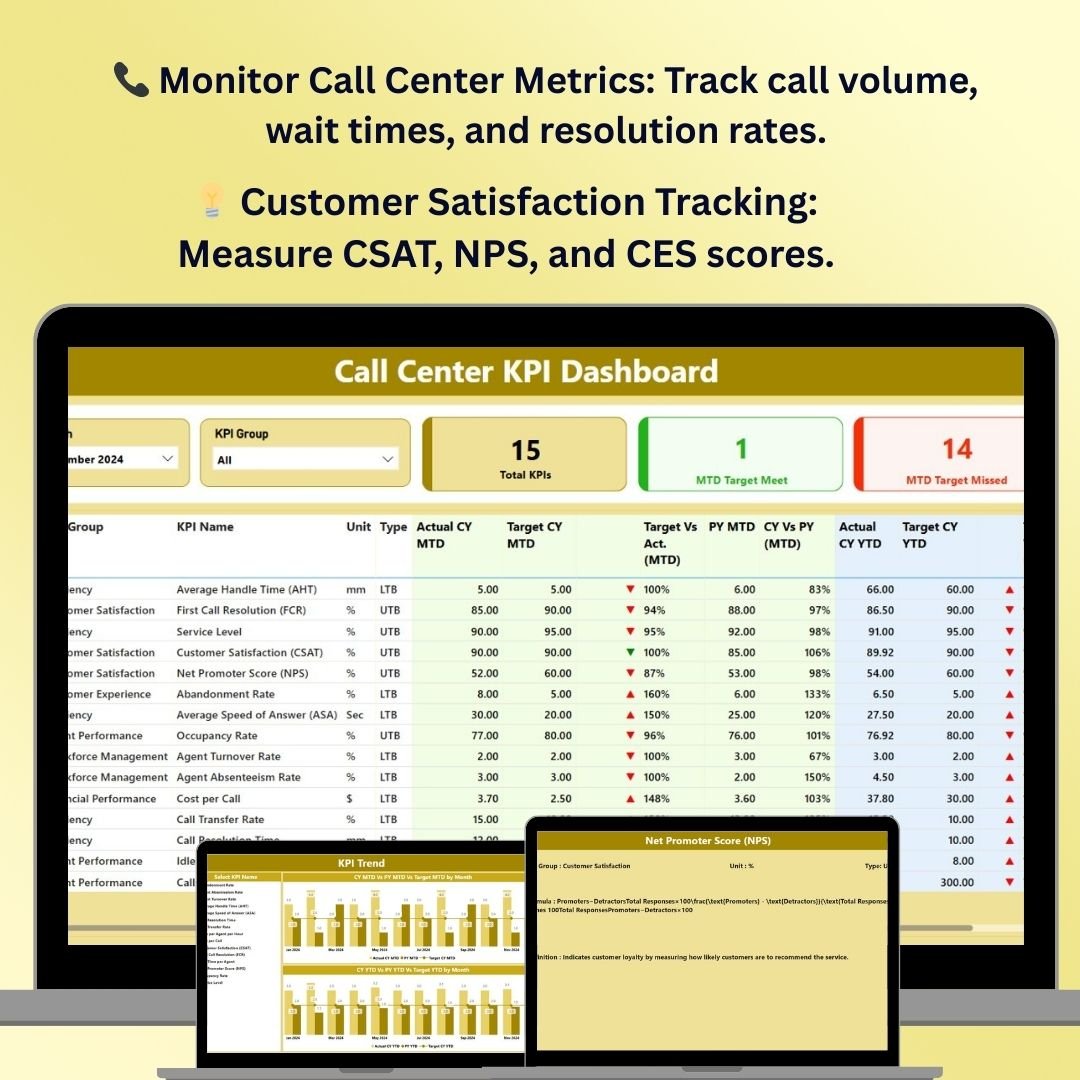
📞 Track Call Center Metrics
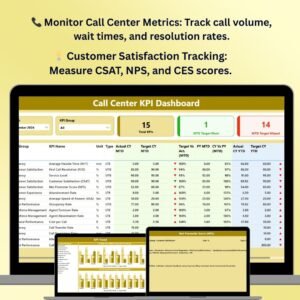
Monitor critical KPIs such as call volume, call duration, wait times, and first-call resolution rates. Track these metrics to ensure your team is delivering optimal customer service.
📊 Agent Performance Monitoring
Evaluate individual agent performance by tracking metrics like calls handled, response times, and customer satisfaction ratings. Use this data to identify areas for improvement and optimize agent performance.
💡 Customer Satisfaction Analysis
Measure customer satisfaction with KPIs like Net Promoter Score (NPS), Customer Satisfaction (CSAT) scores, and Customer Effort Score (CES). Monitor trends and feedback to improve the quality of service.
📅 Shift & Workload Monitoring
Track agent shift patterns and workloads to optimize staffing levels and reduce customer wait times. Ensure that the call center is adequately staffed during peak hours.
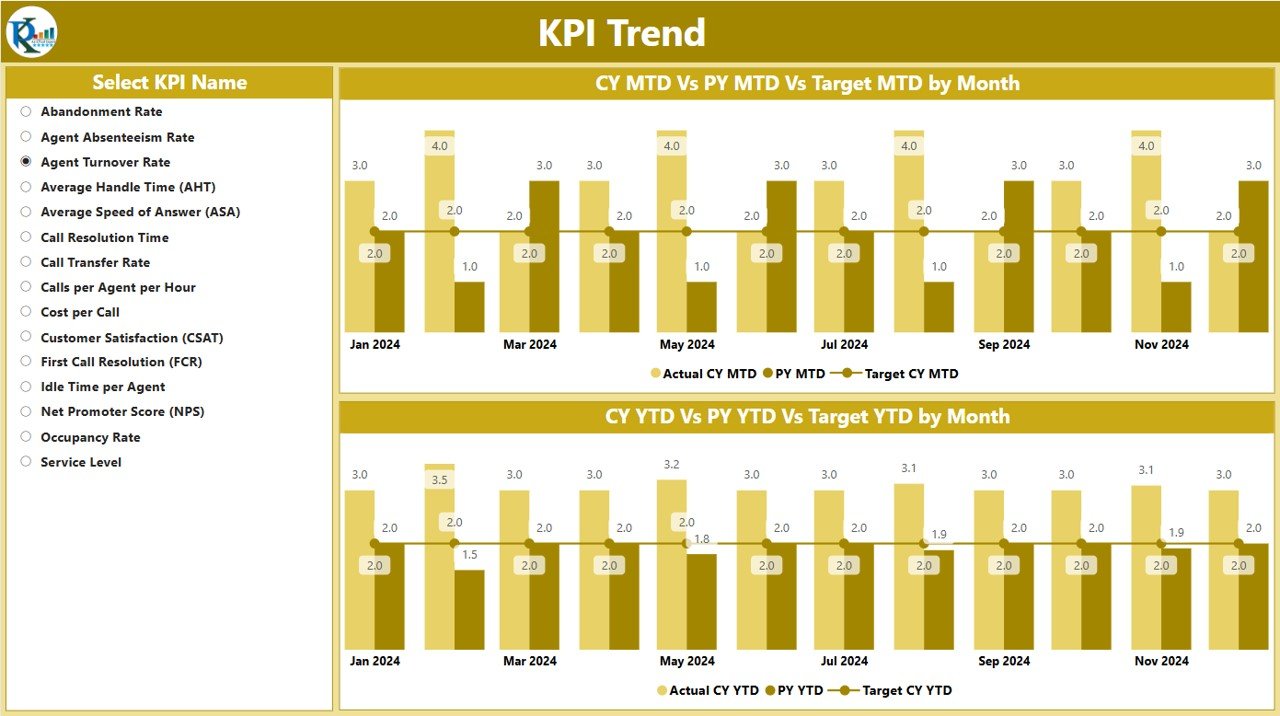
📈 Performance Trend Analysis
Visualize performance trends over time, comparing key metrics such as call volume and customer satisfaction. Identify patterns, measure improvements, and adjust strategies to improve efficiency.
🖥️ Interactive & Customizable Dashboard
Fully customizable, this Power BI dashboard allows you to filter data by agent, time period, or specific KPIs. Use dynamic charts, slicers, and graphs to drill down into performance data.
Why You’ll Love the Call Center KPI Dashboard in Power BI
✅ Improve Customer Service
Track and monitor the metrics that matter most to customer service, such as response times, wait times, and first-call resolution. Ensure your team is delivering an exceptional experience for every customer.
✅ Optimize Call Center Operations
Identify bottlenecks in call center operations and optimize staffing and workflows to improve efficiency. With real-time insights, you can make data-driven decisions to reduce wait times and increase service levels.
✅ Enhance Agent Performance
Use agent performance data to recognize top performers, identify training needs, and optimize the distribution of calls. Improve productivity and reduce burnout by ensuring an even workload distribution.
✅ Increase Customer Satisfaction
Use customer satisfaction metrics like NPS and CSAT to gauge customer sentiment and improve service quality. By tracking trends, you can proactively address issues and continuously improve the customer experience.
✅ Fully Customizable & Scalable
Tailor the dashboard to your call center’s unique needs. Whether managing a small team or a large-scale operation, this dashboard scales to fit your requirements.
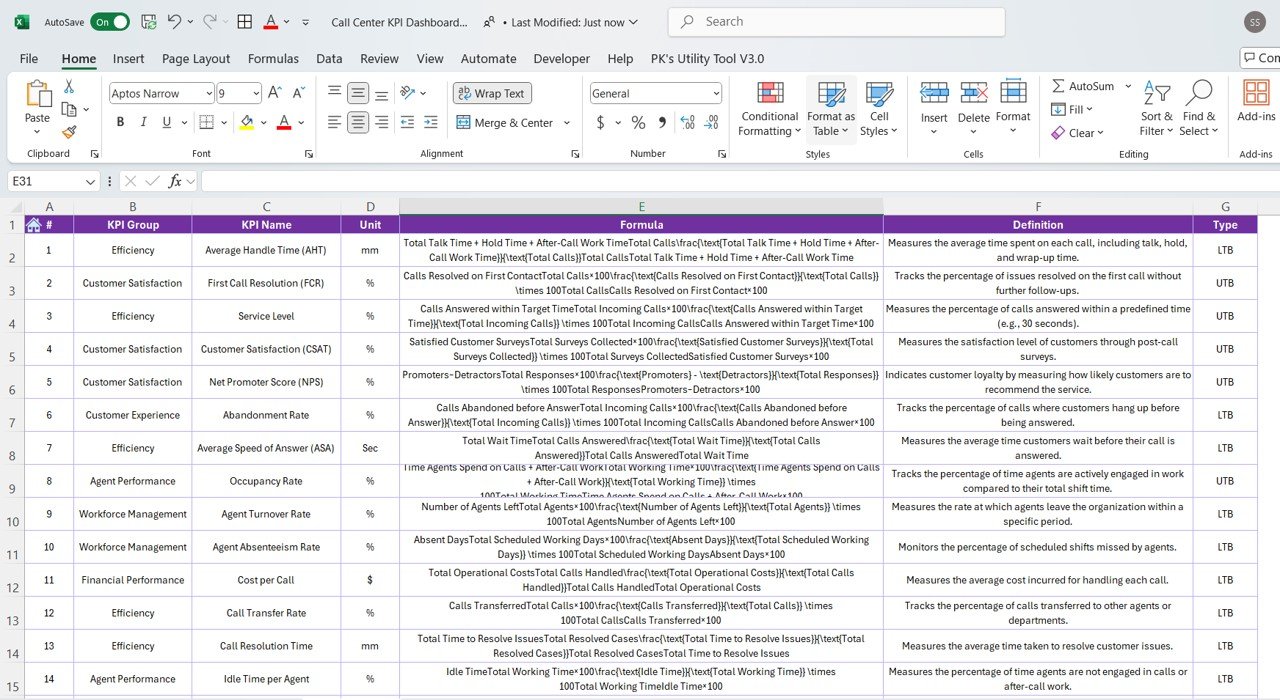
What’s Inside the Call Center KPI Dashboard Template in Power BI?
- Call Center Metrics Tracking: Track KPIs like call volume, response time, and resolution rates.
- Agent Performance Analysis: Monitor agent performance based on call handling and customer satisfaction.
- Customer Satisfaction Insights: Measure CSAT, NPS, and CES scores to gauge customer sentiment.
- Workload & Shift Monitoring: Optimize staffing levels by tracking shifts and workloads.
- Performance Trend Visualizations: Use visual reports to analyze trends in call center performance.
- Customizable Filters & Reports: Filter data by agent, time period, or specific KPI for more detailed insights.
How to Use the Call Center KPI Dashboard in Power BI
1️⃣ Download the Template: Get instant access to the Call Center KPI Dashboard in Power BI.
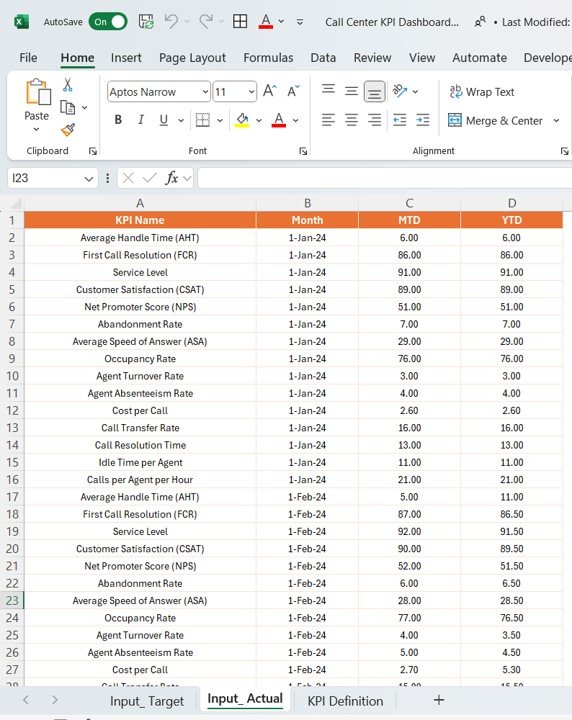
2️⃣ Input Your Call Center Data: Enter data on call volume, agent performance, and customer satisfaction.
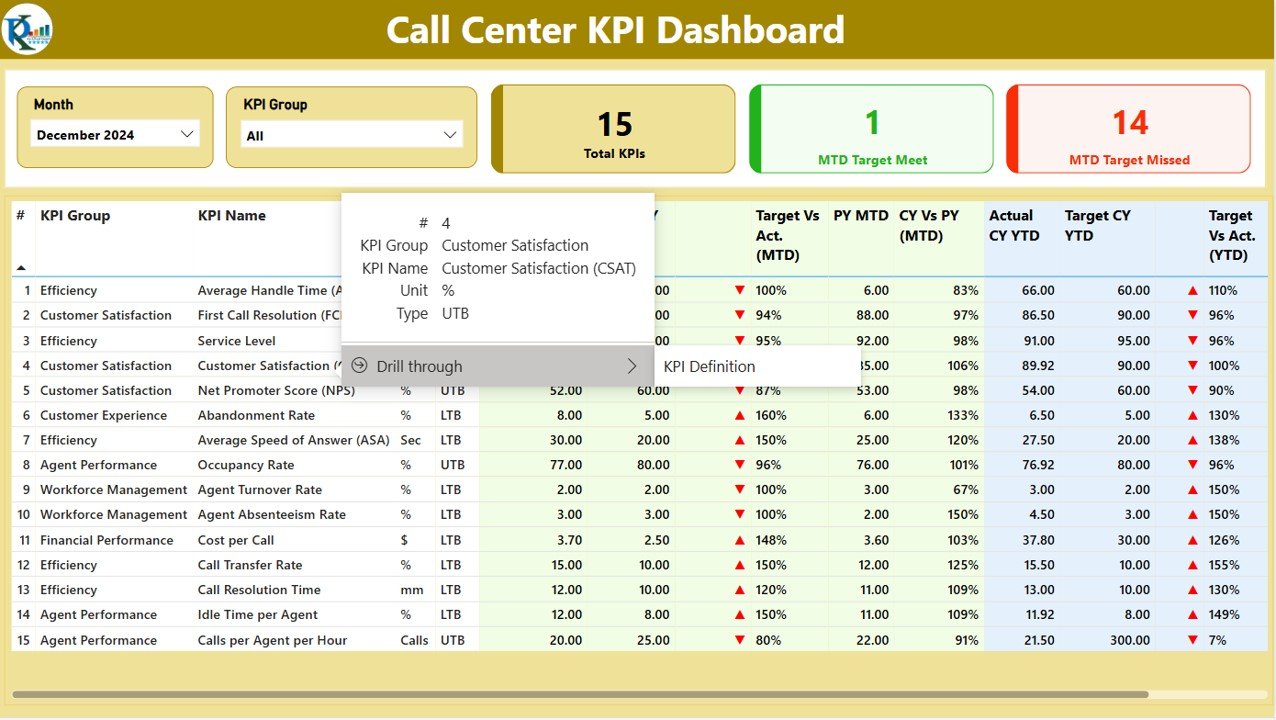
3️⃣ Track & Monitor KPIs: Use the dashboard to monitor KPIs such as call duration, resolution rate, and customer feedback.
4️⃣ Analyze Trends & Optimize Operations: Use trend analysis to identify opportunities for operational improvements.
5️⃣ Generate Reports & Insights: Easily generate reports on call center performance to share with stakeholders.
Who Can Benefit from the Call Center KPI Dashboard in Power BI?
🔹 Call Center Managers & Supervisors
🔹 Customer Service Teams
🔹 Operations Managers
🔹 HR & Training Teams
🔹 E-commerce & Retail Businesses with Customer Support
🔹 Companies Seeking to Optimize Customer Service Efficiency
Optimize your call center’s performance and enhance customer satisfaction with the Call Center KPI Dashboard in Power BI. Track agent performance, call volume, response times, and customer satisfaction to ensure that your team is providing the best service possible.
Click here to read the Detailed blog post
Visit our YouTube channel to learn step-by-step video tutorials
Youtube.com/@PKAnExcelExpert


Reviews
There are no reviews yet.