


Disability Support NGOs Dashboard in Excel helps NGO leaders turn beneficiary, service, funding, satisfaction, and branch records into decision-ready reporting across 7 Excel sheet tabs. The World Health Organization estimates that 1.3 billion people, about 16% of the global population, experience significant disability, so support programs need clear evidence for service coverage, case progress, donations, budgets, and regional delivery. This editable dashboard gives your team a one-time-purchase Excel reporting file with no SaaS subscription, no per-user template fee, and a practical structure for monthly program reviews.
Key Features of Disability Support NGOs Dashboard in Excel
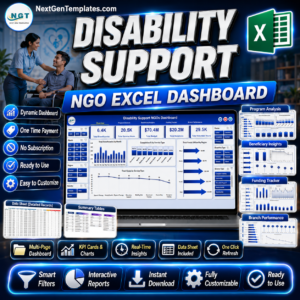
- 7 Excel sheet tabs: Overview Page, Program Analysis, Beneficiary Insights, Funding Tracker, Branch Performance, Data sheet, and Support sheet.
- 5 high-level KPI cards: Track Total Beneficiaries, Total Service Hours, Total Budget, Total Donations, and Total Volunteer Hours.
- Program and service analysis: Compare budget, hours, cases, satisfaction, disability type, and completion percentage across support programs.
- Funding visibility: Review donations, budget utilization, monthly budget movement, and cases by NGO branch.
- Branch performance views: Monitor beneficiaries, cases by program manager, and case status distribution.
- Interactive slicers: Filter dashboards quickly by available fields and review focused reports without rebuilding charts.
- Editable Excel file: Update sample data, refresh pivots, modify charts, and adapt the workbook to your NGO reporting process.
What’s Inside the Disability Support NGOs Dashboard in Excel
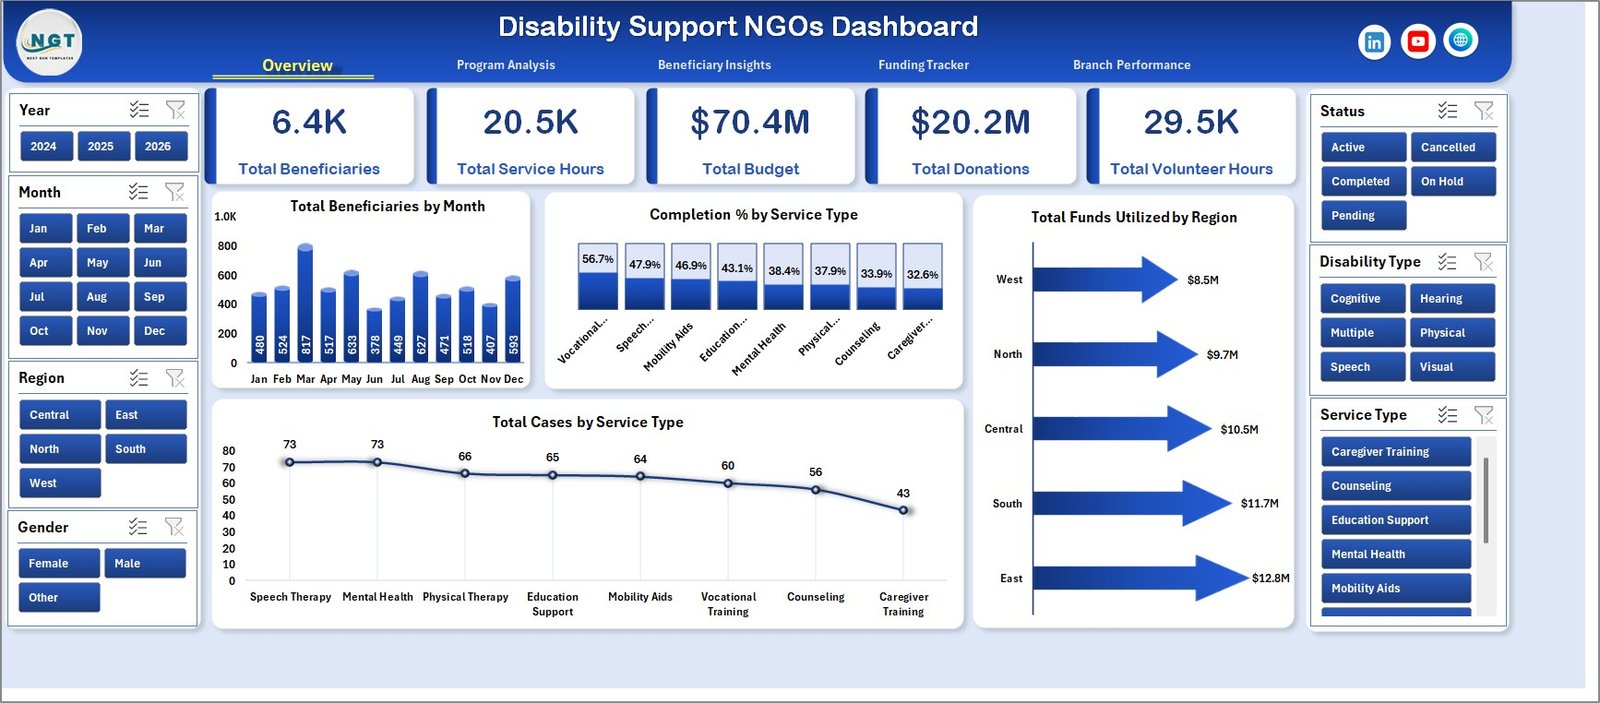
1. Overview Page
The Overview Page is the executive summary for disability support NGO operations. At the top, the cards show Total Beneficiaries, Total Service Hours, Total Budget, Total Donations, and Total Volunteer Hours so managers can quickly understand reach, workload, funding, and community contribution.
Total Beneficiaries by Month shows how beneficiary reach changes month by month. Use it to spot growth, seasonal changes, or months that need outreach review.
Completion % by Service Type compares how successfully each service type is completed. It helps program teams identify which support services need stronger follow-up or process improvement.
Total Funds Utilized by Region shows where funds are being used geographically. This helps leadership compare resource distribution with beneficiary need across regions.
Total Cases by Service Type counts cases by service category. It gives a fast view of which services create the highest operational demand.
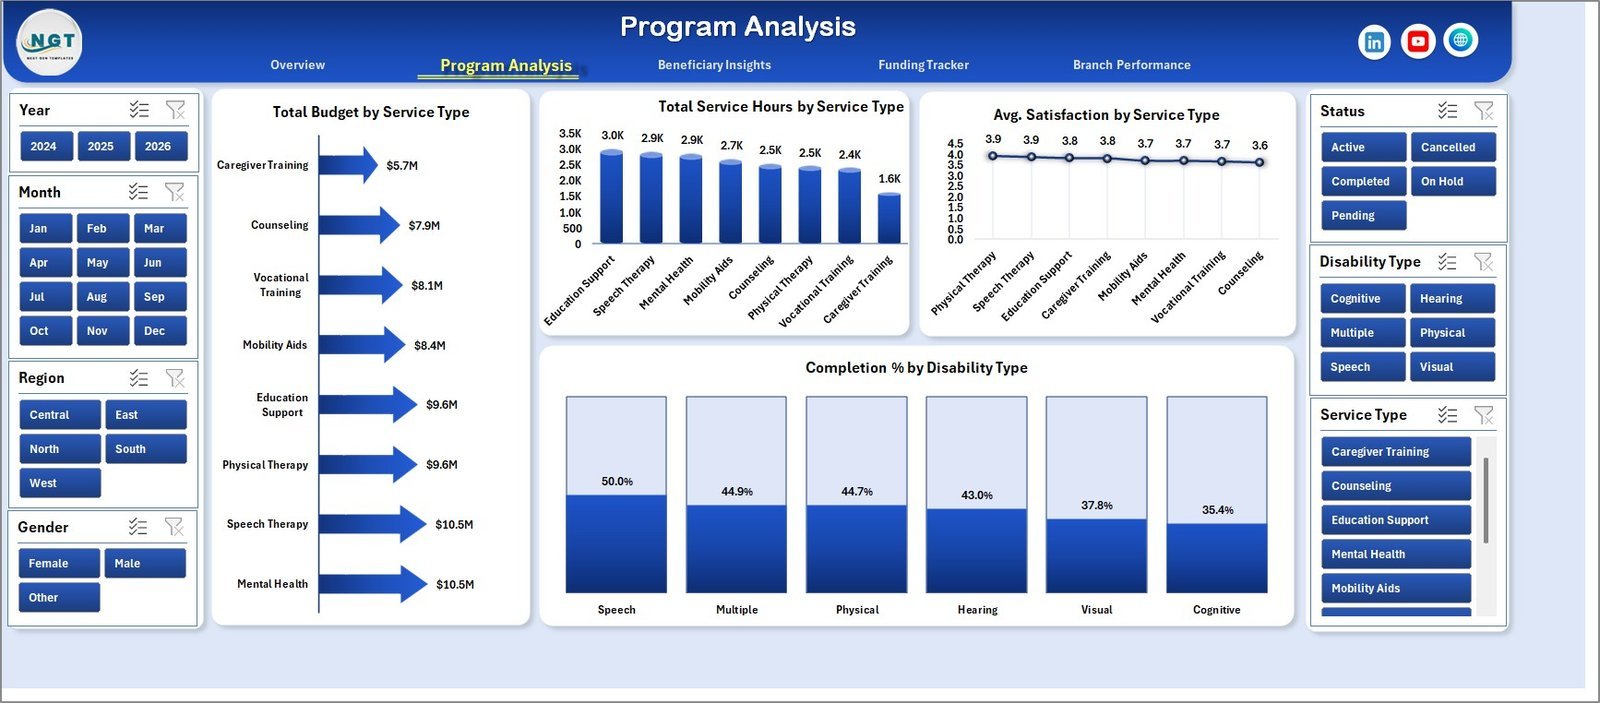
2. Program Analysis
The Program Analysis tab focuses on service-level performance and program mix.
Total Budget by Service Type compares allocated budget across support services. It helps managers see whether funding matches strategic priorities and demand.
Total Service Hours by Service Type shows effort spent by program area. This is useful for staff planning, volunteer allocation, and workload review.
Avg. Satisfaction by Service Type compares beneficiary satisfaction across service categories. It helps teams identify strong programs and services that may need quality improvement.
Completion % by Disability Type shows completion rates across disability categories. It supports inclusion-focused review and targeted intervention planning.

3. Beneficiary Insights
The Beneficiary Insights tab helps teams understand who is being served and how programs are experienced by different groups.
Total Beneficiaries by Age Group shows beneficiary distribution by age band. This supports age-specific planning for children, adults, and seniors.
Total Beneficiaries by Gender compares reach across gender groups. It helps NGOs review equity, participation, and outreach balance.
Avg. Satisfaction by Disability Type highlights satisfaction differences across disability categories. Use it to investigate whether certain groups need better service design.
Total Budget by Funding Source shows how funding sources support beneficiary programs. It helps teams understand donor dependency and funding diversity.

4. Funding Tracker
The Funding Tracker tab turns grant, donation, and budget data into a funding control view.
Total Donations by Funding Source compares donations by source. This helps fundraising teams identify major contributors and funding channels.
Budget Utilization % by Funding Source shows how much of each funding source has been used. It helps finance teams monitor spending pace and avoid underuse or overspend.
Total Budget by Month tracks budget movement over time. It is useful for monthly board reporting and funding-cycle review.
Total Cases by NGO Branch compares case load across branches. It helps leaders understand whether branch funding and branch demand are aligned.

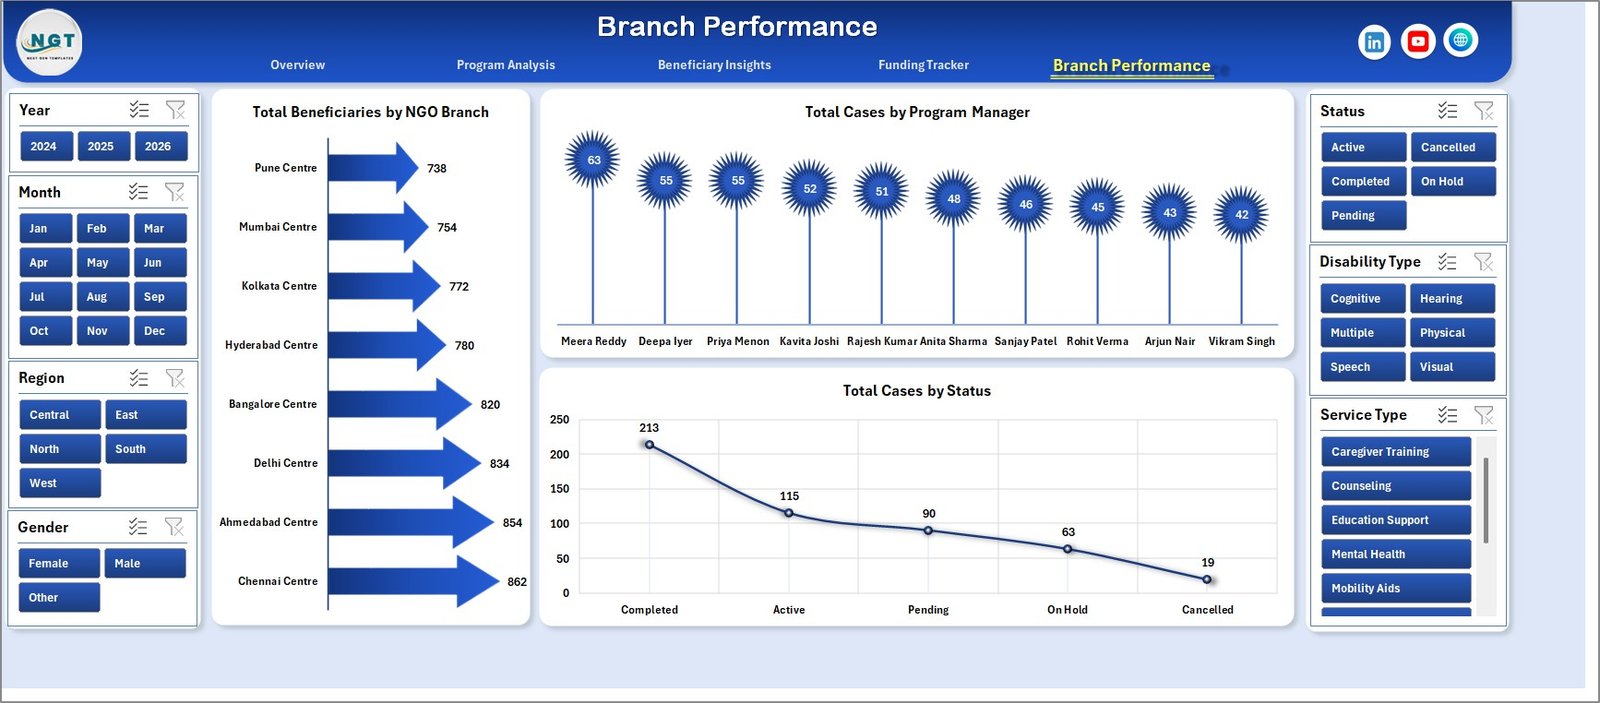
5. Branch Performance
The Branch Performance tab helps compare NGO branch delivery and case management activity.
Total Beneficiaries by NGO Branch compares beneficiary reach by location. It helps managers see which branches serve the largest population.
Total Cases by Program Manager shows case ownership by manager. It supports workload balancing, coaching, and accountability reviews.
Total Cases by Status summarizes open, completed, pending, or other case stages. It helps teams identify bottlenecks and follow-up priorities.
6. Data Sheet Tab
The Data sheet is where you enter or replace the sample records in the same format. Keep the column layout unchanged, add your own NGO program data, and then refresh the workbook to update the dashboard.

7. Support Sheet Tab
The Support sheet contains the pivot tables used to make the dashboard dynamic. After updating the Data sheet, go to the Data tab in the Excel ribbon and click Refresh All; the pivot tables and charts will refresh, and you can keep this sheet hidden during normal use.

Disability Support NGOs Dashboard in Excel vs. Google Sheets vs. Paid Nonprofit SaaS – Where This Fits
| Feature | This Excel dashboard | Google Sheets alternative | Paid nonprofit SaaS |
|---|---|---|---|
| Cost | $17.99 one-time | One-time template or manual build | Monthly or annual subscription |
| Platform | Microsoft Excel | Google Sheets | Vendor web app |
| Setup time | Replace data and refresh pivots | Build or copy sheets | Implementation and onboarding |
| Customizable fields | Fully editable workbook | Editable sheet | Limited by vendor settings |
| Funding and program views | Built in | Must be configured | Depends on plan |
| Year-1 cost at 5 users | $17.99 plus Excel licensing | Template cost plus workspace costs | Often hundreds or thousands |
Who This Template Is For – and Who It’s Not For
This template is for disability support NGOs, nonprofit program teams, branch managers, service coordinators, grant reporting teams, volunteer managers, and consultants who need a clear Excel reporting layer for beneficiaries, budgets, donations, cases, service hours, and satisfaction. It is not a donor CRM, case management system, accounting system, appointment system, or secure beneficiary database.
How to Use the Disability Support NGOs Dashboard in Excel
- Download and unzip the product file.
- Open the workbook in Microsoft Excel.
- Go to the Data sheet and replace the sample records with your own records in the same format.
- Go to the Excel Data ribbon and click Refresh All.
- Review the Overview, Program Analysis, Beneficiary Insights, Funding Tracker, and Branch Performance tabs.
- Use slicers to filter the dashboard for a specific month, region, branch, service type, funding source, or manager where available.
Real-World Use Cases
Amina, NGO program director: Amina uses the Overview Page before monthly board meetings to explain beneficiary reach, service hours, donations, and total budget in one view.
Ravi, branch coordinator: Ravi checks Branch Performance to compare case status and manager workload before assigning follow-up actions.
Sofia, grants analyst: Sofia uses Funding Tracker to review donations by funding source and budget utilization before preparing donor updates.
Frequently Asked Questions
What does this dashboard track?
It tracks beneficiaries, service hours, budgets, donations, volunteer hours, cases, service types, disability types, satisfaction, funding sources, branches, program managers, regions, and status.
Do I need advanced Excel skills?
No. You mainly replace the sample data and refresh the workbook. Basic Excel familiarity is enough for normal use.
Can I customize the dashboard?
Yes. You can edit labels, charts, pivot tables, colors, formulas, and the Data sheet structure if your team needs a different layout.
Does it store confidential beneficiary records securely?
The file is a local Excel workbook. Your organization is responsible for privacy, access control, and secure storage of beneficiary data.
Can this replace nonprofit CRM software?
No. It is a reporting dashboard, not a donor CRM, accounting system, or full case management platform.
How do I refresh the dashboard?
After updating the Data sheet, go to the Data tab in Excel and click Refresh All. The pivot tables and charts will update from the new data.
About the Author
Built by PK – Microsoft Certified Professional with 15+ years of Excel, Google Sheets, and Power BI experience. Founder of NextGenTemplates, reaching 300K+ subscribers across YouTube channels. Every template is hand-built and tested before release.
Explore Related Templates
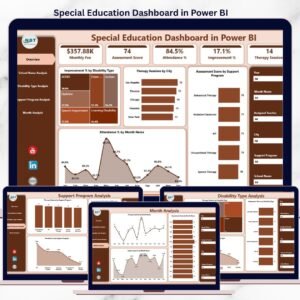
You may also like Special Education Dashboard in Power BI and Digital Microloans Dashboard in Power BI. Browse more MS Excel templates and Excel dashboard templates.
Download the Disability Support NGOs Dashboard in Excel today and turn NGO program data into clear Excel reporting.
Last updated: June 2026
Watch the step-by-step video tutorial:


Reviews
There are no reviews yet.