
Key Features of Space Education Programs KPI Dashboard in Power BI
Unlock the full potential of your space education initiatives with the Space Education Programs KPI Dashboard in Power BI. This ready-to-use digital product is designed to simplify monitoring and analyzing your Key Performance Indicators (KPIs) effortlessly. Easily update your data via the provided Excel file, connect it to the Power BI dashboard, and refresh to get the latest insights instantly. This dynamic dashboard comes with three powerful pages tailored to give you a comprehensive understanding of your program’s performance.
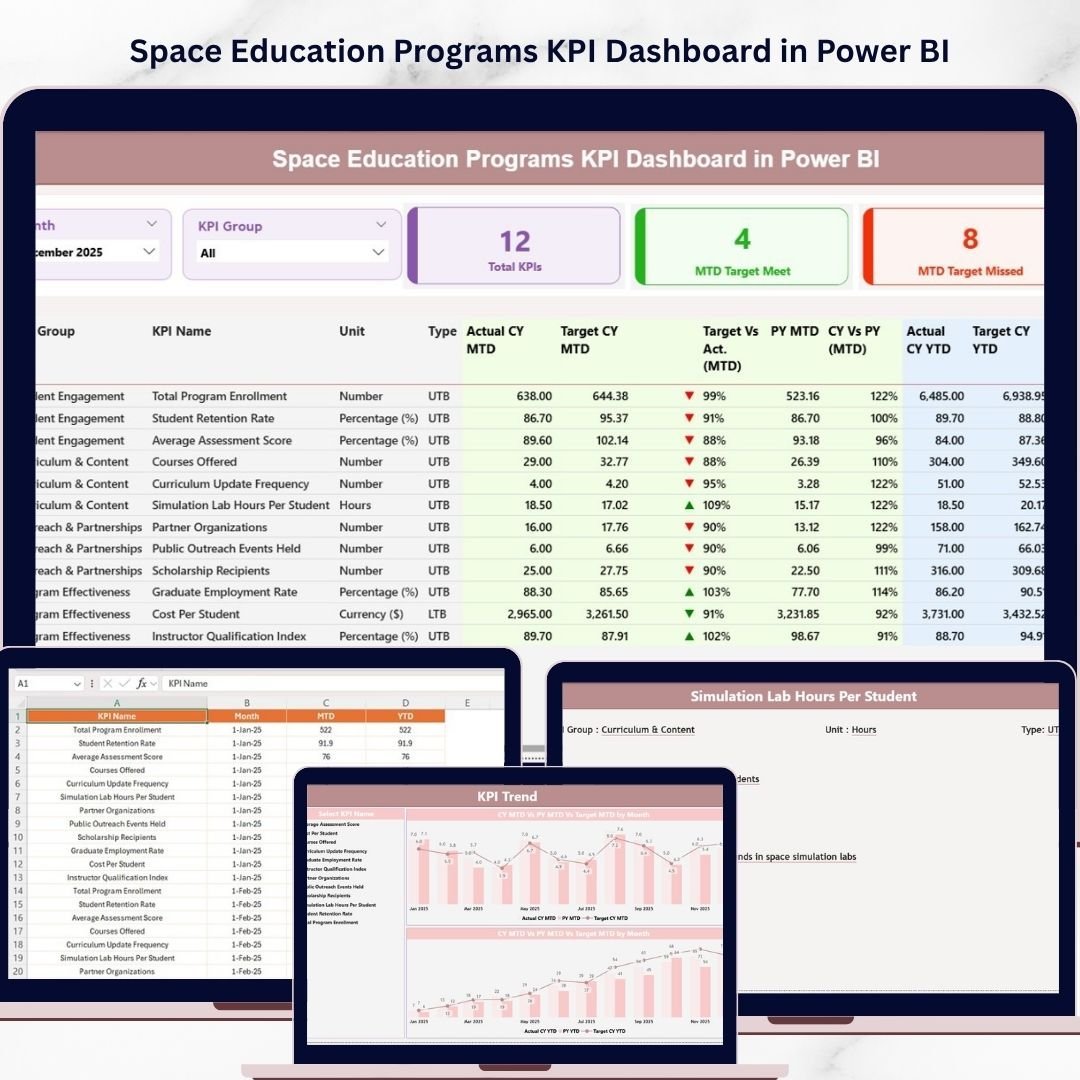
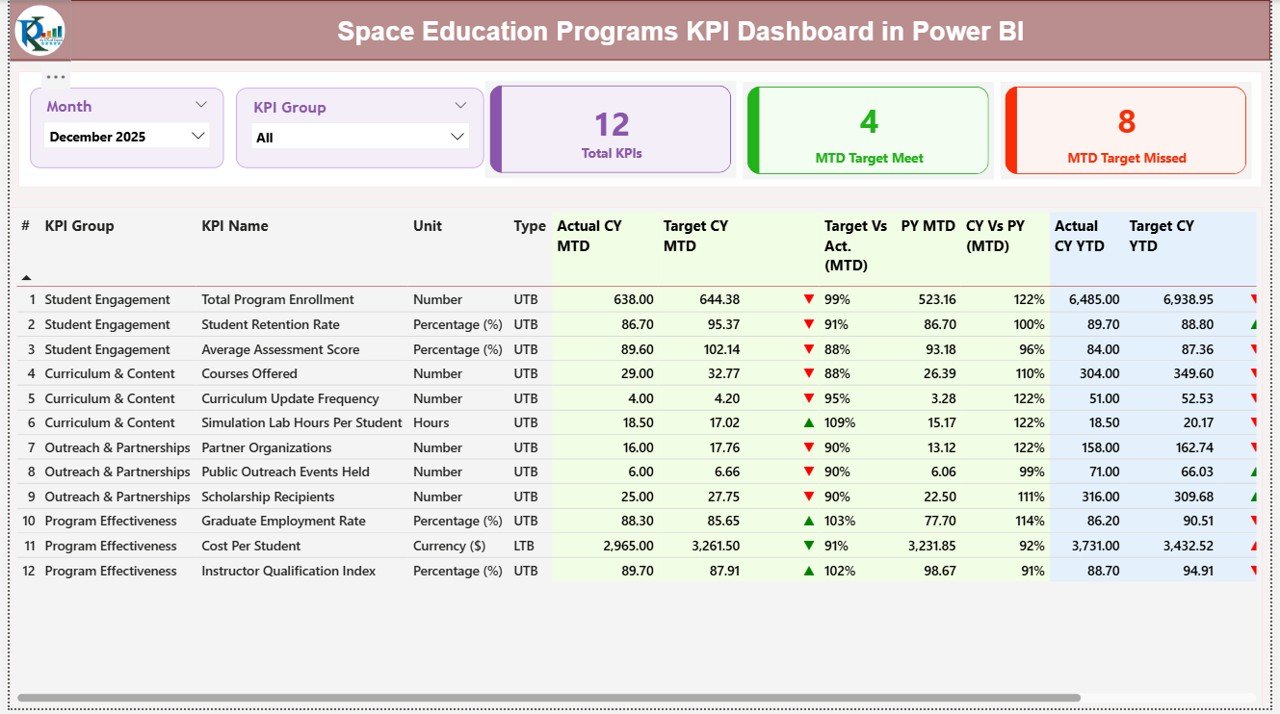
- 📊 Summary Page: The heart of the dashboard featuring Month and KPI Group slicers for quick filtering. View essential metrics such as Total KPIs count, MTD (Month-to-Date) Target Met, and MTD Target Missed KPIs. A detailed table displays each KPI’s number, group, name, unit, type (LTB or UTB), and real-time values including Actual CY MTD, Target CY MTD, MTD status icons, Target vs Actual percentages, comparisons with Previous Year (PY) MTD, as well as Year-to-Date (YTD) equivalents with visual status indicators.
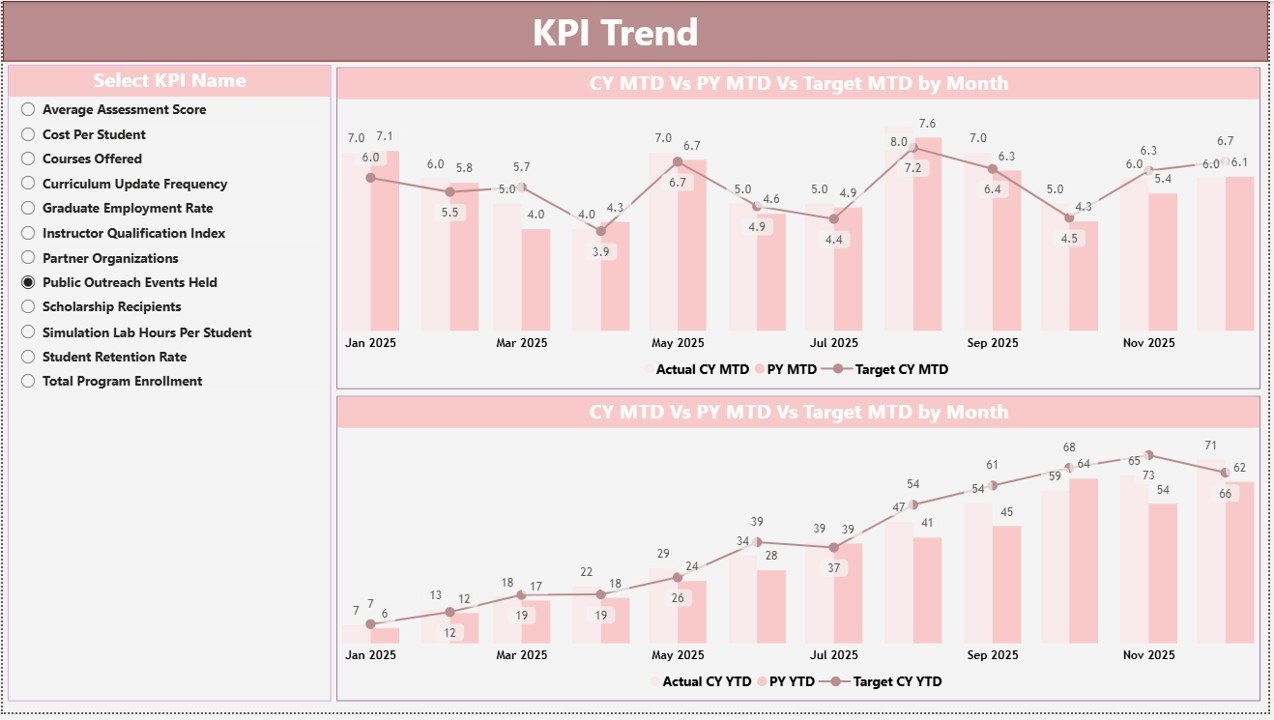
- 📈 KPI Trend Page: Visualize trends with two combo charts comparing Actual Numbers for Current Year, Previous Year, and Targets for both MTD and YTD. The KPI name slicer lets you focus on specific indicators to uncover patterns and performance shifts over time.
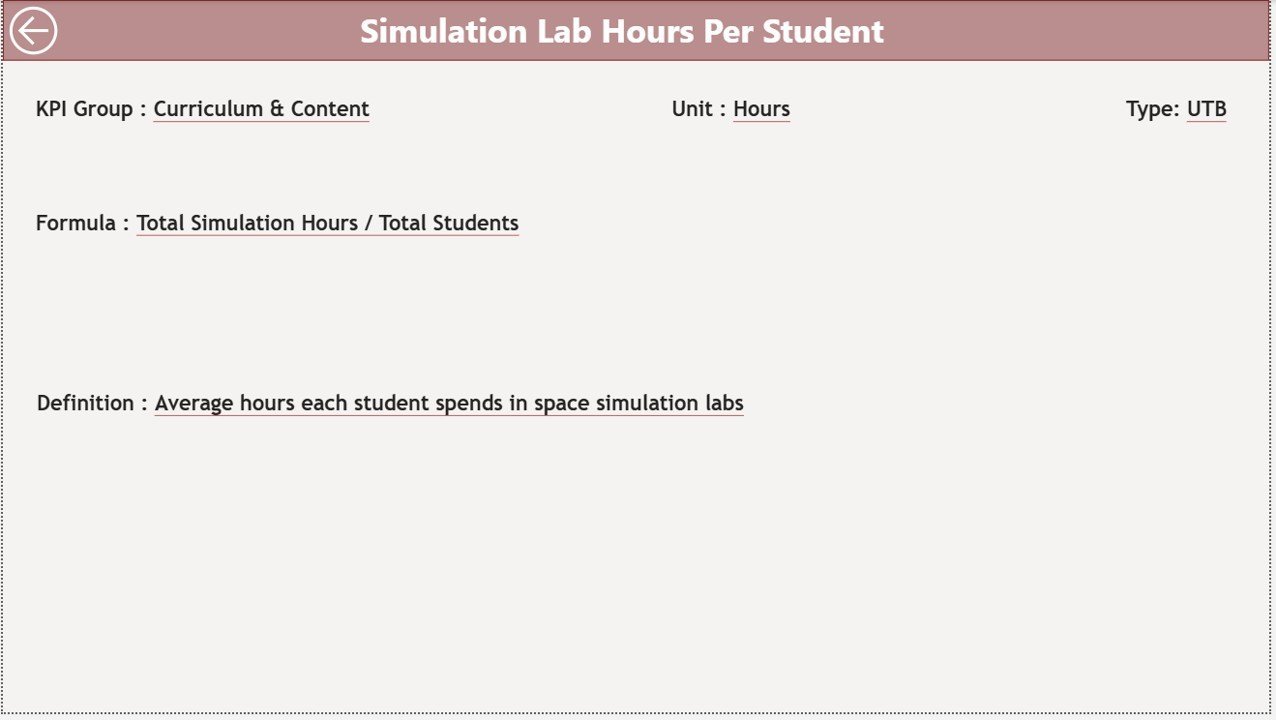
- 📖 KPI Definition Page: A hidden drill-through page that offers detailed KPI definitions, formulas, and context. Easily accessible via the summary page, it allows you to delve deeper into each KPI’s meaning and calculation logic, making data interpretation straightforward.
What’s Inside the Space Education Programs KPI Dashboard in Power BI
This comprehensive package includes:
- 🗂️ A Power BI desktop file featuring three interactive pages (Summary, KPI Trend, KPI Definition).
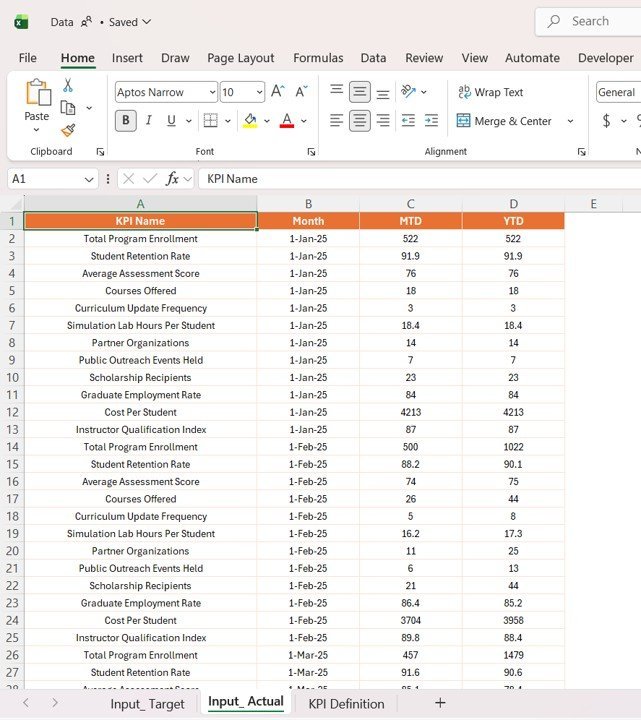
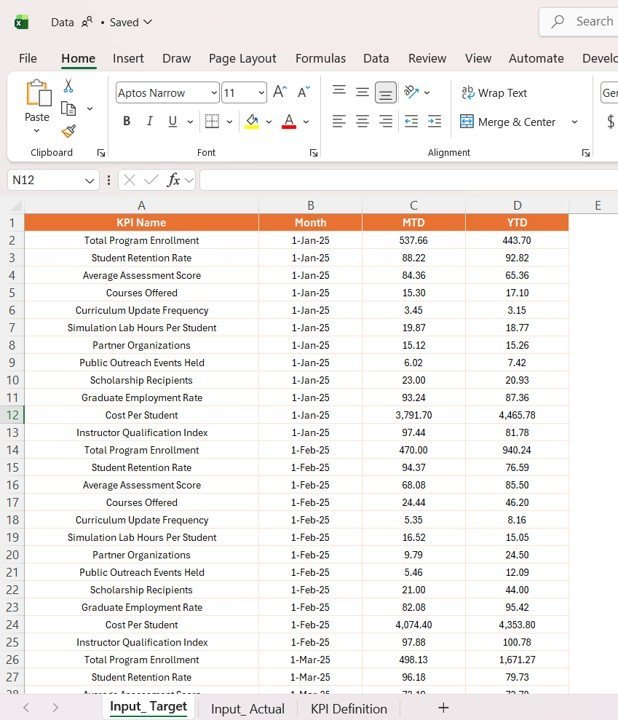
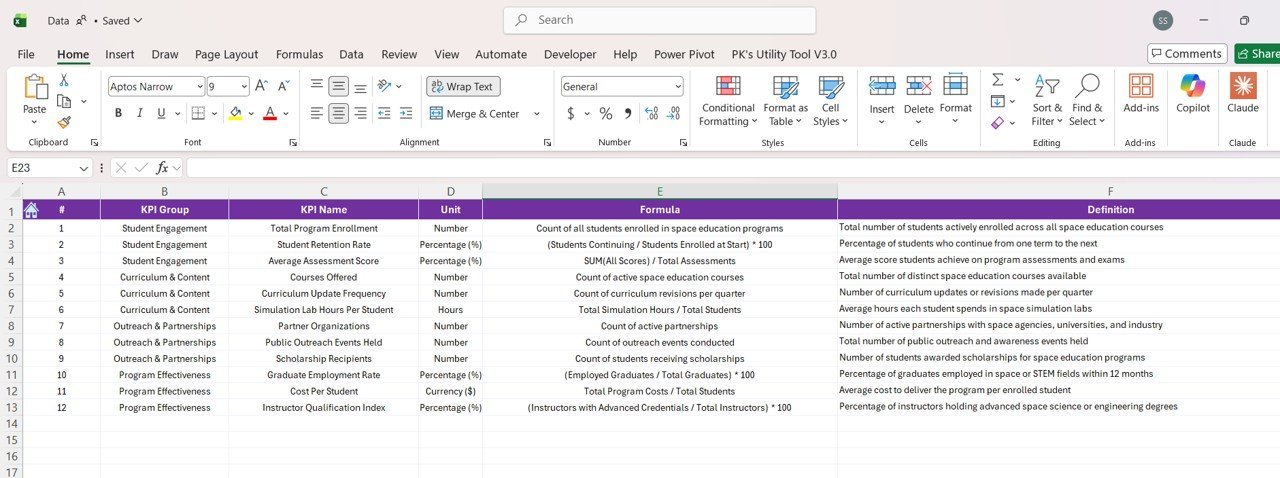
- 📊 An Excel data source with three worksheets: Input_Actual for filling actual KPI values, Input_Target for target values, and KPI_Definition to document KPI details like number, group, unit, formula, and type.
- 🔄 Easy data refresh capability – simply update your Excel file, connect it to the Power BI dashboard, and hit refresh to see updated insights instantly.
- 🎨 Clean, user-friendly design with intuitive visuals, color-coded icons, and slicers for seamless interaction.
How to Use the Space Education Programs KPI Dashboard in Power BI
Getting started is easy and requires no advanced technical skills:
- 📥 Download the Power BI and Excel files.
- ✍️ Fill your KPI actuals and targets in the respective Excel tabs, ensuring dates use the first day of each month.
- 🔗 Open the Power BI file and connect it to your updated Excel data source.
- 🔄 Hit the “Refresh” button on the Home tab to update the dashboard with your latest data.
- 🖱️ Use slicers on the Summary and KPI Trend pages to filter and analyze specific KPIs or time periods.
- 📊 Drill through from the Summary page to the KPI Definition page for detailed KPI insights.
- 🔙 Use the back button on the KPI Definition page to return to the main dashboard easily.
Who Can Benefit from This Space Education Programs KPI Dashboard in Power BI
This digital product is perfect for:
- 🚀 Space education administrators aiming to track program effectiveness and outcomes efficiently.
- 🎓 Educators and curriculum planners who need to monitor educational KPIs for continuous improvement.
- 📈 Data analysts and BI professionals seeking a ready-made dashboard template tailored to space education KPIs.
- 🏫 Educational institutions managing multiple KPIs across various programs and needing consolidated visual reporting.
- 🛠️ Project managers overseeing space education initiatives who require clear, actionable data insights.
With its user-friendly approach and detailed insights, this KPI dashboard empowers users to make data-driven decisions confidently, boosting the success of space education programs.
Click here to read the Detailed blog post.
Visit our YouTube channel to learn step-by-step video tutorials.


Reviews
There are no reviews yet.