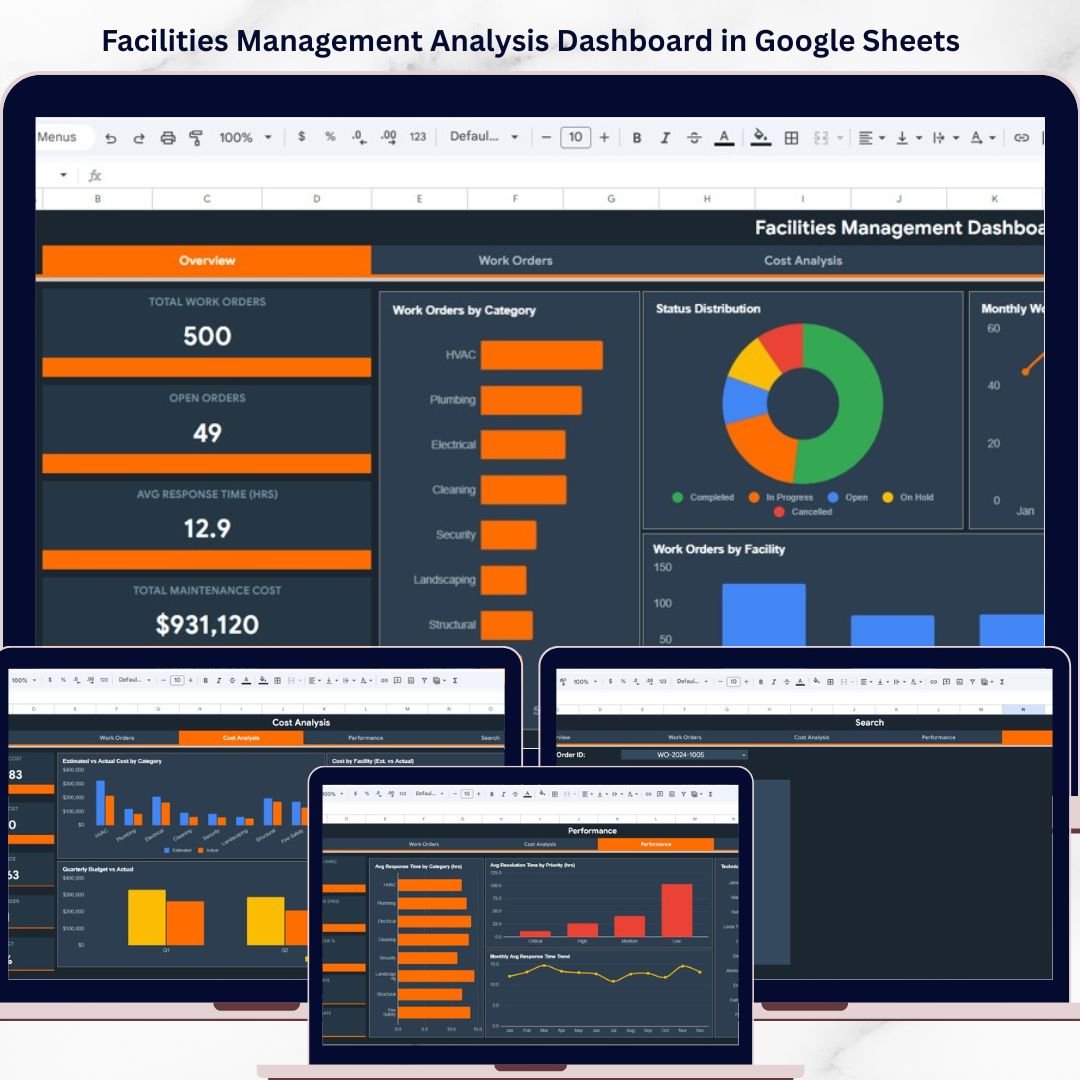


Facilities Management Analysis Dashboard in Google Sheets is a powerful ready-to-use analytics solution designed to help organizations monitor building operations, track maintenance activities, analyze operational costs, and evaluate workforce performance across multiple facilities. Whether you manage office buildings, commercial properties, or industrial complexes, this dashboard consolidates all critical facilities data into one centralized and interactive platform.
Organizations that manage multiple buildings or large facilities often struggle with scattered data across different spreadsheets and manual reports. Tracking work orders, monitoring response times, analyzing maintenance costs, and evaluating technician performance becomes extremely difficult without a structured reporting system. This Facilities Management Analysis Dashboard in Google Sheets solves this challenge by transforming raw operational data into clear visual insights through interactive charts, KPI cards, and advanced data filters.
Because the dashboard runs entirely in Google Sheets, teams can collaborate in real time, access the dashboard from anywhere, and update facilities data effortlessly. Interactive slicers allow users to filter data by facility, building, category, priority, and time period for targeted analysis.
🔑 Key Features of Facilities Management Analysis Dashboard in Google Sheets
📊 Interactive Facilities Analytics Dashboard – Monitor building operations, work orders, maintenance costs, and performance metrics through visually rich charts and KPI indicator cards that update dynamically based on your data filters.
🔍 Advanced Multi-Level Data Filters – Filter facilities data by facility location, building, floor, category, sub-category, priority, and status to drill down into specific operational scenarios and identify patterns quickly.
📈 Comprehensive KPI Monitoring – Track critical facilities metrics including Total Work Orders, Open Orders, Avg Response Time, Total Maintenance Cost, Completion Rate, Critical Orders, Budget Variance, On-Time Completion %, and First-Time Fix Rate in one centralized view.
🏢 Multi-Facility Performance Comparison – Compare operational performance across different facilities and buildings to identify which locations require more attention or resources.
💰 Cost Analysis and Budget Tracking – Analyze estimated vs actual maintenance costs by category and facility, track quarterly budget vs actual spending, and monitor cost efficiency metrics to optimize budget allocation.
⚡ Technician Workload and Performance Tracking – Monitor technician workloads, completed orders, response times by category, and resolution times by priority to optimize workforce allocation.
🔄 Automated Chart and KPI Updates – Once you enter or update data in the data sheet, all dashboard charts, KPI cards, and analysis pages refresh automatically without any manual intervention.
📋 Work Order Search and Lookup – A dedicated search page allows users to quickly find specific work orders by selecting the Work Order ID and viewing all related details instantly.
📦 What’s Inside the Facilities Management Analysis Dashboard in Google Sheets
This template includes 6 powerful worksheets designed to provide a complete view of facilities management performance.
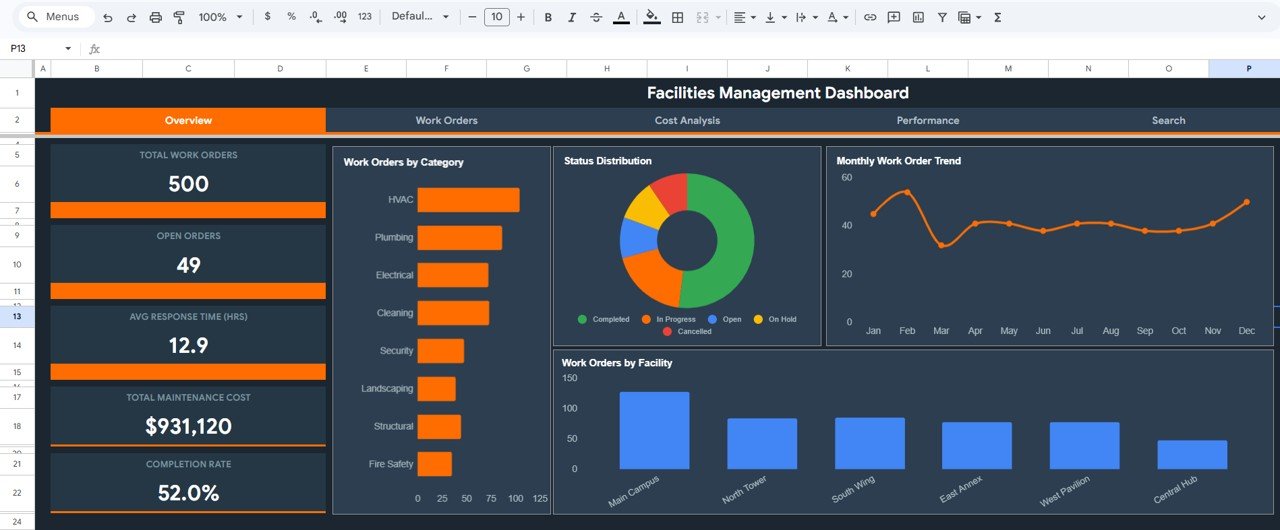
 Facilities Management Analysis Dashboard in Google Sheets
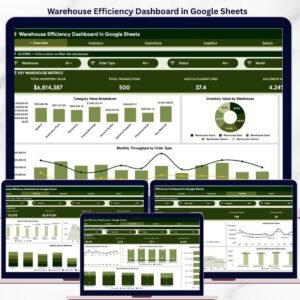
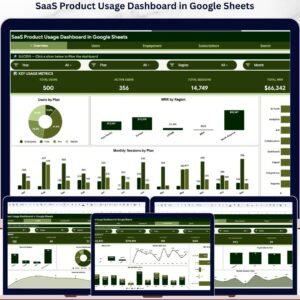
📊 1 – Overview Page – The main dashboard page displays high-level KPI cards showing Total Work Orders, Open Orders, Avg Response Time (HRS), Total Maintenance Cost, and Completion Rate. Below the cards, interactive charts present Work Orders by Category, Status Distribution, Monthly Work Order Trend, and Work Orders by Facility. Multiple slicers allow you to quickly filter and analyze the dashboard.
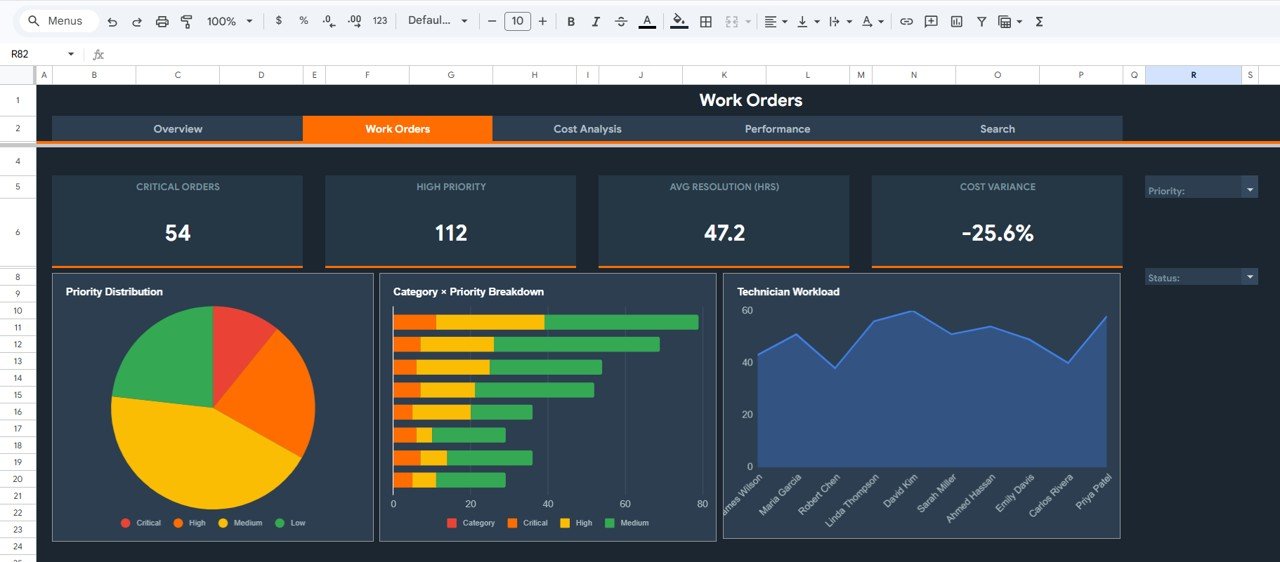 Work Orders Analysis Page
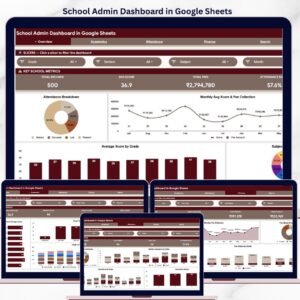
🔧 2 – Work Orders Page – Provides detailed analysis of work order operations including Critical Orders count, High Priority count, Avg Resolution Time (HRS), and Cost Variance. Charts display Priority Distribution, Category by Priority Breakdown, and Technician Workload analysis to help managers optimize maintenance operations.
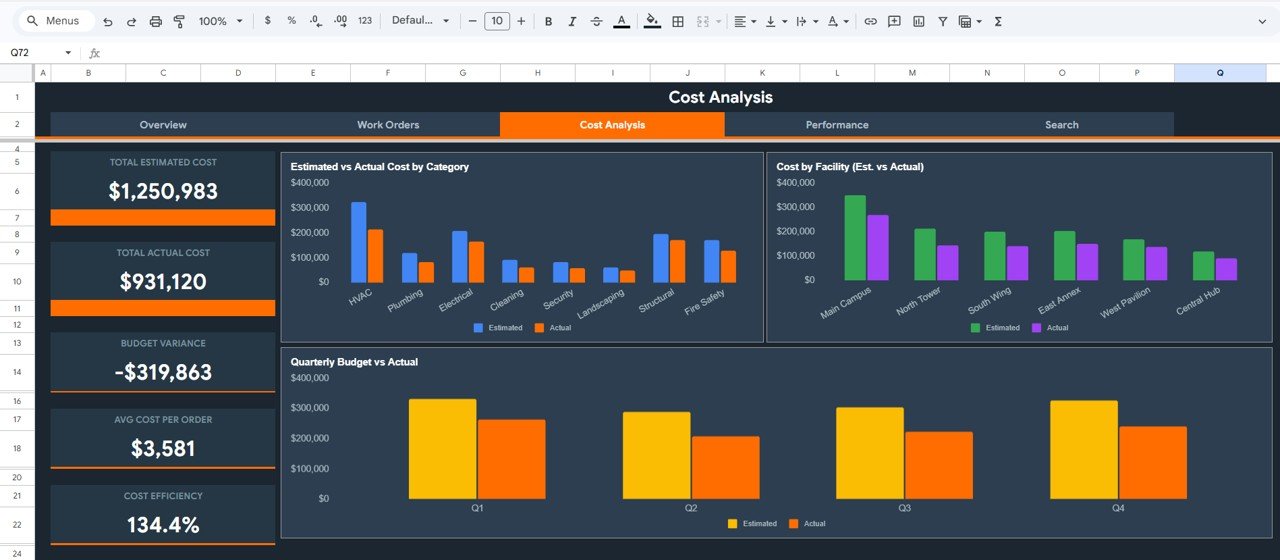
 Cost Analysis Page
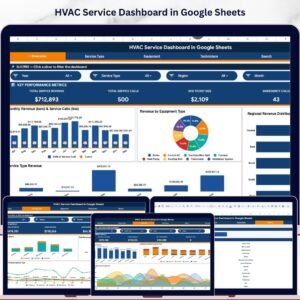
💰 3 – Cost Analysis Page – Tracks Total Estimated Cost, Total Actual Cost, Budget Variance, Avg Cost Per Order, and Cost Efficiency. Visual charts display Estimated vs Actual Cost by Category, Cost by Facility (Est. vs Actual), and Quarterly Budget vs Actual for comprehensive financial monitoring.
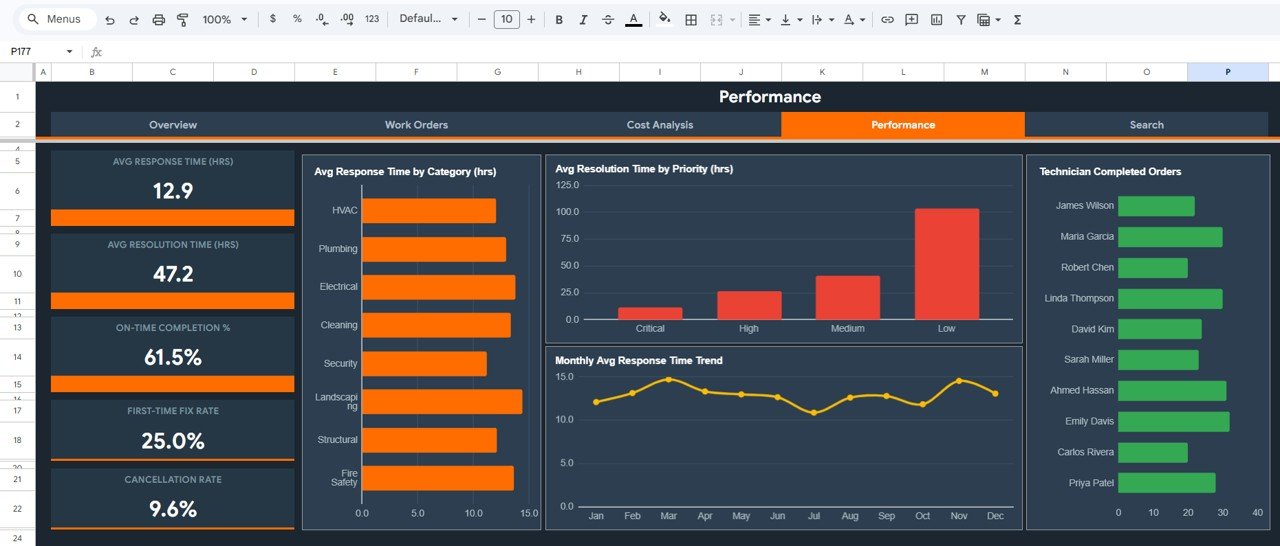 Performance Page
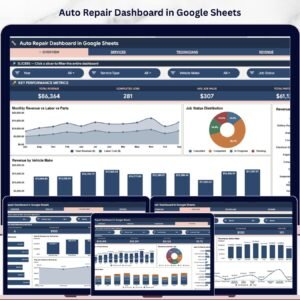
📈 4 – Performance Page – Monitors Avg Response Time (HRS), Avg Resolution Time (HRS), On-Time Completion %, First-Time Fix Rate, and Cancellation Rate. Charts show Avg Response Time by Category, Avg Resolution Time by Priority, Monthly Avg Response Time Trend, and Technician Completed Orders for workforce evaluation.
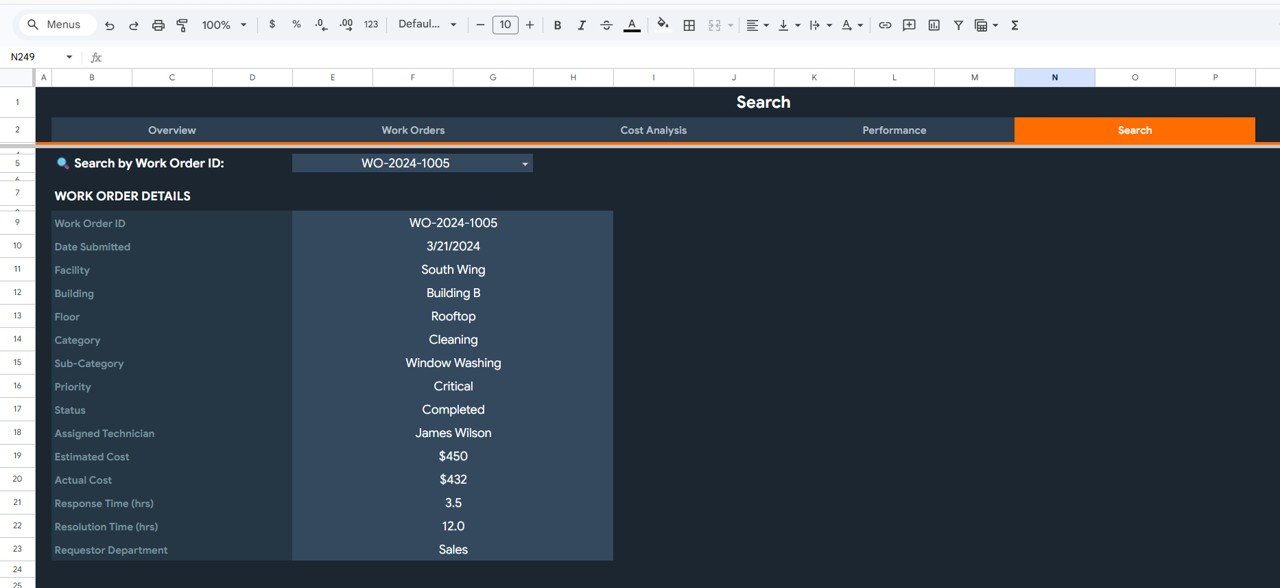
 Search Sheet tab
🔎 5 – Search Page – A dedicated search sheet where you can look up any specific work order by selecting the Work Order ID from a dropdown. Once selected, all details are displayed including Facility, Building, Floor, Category, Sub-Category, Priority, Status, Assigned Technician, Estimated Cost, Actual Cost, Response Time, Resolution Time, and Requestor Department.
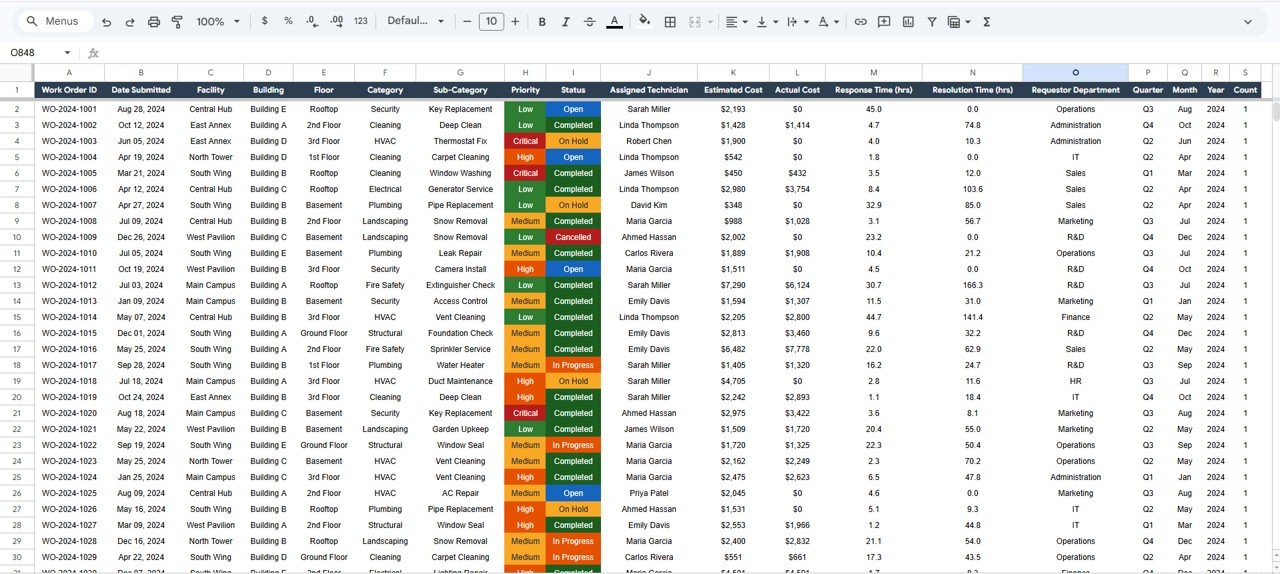 Data Sheet tab
📋 6 – Data Sheet – This is the raw data input sheet where you enter all facilities management records. Simply add your operational data in the same structured format and the entire dashboard updates automatically.
⚙️ How to Use the Facilities Management Analysis Dashboard in Google Sheets
1️⃣ Open the template in Google Sheets and navigate to the Data Sheet.
2️⃣ Enter your facilities management data including work orders, maintenance records, costs, technician assignments, and building information in the same format.
3️⃣ Navigate to the Overview Page to see all KPI cards and summary charts update automatically.
4️⃣ Use the interactive slicers to filter data by facility, category, priority, or status.
5️⃣ Explore the Work Orders, Cost Analysis, and Performance pages for deeper insights.
6️⃣ Use the Search Page to quickly look up any work order by selecting the Work Order ID from the dropdown.
👥 Who Can Benefit from This Facilities Management Analysis Dashboard in Google Sheets
🏢 Facilities Managers – Monitor building operations, work orders, and maintenance activities across multiple locations.
🔧 Maintenance Teams – Track work orders, response times, resolution times, and preventive maintenance compliance.
💼 Property Management Companies – Analyze operational costs, budget variance, and asset performance across managed properties.
📊 Operations Directors – Evaluate facility efficiency, technician workloads, and identify cost-saving opportunities.
🏗️ Building Owners – Track maintenance spending, cost efficiency, and on-time completion rates.
🏭 Industrial Facility Operators – Monitor equipment maintenance, technician performance, and operational efficiency.
📖 Click here to read the Detailed Blog Post
Watch the step-by-step video tutorial:


Reviews
There are no reviews yet.