
Running an edutainment park is all about balancing fun, education, and profitability. However, tracking visitor trends, monitoring revenue, and managing operational KPIs across multiple reports can quickly become overwhelming.
Edutainment Parks KPI Dashboard in Power BI — a powerful, interactive solution designed to simplify performance tracking and help you make smarter business decisions.
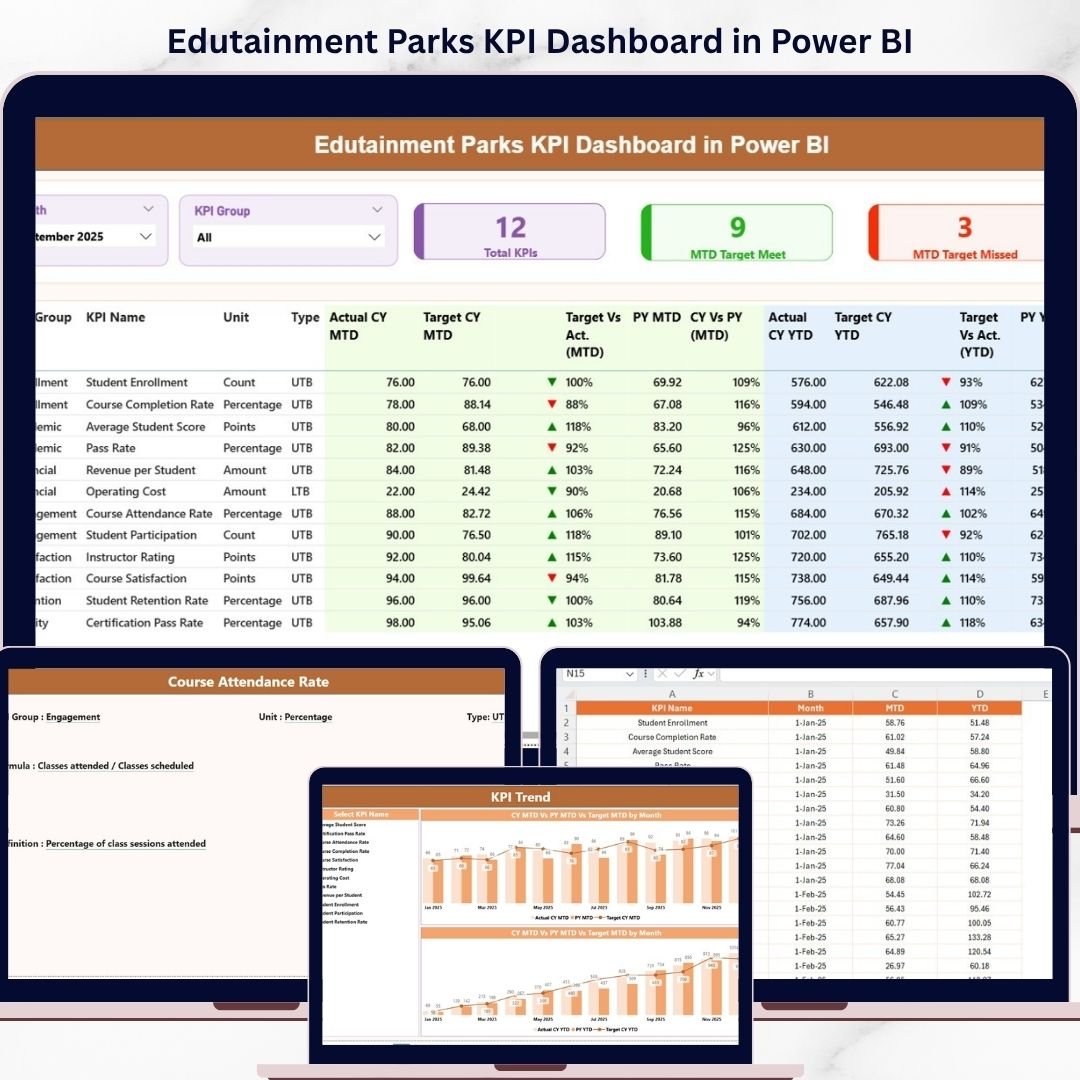
This ready-to-use dashboard brings all your key performance indicators into one centralized view. Instead of juggling spreadsheets, you can now monitor KPIs, compare targets, and analyze trends in real time. As a result, you gain full control over your park’s performance and improve both customer experience and profitability.
🚀 Key Features of Edutainment Parks KPI Dashboard in Power BI
📊 Centralized KPI Dashboard – Track all KPIs in one dynamic and interactive interface.
📅 MTD & YTD Performance Analysis – Compare Actual, Target, and Previous Year data.
📈 Interactive Trend Analysis – Visualize performance trends using dynamic charts.
🔺 Performance Indicators – Identify KPI gaps instantly using visual icons.
🎯 Advanced Slicers & Filters – Filter data by month and KPI group effortlessly.
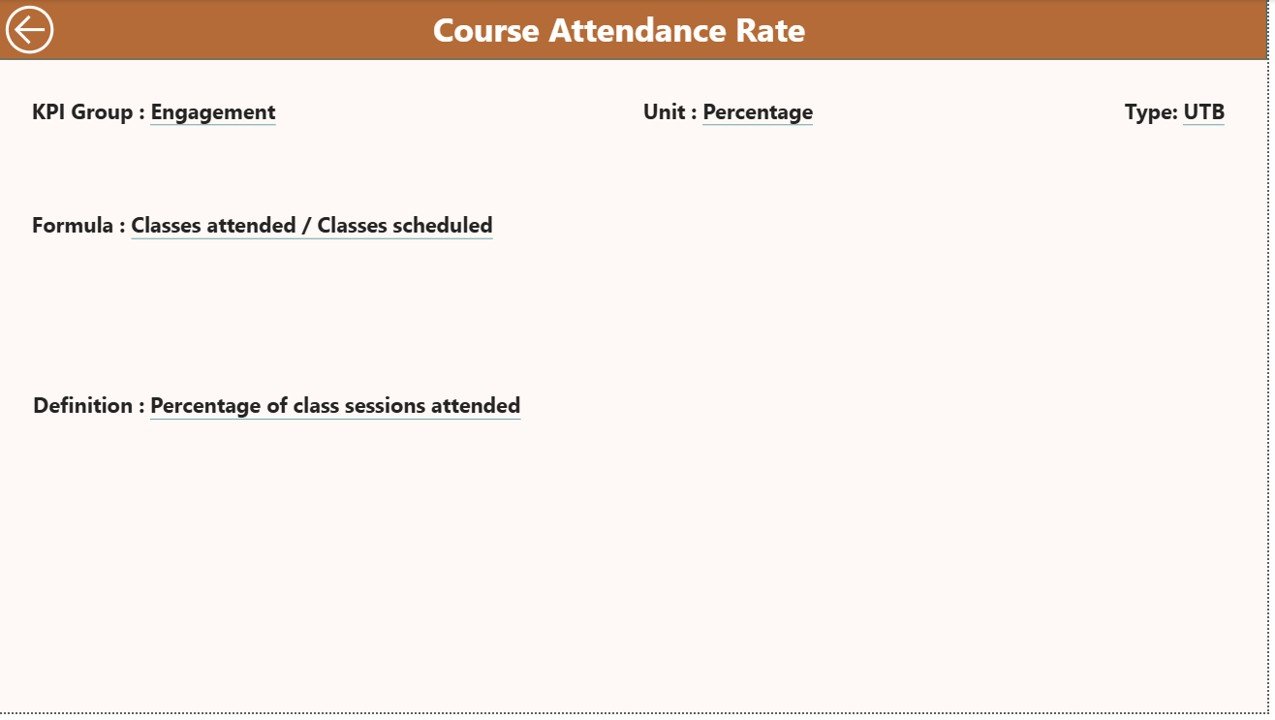
📘 Drill-Through KPI Details – Access KPI definitions and formulas instantly.
⚡ Real-Time Data Refresh – Keep your dashboard updated with the latest data.
📉 Target vs Actual Comparison – Measure performance with clear percentage insights.
📂 What’s Inside the Edutainment Parks KPI Dashboard in Power BI
This dashboard includes 3 powerful and interactive pages for complete KPI tracking:
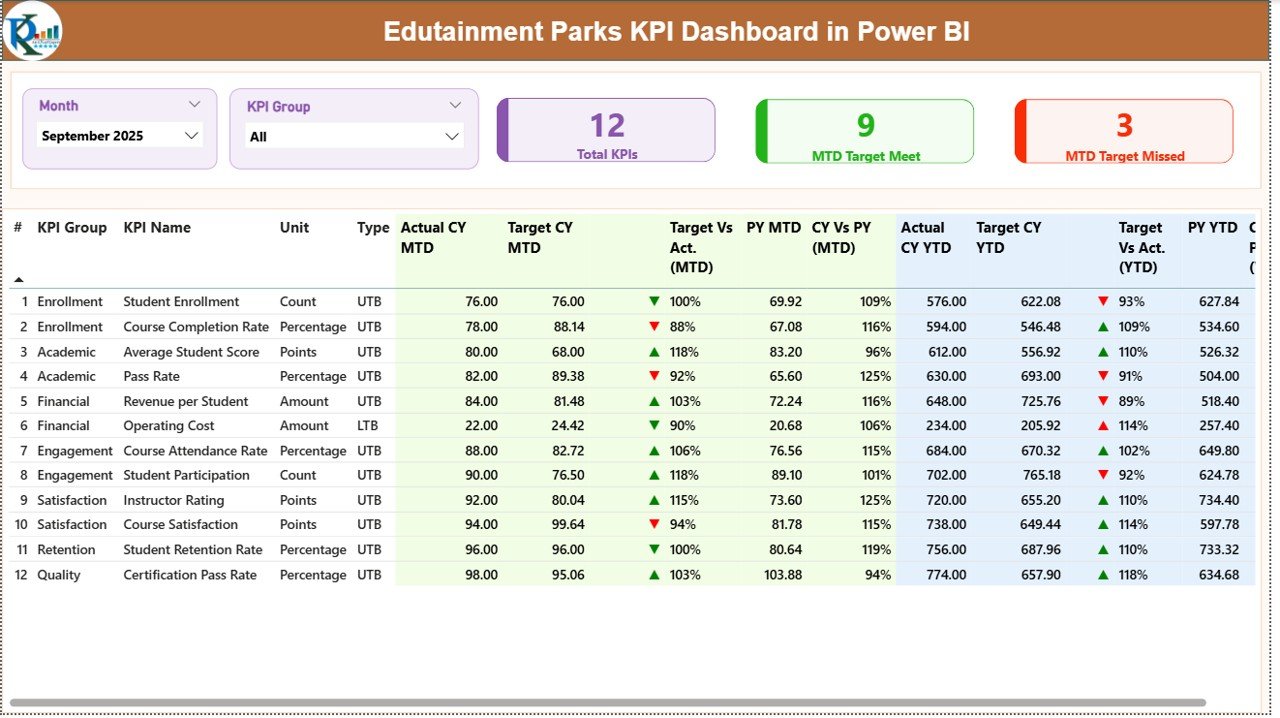
📌 Summary Page
Get a complete overview of KPIs with MTD and YTD tracking, performance indicators, and target comparisons.
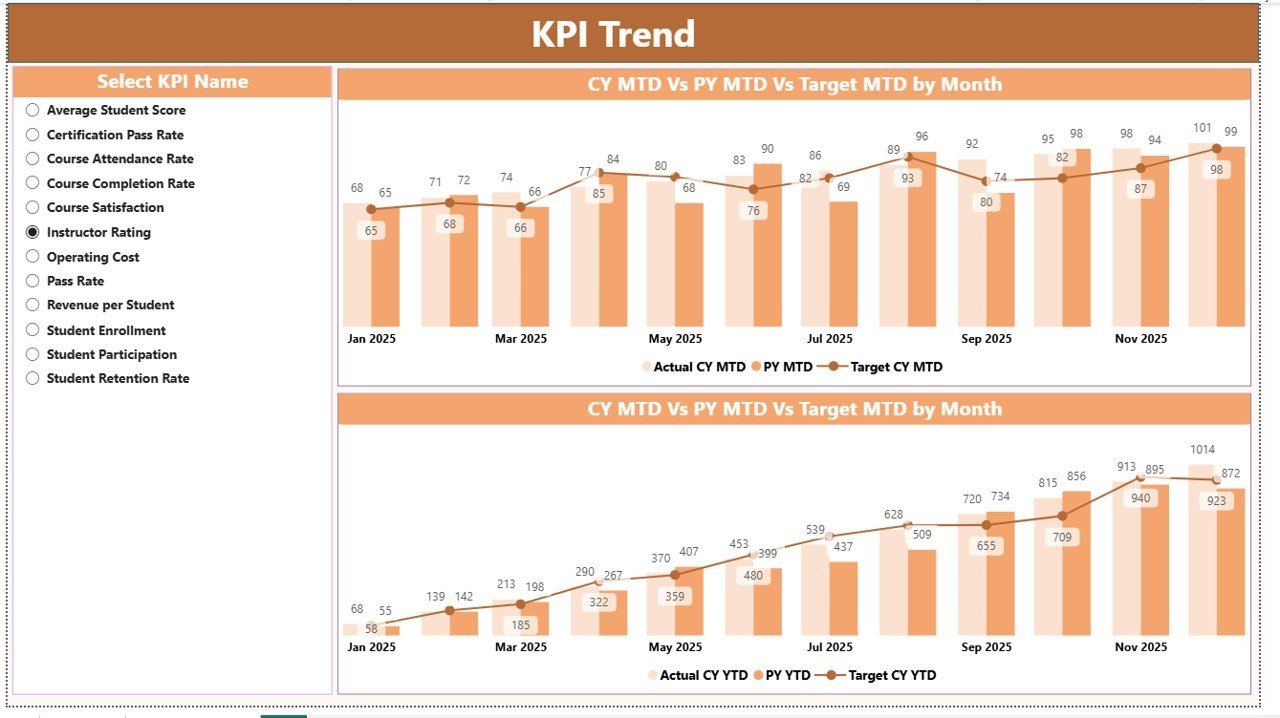
📌 KPI Trend Page
Analyze KPI performance over time using combo charts comparing actual, target, and previous year values.
📌 KPI Definition Page (Drill-Through)
Understand KPI formulas, definitions, and types for accurate analysis and better insights.
🛠️ How to Use the Edutainment Parks KPI Dashboard in Power BI
Using this dashboard is simple and effective:
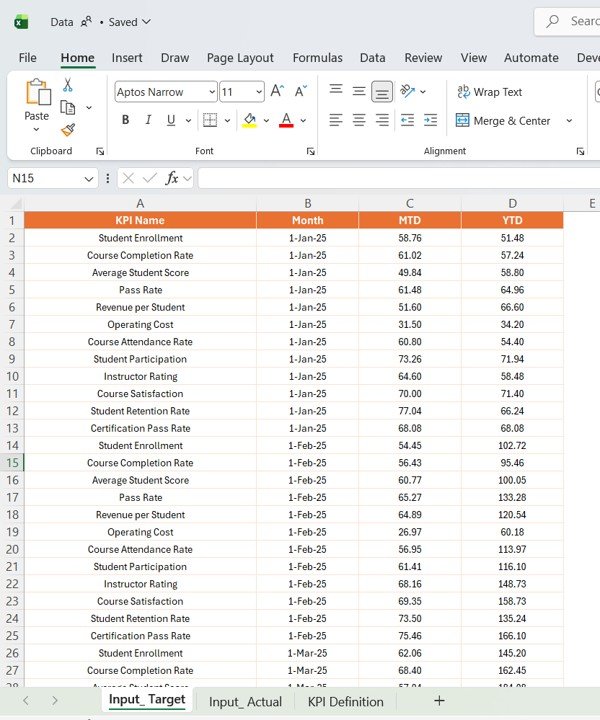
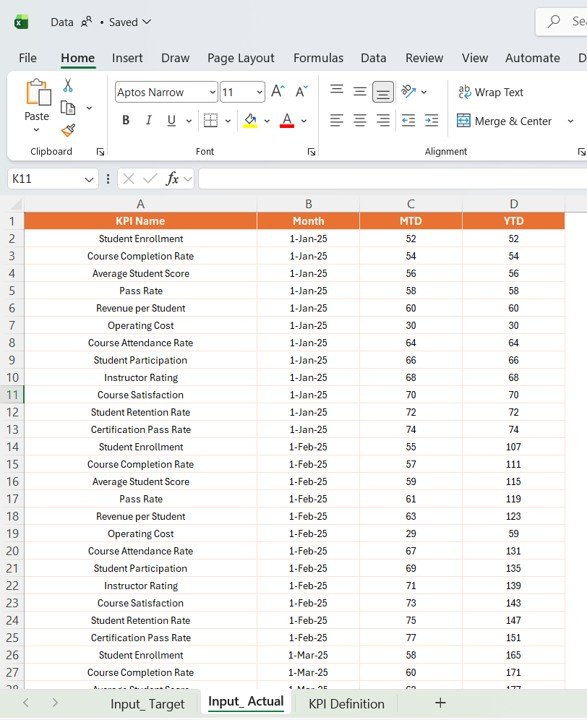
1️⃣ Connect your Excel data source
2️⃣ Open the Power BI dashboard file
3️⃣ Click Refresh to update data
4️⃣ Use slicers to filter by month or KPI group
5️⃣ Analyze KPIs on the Summary page
6️⃣ Explore trends on the KPI Trend page
7️⃣ Drill through for deeper KPI insights
Within minutes, you can turn complex operational data into meaningful insights.
👥 Who Can Benefit from This Edutainment Parks KPI Dashboard in Power BI
This dashboard is perfect for:
🎢 Edutainment Park Managers monitoring operations and visitor performance
📊 Data Analysts analyzing KPIs and trends
👨💼 Operations Teams improving efficiency and resource allocation
💼 Business Owners tracking revenue and profitability
📈 Consultants optimizing performance strategies
Whether you operate a small learning park or a large entertainment facility, this dashboard helps you stay competitive and data-driven.
With this dashboard, you no longer need to rely on manual reports or scattered data sources. Everything is automated, visual, and easy to understand. As a result, you save time, reduce errors, and make faster, more accurate decisions.
So, if you want to improve visitor experience, increase revenue, and optimize operations, this dashboard is the perfect solution.


