
Are you struggling to track cybersecurity performance across multiple tools and reports? Finding it difficult to monitor threats, measure KPIs, and improve your security strategy effectively?
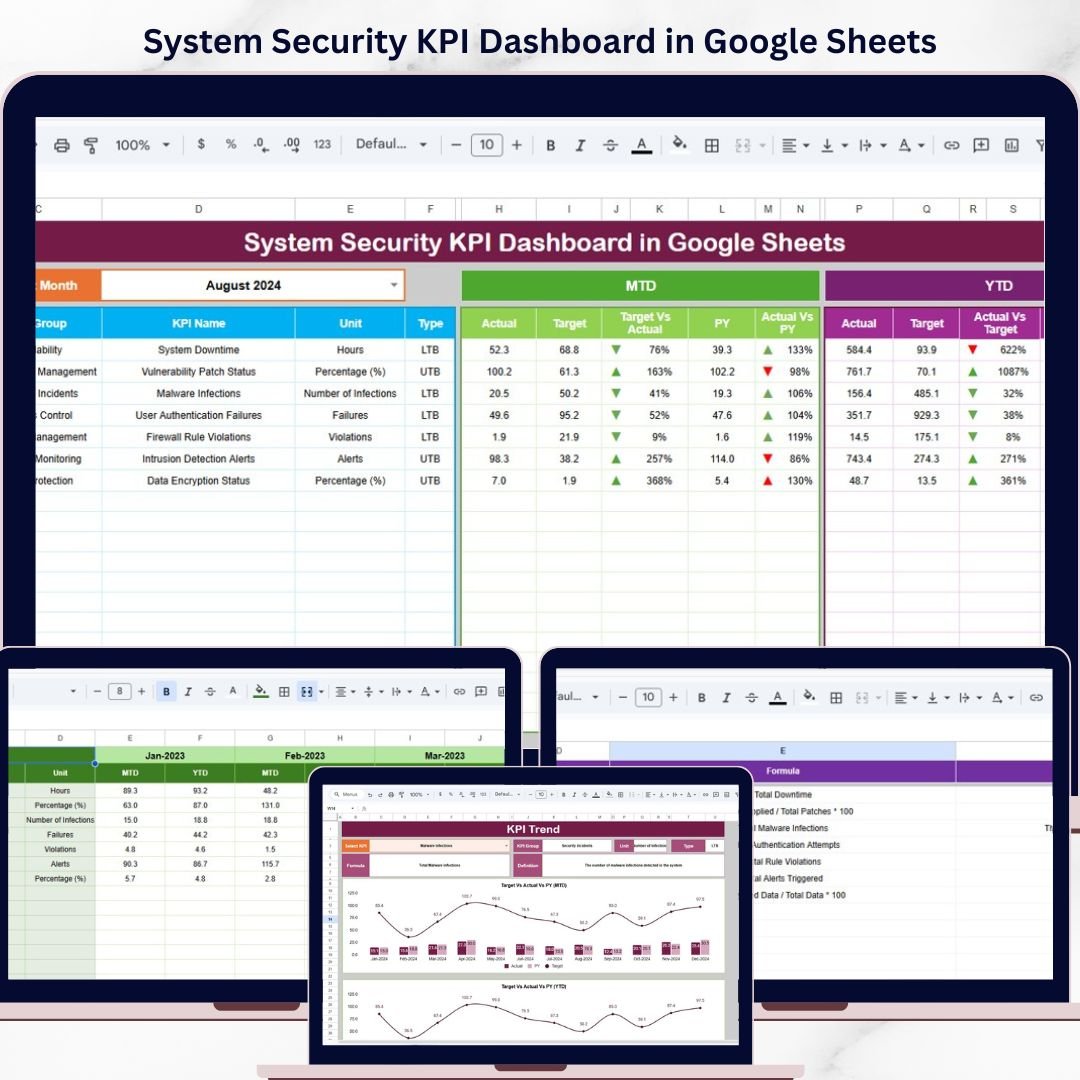
System Security KPI Dashboard in Google Sheets!
This powerful, ready-to-use Google Sheets dashboard is designed for IT teams, cybersecurity professionals, and organizations that want to monitor and improve system security in a structured and efficient way. Instead of dealing with scattered data and manual reporting, this dashboard centralizes all your security KPIs into one interactive and easy-to-use platform.
With dynamic visuals, automated calculations, and real-time KPI tracking, you can instantly identify risks, monitor trends, and take proactive actions. As a result, you can strengthen your cybersecurity framework, improve compliance, and reduce potential threats.
🔑 Key Features of System Security KPI Dashboard in Google Sheets
✨ 🔐 Real-Time Security Monitoring – Track cybersecurity KPIs instantly with dynamic and automated visuals.
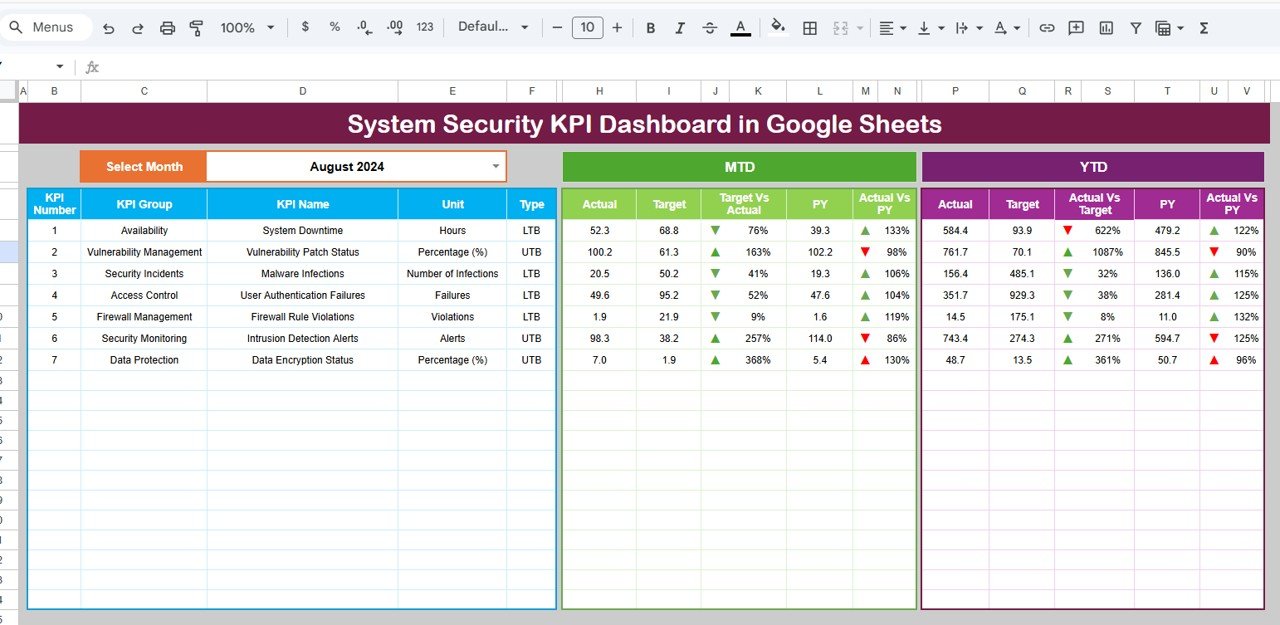
✨ 🎯 Target vs Actual Analysis – Compare actual performance against targets for MTD and YTD metrics.
✨ 📊 KPI Trend Analysis – Analyze security trends over time and identify patterns in incidents and risks.
✨ 📉 Previous Year Comparison – Evaluate current performance against historical data for better insights.
✨ 🎛️ Interactive Dashboard Controls – Use dropdowns to filter data and analyze specific periods.
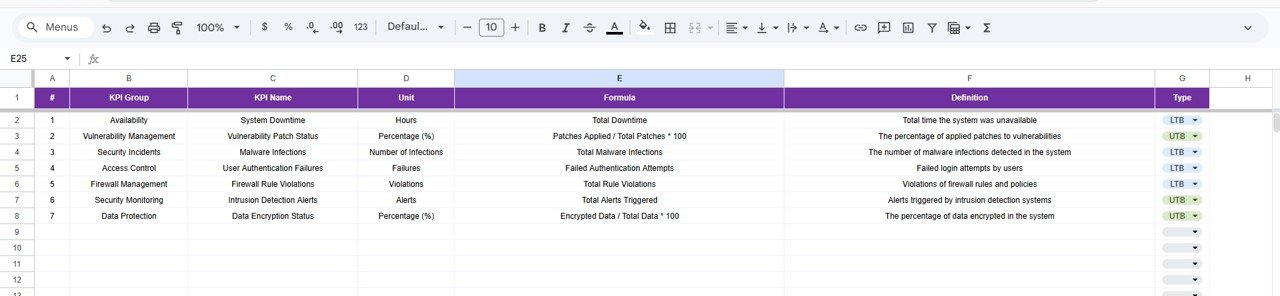
✨ 📘 KPI Definition Sheet – Understand KPI formulas, groups, and definitions clearly.
✨ ⚡ Automated Calculations – All metrics and charts update automatically when data is entered.
📂 What’s Inside the System Security KPI Dashboard in Google Sheets
📁 Dashboard Sheet – Central performance view with MTD and YTD metrics, comparisons, and visual indicators.
📁 KPI Trend Sheet – Analyze individual KPIs with dropdown-based selection and detailed insights.
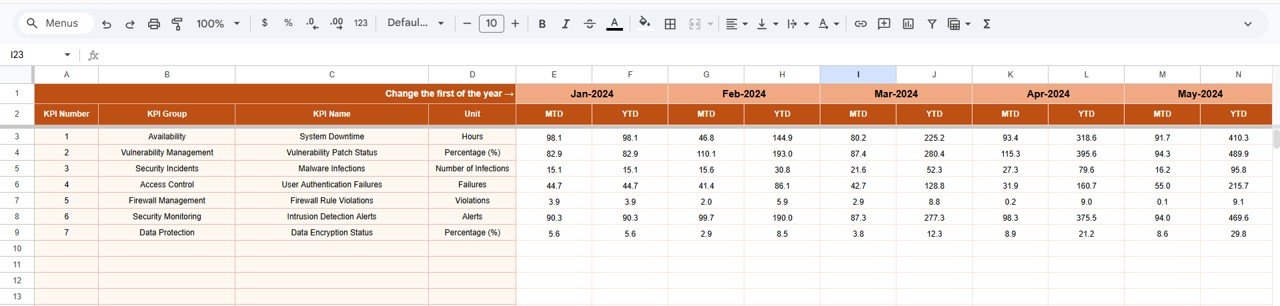
📁 Actual Data Sheet – Input current KPI values including MTD and YTD metrics.
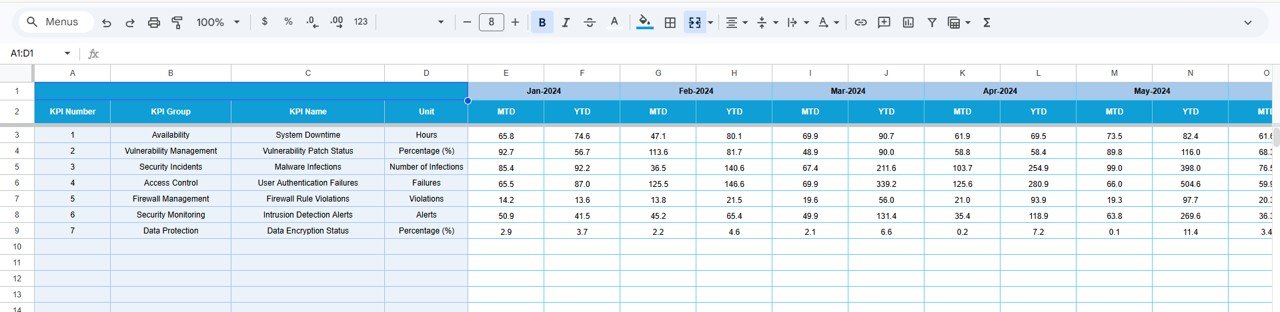
📁 Target Sheet – Define KPI targets and benchmarks.
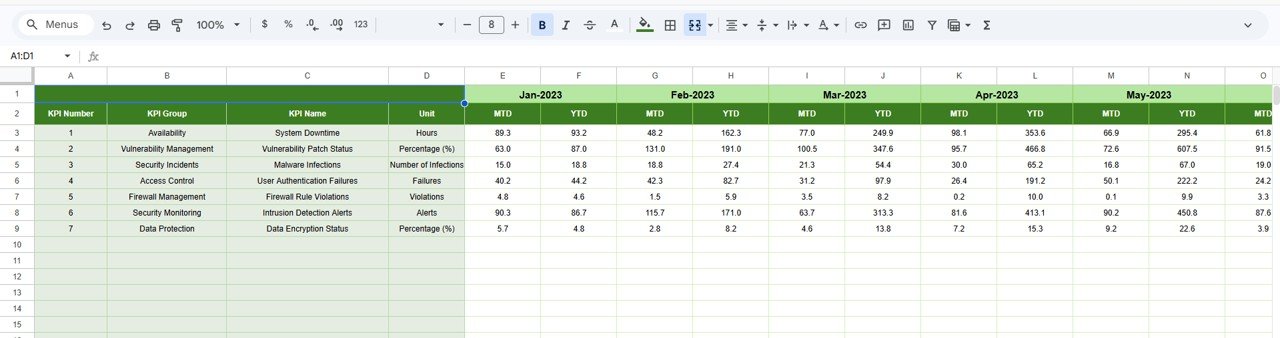
📁 Previous Year Sheet – Compare performance with historical data.
📁 KPI Definition Sheet – Detailed KPI documentation including formulas and definitions.
📁 Automated Visual Indicators – Up/down arrows and conditional formatting for quick analysis.
🛠️ How to Use the System Security KPI Dashboard in Google Sheets
👉 Step 1: Enter KPI definitions and structure
👉 Step 2: Input actual KPI values in the data sheet
👉 Step 3: Define targets and add previous year data
👉 Step 4: Select the desired month from the dropdown
👉 Step 5: Analyze trends, risks, and performance insights
💡 No advanced technical skills required—simple, powerful, and efficient!
👥 Who Can Benefit from This System Security KPI Dashboard in Google Sheets
✔️ Cybersecurity Professionals – Monitor threats and improve security performance
✔️ IT Teams – Track system performance and identify vulnerabilities
✔️ Organizations – Strengthen overall cybersecurity strategy
✔️ Data Analysts – Analyze trends and generate insights
✔️ Compliance Officers – Ensure regulatory and audit readiness
This dashboard is more than just a reporting tool—it’s a complete cybersecurity performance management solution. It helps you identify weak points, track incident trends, and improve your response strategy with confidence.
If you want to enhance system security, reduce risks, and make smarter decisions, this dashboard is the perfect solution.


