In prosthetics manufacturing, precision is not optional—it’s critical. Every product directly impacts a patient’s quality of life. But how do you ensure consistent performance, maintain quality standards, and optimize production efficiency—all at the same time? 🤔
The answer lies in data-driven decision-making.
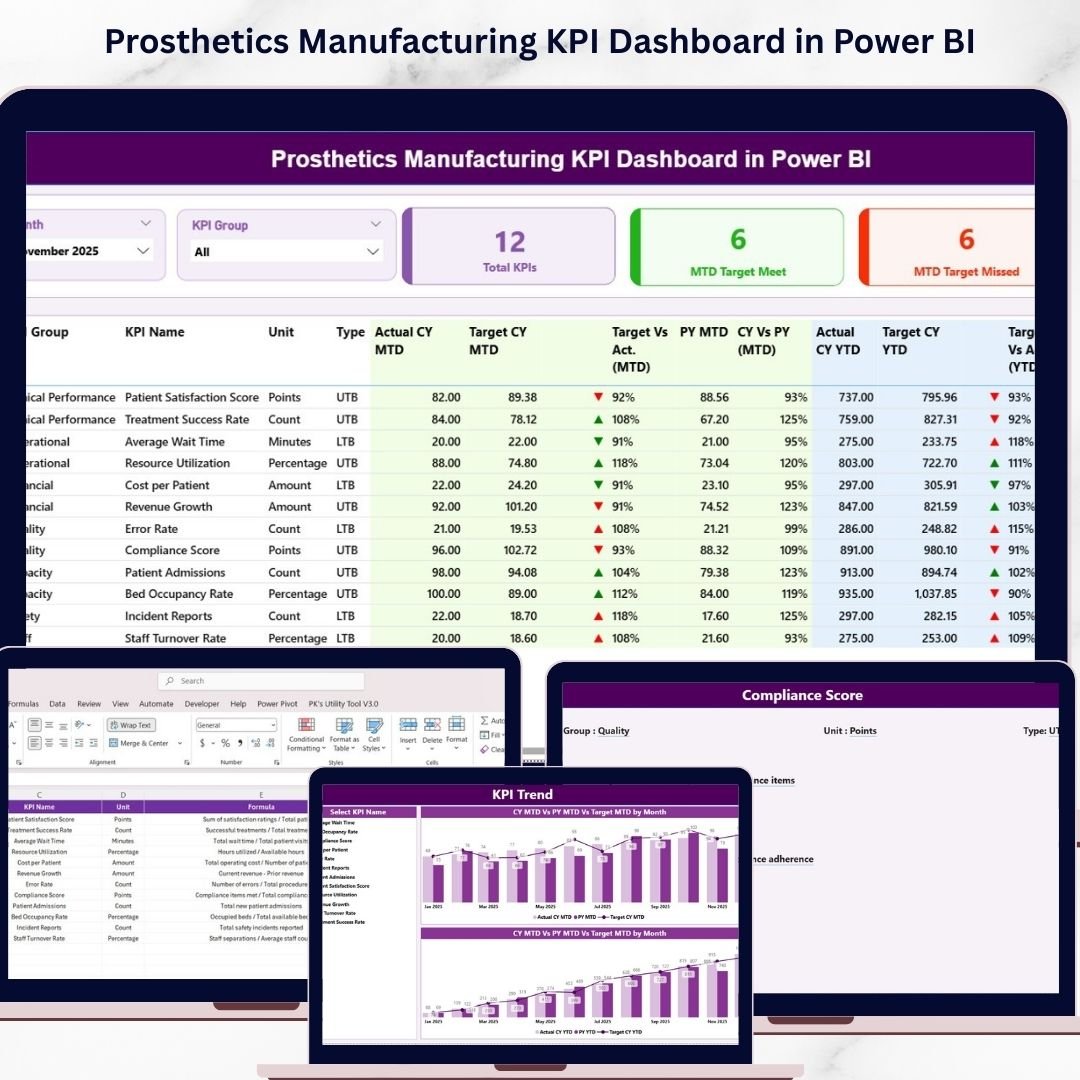
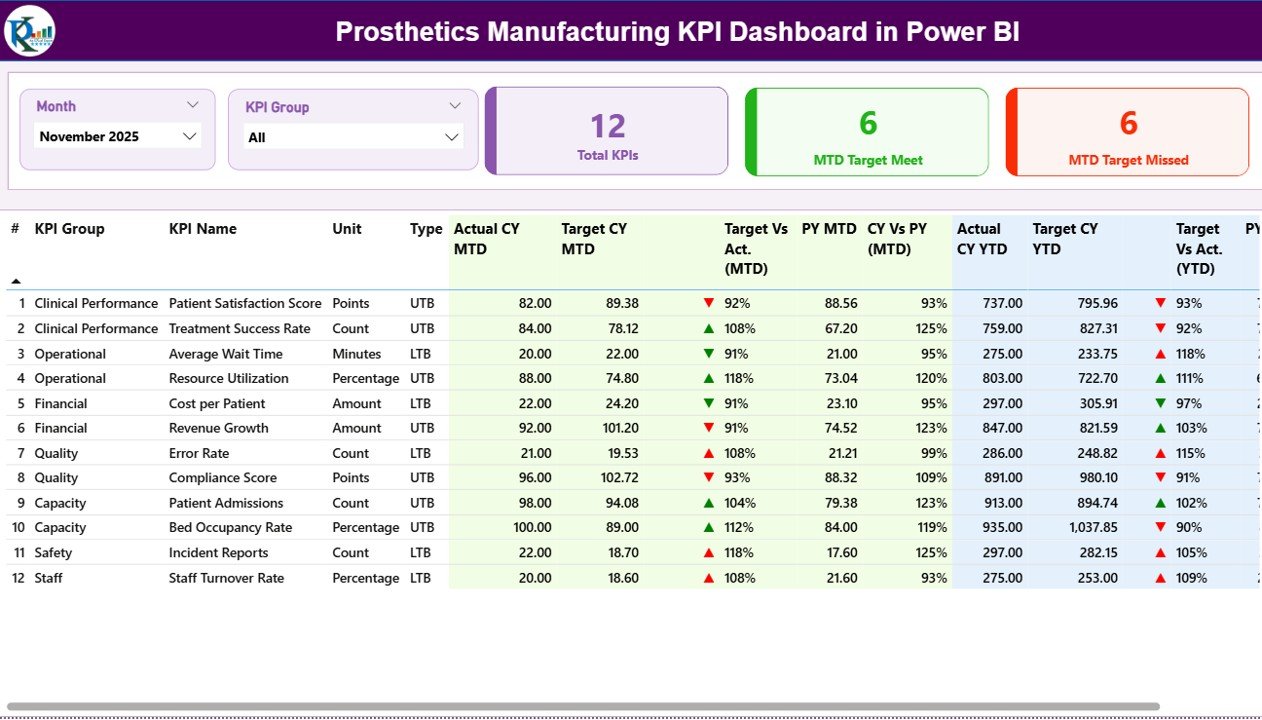
Introducing the Prosthetics Manufacturing KPI Dashboard in Power BI — a powerful, interactive, and ready-to-use analytics solution designed to help manufacturers monitor performance, improve quality, and streamline operations effortlessly. 🚀
This dashboard transforms complex production data into easy-to-understand visual insights. Instead of relying on scattered spreadsheets or outdated reports, you get a centralized system that gives you real-time control over your manufacturing operations.
Whether you want to track production output, monitor defect rates, or analyze delivery performance, this dashboard provides everything in one place.
💡 Key Features of Prosthetics Manufacturing KPI Dashboard in Power BI
📊 Centralized KPI Dashboard – Monitor all production metrics in a single interactive view.
📅 Dynamic Filters & Slicers – Analyze data by month and KPI groups instantly.
🎯 Target vs Actual Tracking – Quickly identify performance gaps and improvement areas.
📈 MTD & YTD Analysis – Measure both short-term and long-term performance.
🔺 Performance Indicators – Visual arrows highlight achievements and issues instantly.
📉 Previous Year Comparison – Evaluate growth trends and performance consistency.
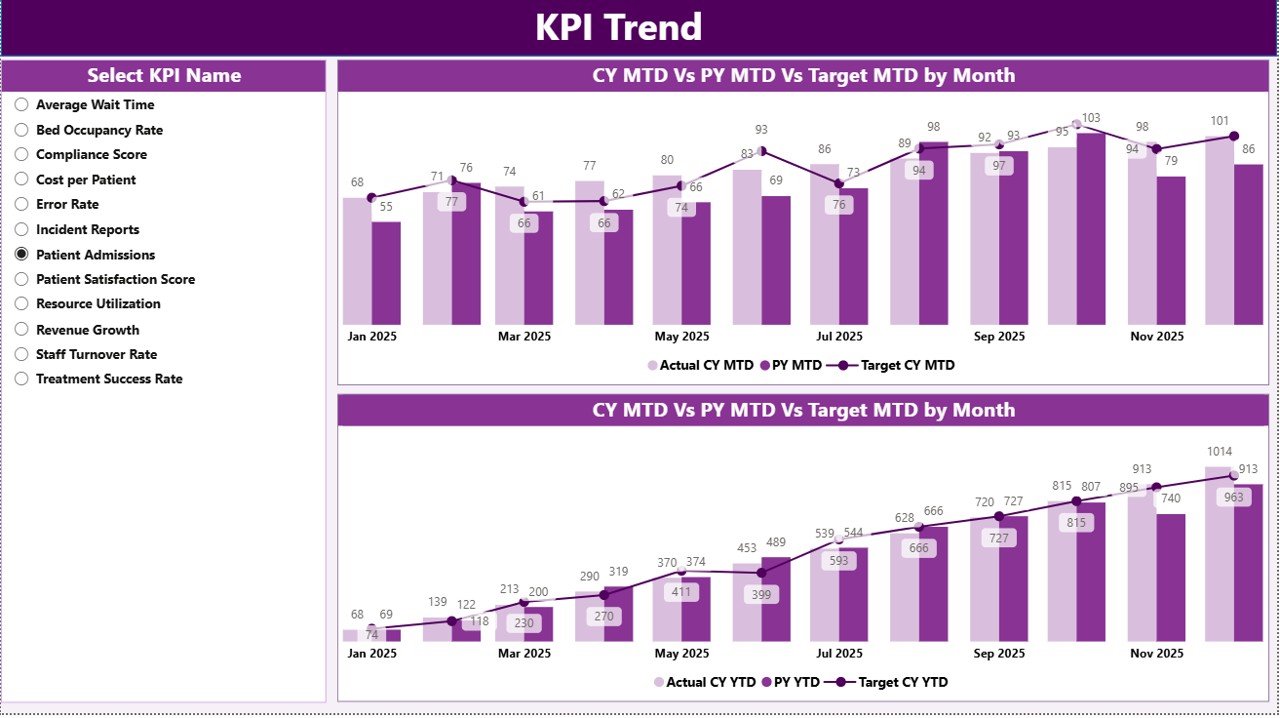
📊 KPI Trend Analysis Page – Visualize patterns using dynamic combo charts.
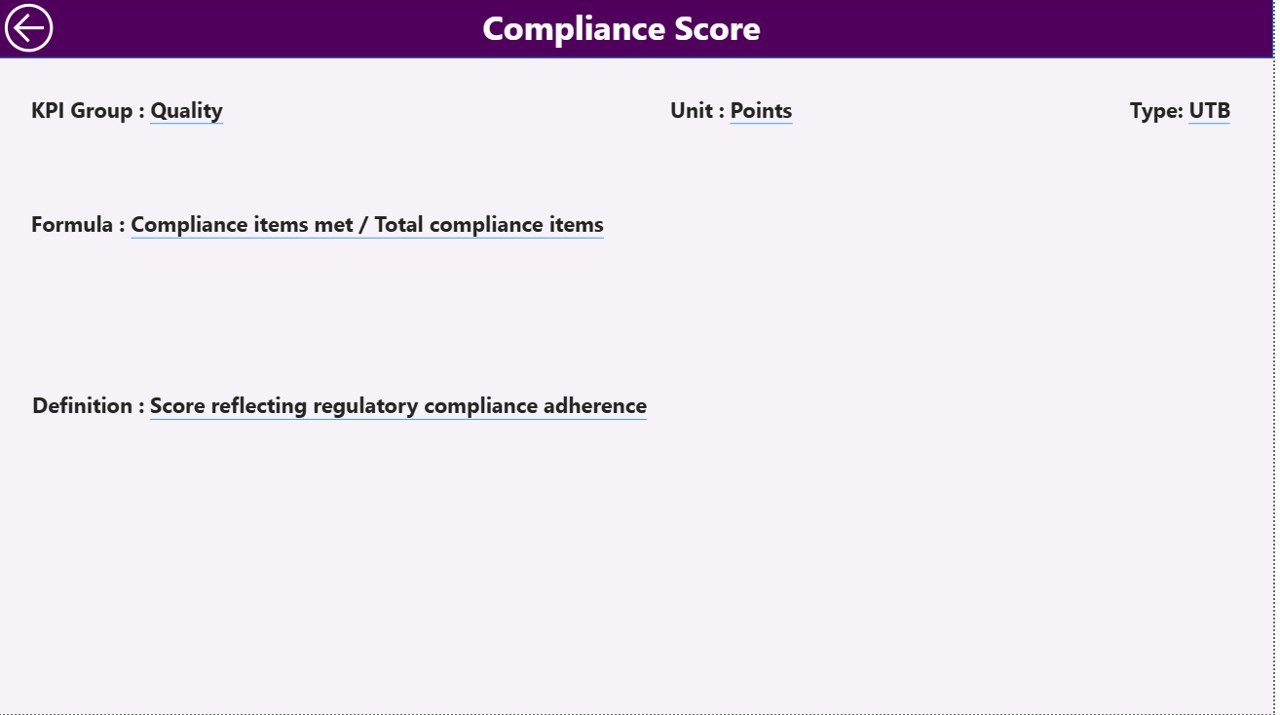
🧾 Drill-Through KPI Details – Access formulas, definitions, and KPI logic instantly.
⚡ Real-Time Data Updates – Refresh Excel data and see results in seconds.
📦 What’s Inside the Prosthetics Manufacturing KPI Dashboard in Power BI
This advanced dashboard includes 3 powerful pages designed for complete manufacturing analysis:
📌 Summary Page
A comprehensive overview showing KPI cards, performance indicators, and a detailed KPI table with MTD and YTD comparisons.
📌 KPI Trend Page
Analyze performance trends with interactive charts comparing current year, previous year, and target values.
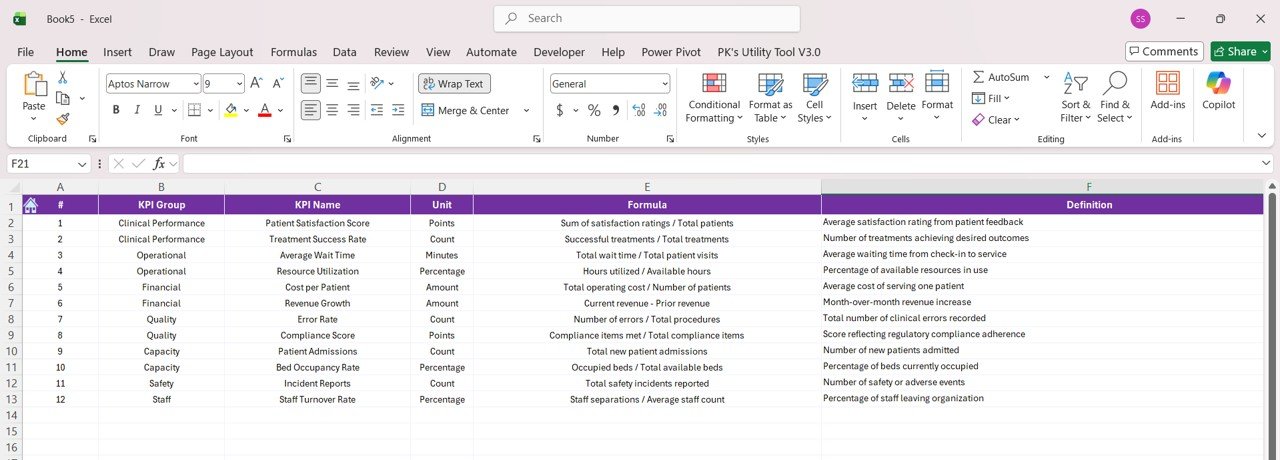
📌 KPI Definition Page
A drill-through page that provides detailed KPI documentation including formulas, units, and definitions.
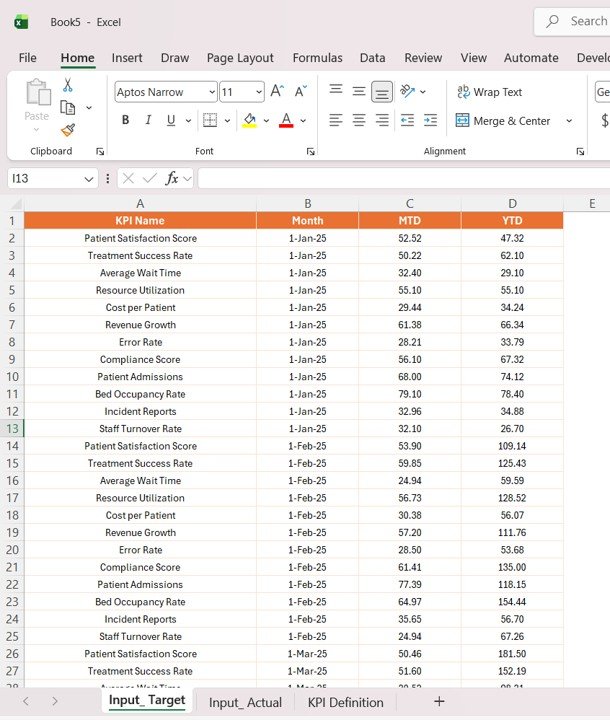
The dashboard is supported by structured Excel data sources:
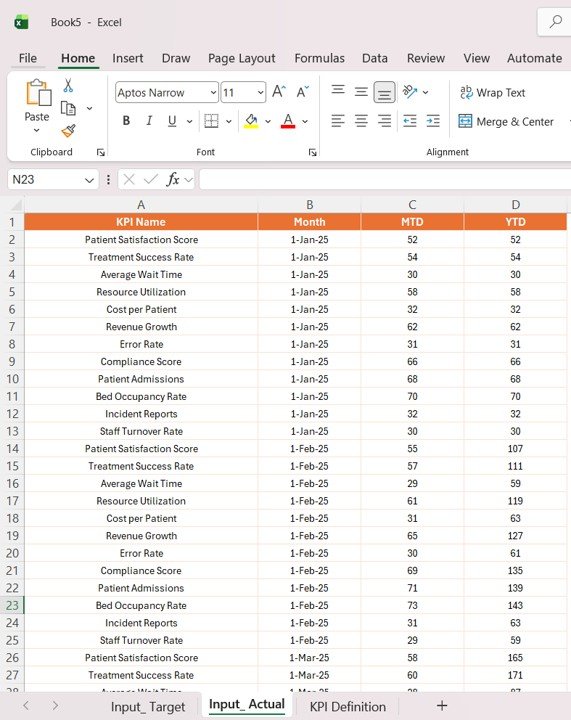
📂 Input_Actual Sheet – Stores actual MTD and YTD production data
📂 Input_Target Sheet – Contains production targets
📂 KPI Definition Sheet – Defines all KPIs and their logic
Together, these components create a complete performance management system for your manufacturing unit.
⚙️ How to Use the Prosthetics Manufacturing KPI Dashboard in Power BI
You don’t need advanced technical skills to use this dashboard.
👉 Step 1: Define KPIs
Enter KPI names, formulas, and units in the KPI Definition sheet.
👉 Step 2: Set Targets
Input monthly and yearly targets in the Target sheet.
👉 Step 3: Add Actual Data
Update production data in the Actual sheet.
👉 Step 4: Refresh Power BI Dashboard
Load updated data into Power BI for instant visualization.
👉 Step 5: Analyze Insights
Use filters, slicers, and charts to monitor trends and performance.
Within minutes, you’ll gain full visibility into your production operations.
👥 Who Can Benefit from This Prosthetics Manufacturing KPI Dashboard in Power BI
🏭 Prosthetics Manufacturers – Monitor production efficiency and quality control.
📊 Operations Managers – Identify bottlenecks and improve workflows.
👨💼 Plant Managers – Track output, performance, and delivery timelines.
📈 Business Owners – Optimize productivity and profitability.
🔧 Quality Control Teams – Monitor defect rates and compliance metrics.
📦 Supply Chain Managers – Improve delivery performance and coordination.
If your goal is to enhance production efficiency, reduce errors, and improve product quality—this dashboard is your ultimate solution.
This dashboard is not just a reporting tool—it’s a complete manufacturing intelligence system. It helps you uncover inefficiencies, improve quality, and take faster action.
💥 Stop relying on outdated reports.
💥 Start managing your manufacturing performance with real-time insights.