In today’s global economy, export promotion councils (EPCs) play a vital role in strengthening international trade, supporting exporters, and driving economic growth. However, managing export performance across multiple industries, markets, and initiatives requires accurate data analysis and real-time monitoring. When organizations rely only on scattered spreadsheets and manual reports, understanding export performance becomes challenging.
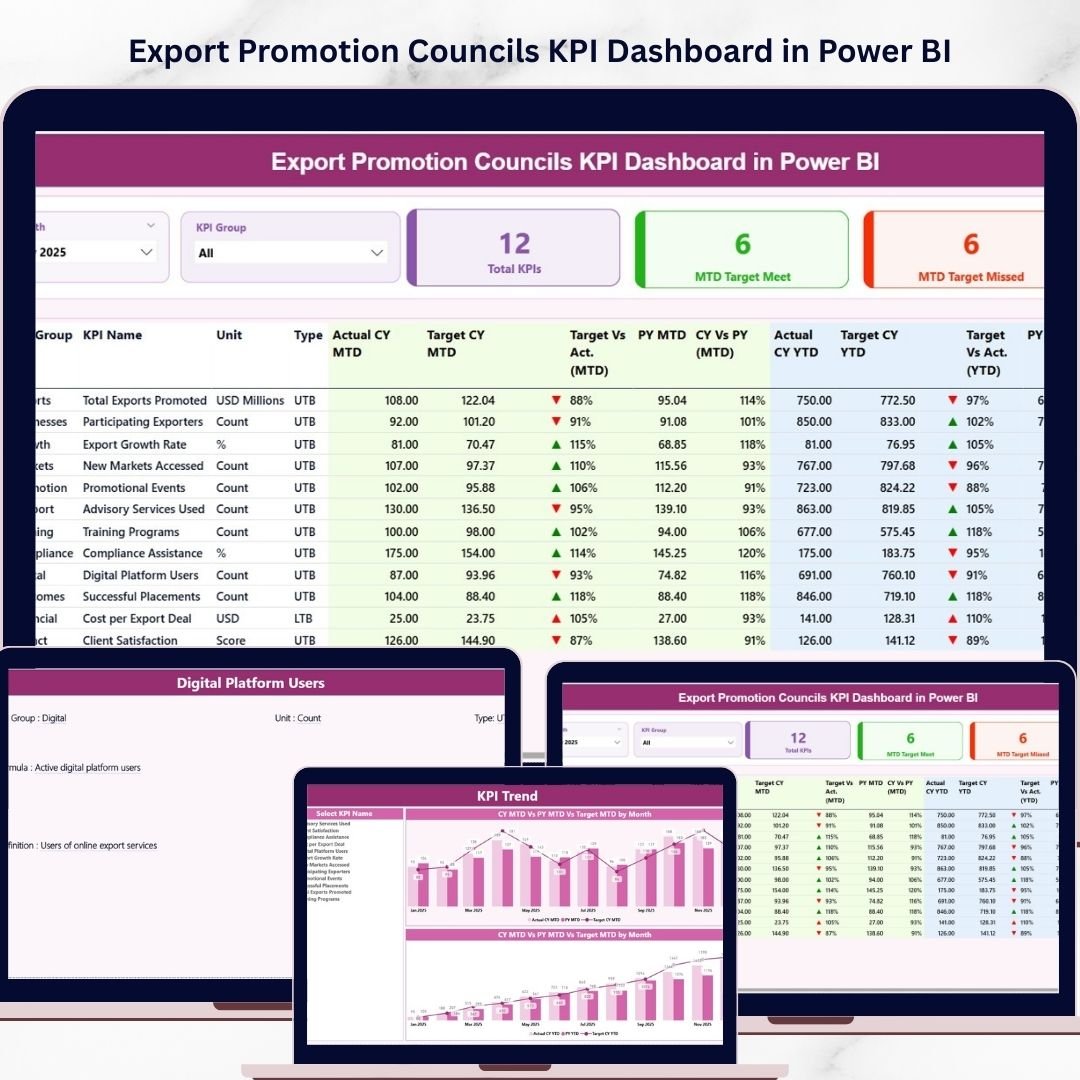
That is why many organizations are shifting toward data-driven KPI dashboards. One powerful solution is the Export Promotion Councils KPI Dashboard in Power BI. This ready-to-use dashboard transforms complex export data into clear and interactive visual insights that help leaders monitor performance and make informed decisions.
The Export Promotion Councils KPI Dashboard in Power BI is designed to track export-related KPIs, analyze trends, compare targets with actual results, and monitor progress over time. Because the dashboard consolidates data into a single visual interface, decision-makers can instantly evaluate export performance without reviewing multiple reports.
This template is built using Power BI’s advanced visualization capabilities, allowing organizations to analyze export data through interactive charts, slicers, and KPI indicators. As a result, managers can identify performance gaps quickly and take corrective actions to improve export initiatives.
Whether you are part of a government export council, trade organization, or economic development board, this dashboard provides the insights needed to strengthen export strategies and improve international trade outcomes.
📊 Key Feature of Export Promotion Councils KPI Dashboard in Power BI
The dashboard includes several powerful features that make export performance monitoring simple and efficient.
📊 Interactive KPI Monitoring
The dashboard tracks multiple export-related KPIs and displays performance indicators in a single view for quick analysis.
🎛 Dynamic Slicers for Filtering
Users can filter data using Month and KPI Group slicers, allowing them to analyze specific categories or time periods.
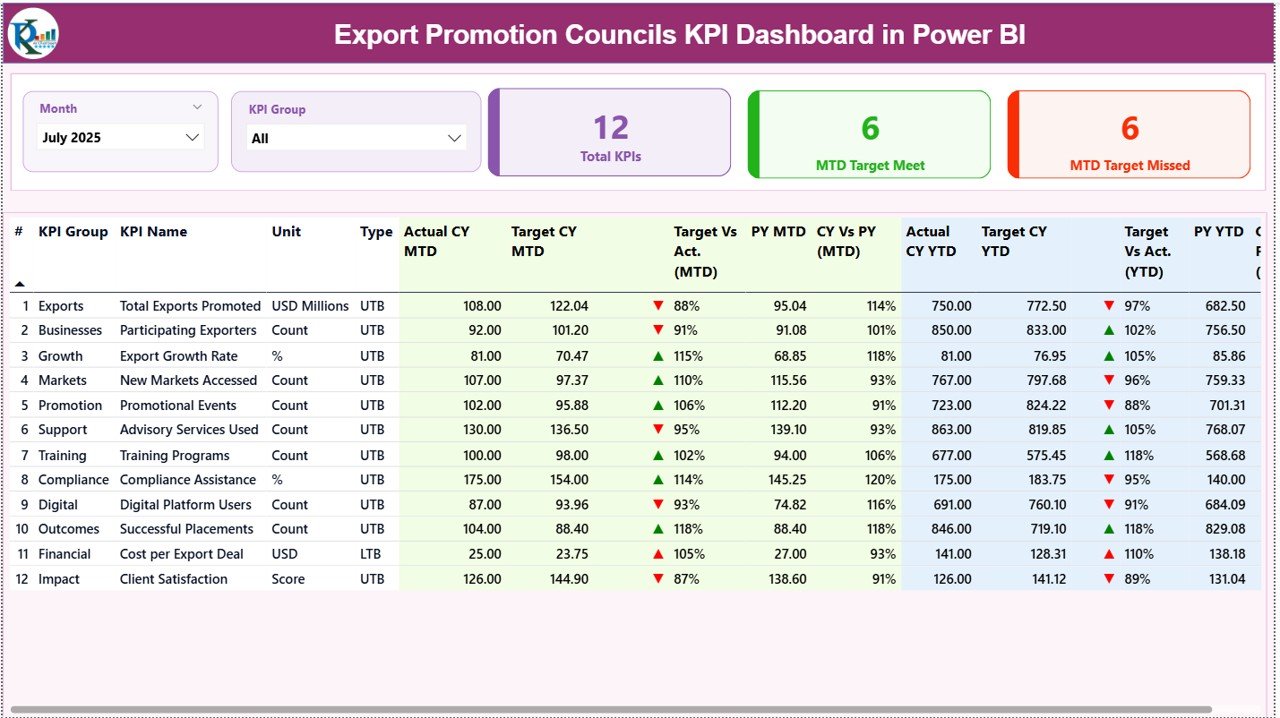
📈 Performance KPI Cards
Three important KPI cards provide instant insights:
-
Total KPIs Count
-
MTD Target Meet Count
-
MTD Target Missed Count
These cards help managers quickly assess overall performance.
📉 MTD and YTD Performance Tracking
The dashboard tracks Month-to-Date and Year-to-Date performance metrics, enabling organizations to monitor both short-term and long-term export progress.
🟢 Visual Performance Indicators
Green upward arrows indicate KPIs that achieved targets, while red downward arrows highlight underperforming KPIs.
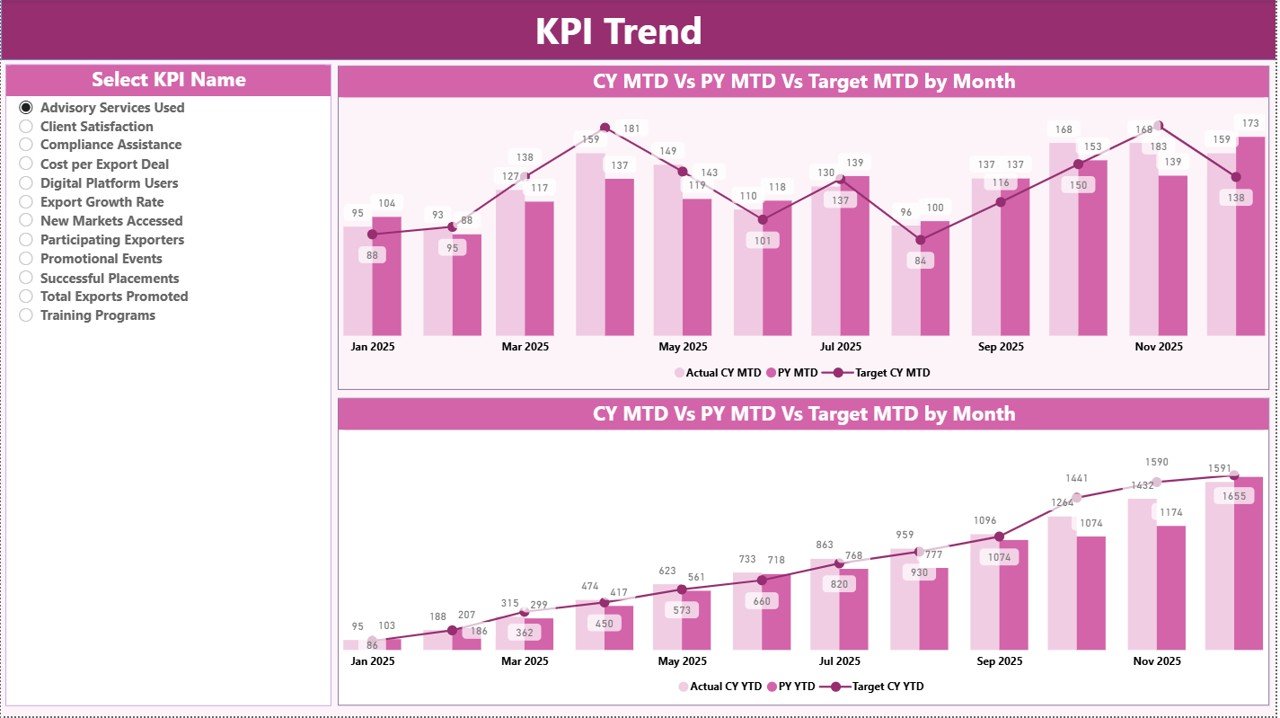
📊 Trend Analysis Charts
Combo charts show current year performance, previous year performance, and targets, helping organizations analyze export trends over time.
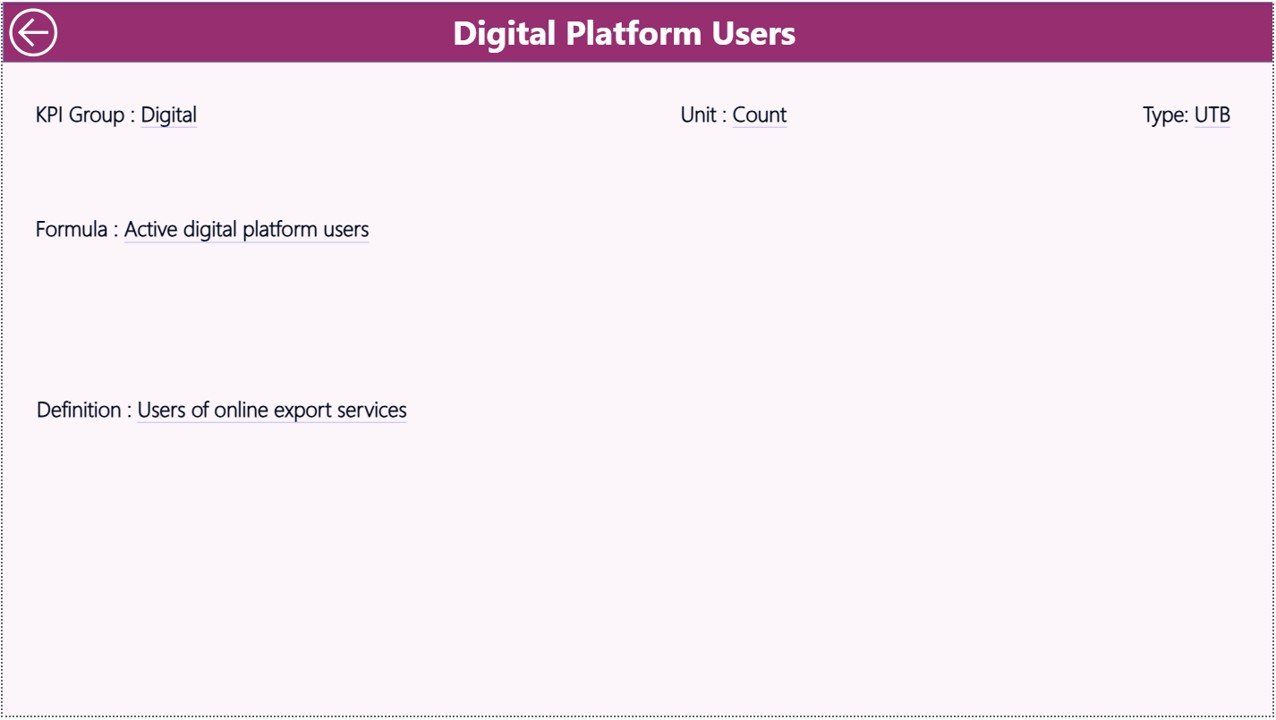
📘 KPI Definition Drill-Through Page
Users can drill into KPI definitions to understand formulas, measurement units, and performance categories.
🔄 Excel Integration for Easy Data Updates
The dashboard connects to Excel sheets, allowing users to update data quickly and refresh the Power BI report.
📦 What’s Inside the Export Promotion Councils KPI Dashboard in Power BI
This dashboard includes three analytical pages and an Excel data source structure that together provide a complete KPI monitoring system.
📊 Summary Page – Main Dashboard Overview
The Summary page acts as the main interface where users can see KPI performance at a glance. It includes KPI cards, slicers, and a detailed KPI table showing MTD and YTD performance comparisons.
📈 KPI Trend Page – Performance Analysis
This page focuses on trend analysis using interactive charts that display current year, previous year, and target values. Users can select specific KPIs to monitor performance patterns.
📘 KPI Definition Page – KPI Details
This hidden drill-through page provides detailed explanations of each KPI, including formulas, definitions, and categories.
📂 Excel Data Source Structure
The dashboard connects to an Excel workbook containing three important sheets:
-
Input Actual Sheet – Stores actual KPI performance values
-
Input Target Sheet – Contains target values for each KPI
-
KPI Definition Sheet – Stores KPI details, formulas, units, and categories
Because the dashboard uses this structured data model, organizations can easily maintain accurate and consistent KPI monitoring.
⚙️ How to Use the Export Promotion Councils KPI Dashboard in Power BI
Using the dashboard is simple and efficient.
1️⃣ Update KPI data in the Excel Input Actual Sheet and Input Target Sheet.
2️⃣ Maintain KPI details in the KPI Definition Sheet.
3️⃣ Refresh the Power BI dashboard to load the latest data.
4️⃣ Use the Month and KPI Group slicers to filter information.
5️⃣ Analyze performance using KPI cards, tables, and charts.
6️⃣ Use the KPI Trend page to study performance patterns over time.
7️⃣ Drill into the KPI Definition page to understand KPI calculations and definitions.
Within minutes, organizations can transform raw export data into meaningful insights.
👥 Who Can Benefit from This Export Promotion Councils KPI Dashboard in Power BI
This dashboard is valuable for multiple organizations involved in international trade and export development.
🌍 Export Promotion Councils – Monitor export initiatives and sector performance.
🏛 Government Agencies – Track economic development programs and export growth.
📊 Trade Organizations – Analyze export performance across industries.
📈 Economic Development Boards – Evaluate international market expansion strategies.
💼 Export Consultants – Provide data-driven insights for export clients.
Because the dashboard presents complex export data through simple visualizations, organizations can make faster and smarter strategic decisions.
### Click hare to read the Detailed blog post
Visit our YouTube channel to learn step-by-step video tutorials
https://youtube.com/@PKAnExcelExpert


