The travel and tourism industry is highly competitive and constantly evolving. Businesses must track performance carefully to understand trends, improve customer experiences, and maximize revenue. Without proper monitoring tools, travel agencies, tourism companies, and hospitality managers often struggle to evaluate performance metrics effectively.
To solve this challenge, we created the Travel and Tourism KPI Scorecard in Google Sheets — a powerful, ready-to-use performance monitoring tool designed specifically for travel and tourism businesses.
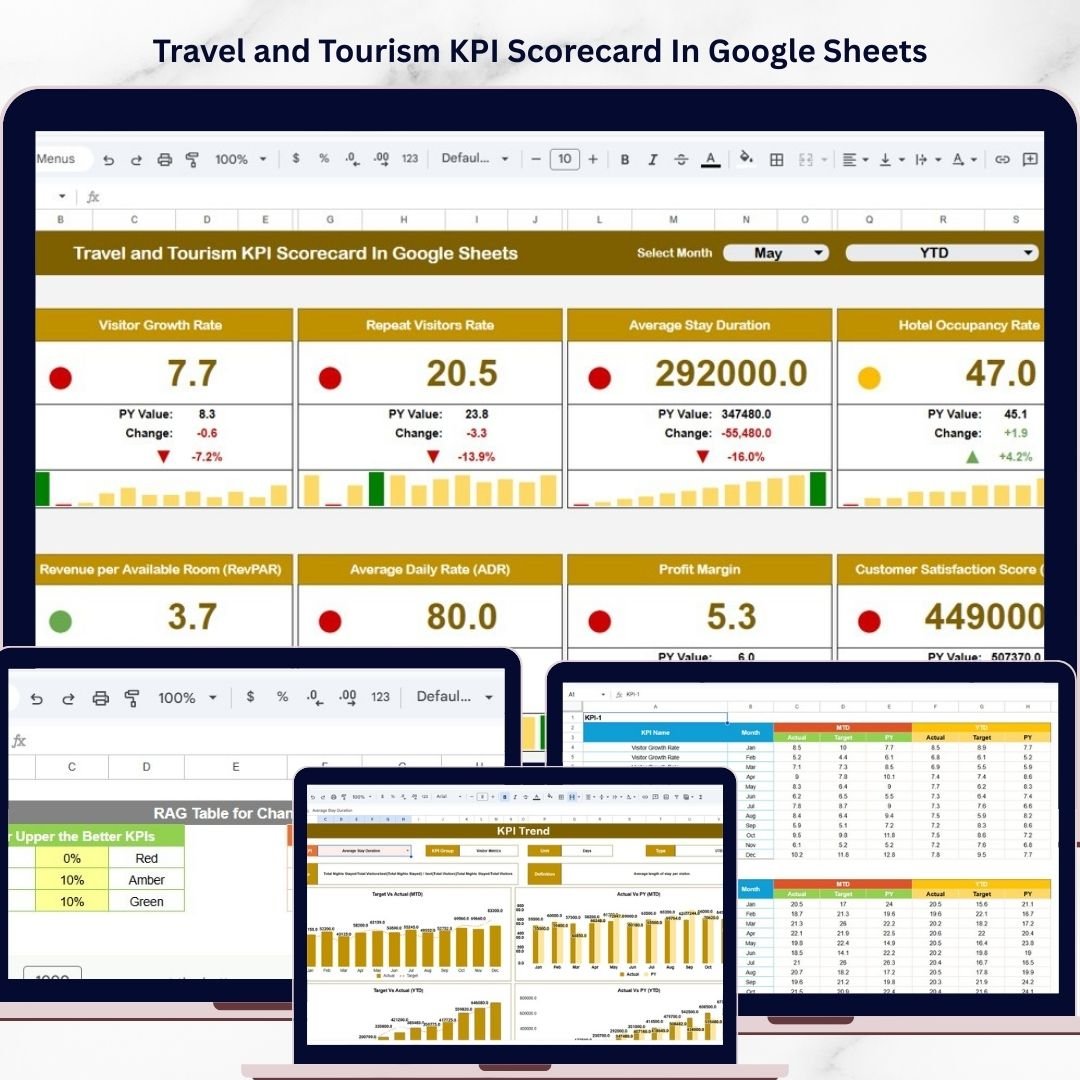
This interactive scorecard helps organizations track key performance indicators (KPIs), analyze trends, compare targets with actual results, and evaluate business performance across different time periods. Instead of reviewing multiple spreadsheets and reports, managers can monitor performance from a single centralized dashboard.
The template is built entirely in Google Sheets, allowing teams to collaborate in real time and access their KPI data from anywhere. With its simple layout, dynamic dropdown menus, and automated calculations, this scorecard transforms raw data into meaningful insights.
Whether you manage a travel agency, tour operator company, tourism board, or hospitality service, this scorecard provides a structured approach to tracking operational performance and achieving business goals.
✈️ Key Features of Travel and Tourism KPI Scorecard in Google Sheets
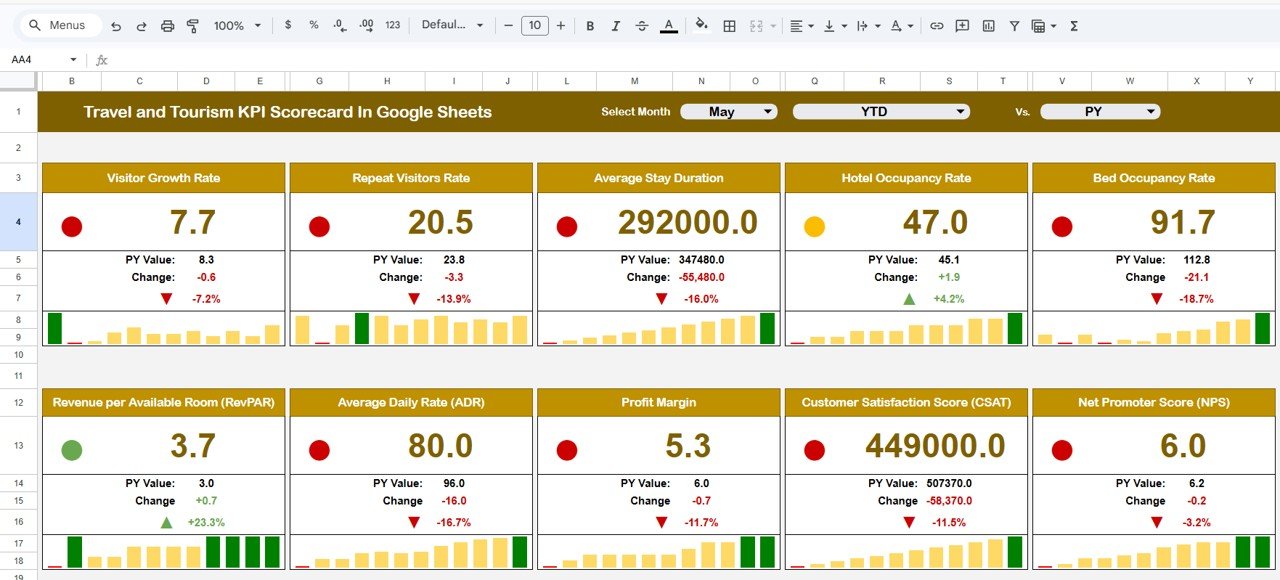
📊 Interactive KPI Scorecard Dashboard
Monitor travel and tourism KPIs from one centralized dashboard with a clear and organized layout.
📅 Flexible Time Analysis (Monthly / MTD / YTD)
Easily switch between monthly, Month-to-Date (MTD), and Year-to-Date (YTD) views using dropdown selections.
🎯 Actual vs Target Performance Tracking
Instantly compare actual KPI results with predefined targets to evaluate performance.
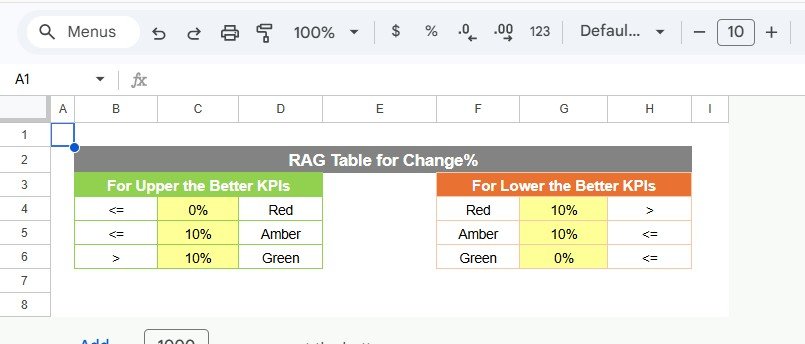
🚦 Visual KPI Status Indicators
Color-coded indicators highlight whether KPIs are performing well or require attention.
📈 Detailed KPI Trend Analysis
Line charts help analyze historical KPI trends and monitor performance improvements over time.
📂 Multiple Structured Worksheets
The template includes dedicated sheets for the KPI scorecard, trend analysis, data input, and KPI definitions.
🧭 User-Friendly Navigation
Dropdown menus, structured tables, and visual charts make the dashboard easy to use for all team members.
☁️ Real-Time Collaboration in Google Sheets
Multiple users can update and review KPI data simultaneously from any location.
📦 What’s Inside the Travel and Tourism KPI Scorecard in Google Sheets
This professionally designed template contains several worksheets that help you track tourism business performance effectively.
1️⃣ Scorecard Sheet
The Scorecard Sheet is the main dashboard where all KPIs are displayed.
Key features include:
-
Dropdown menus for selecting Month, MTD, or YTD analysis
-
Side-by-side comparison of Actual vs Target values
-
Color-coded KPI indicators to highlight performance status
-
Detailed KPI overview for both MTD and YTD metrics
This sheet provides a complete snapshot of business performance at a glance.
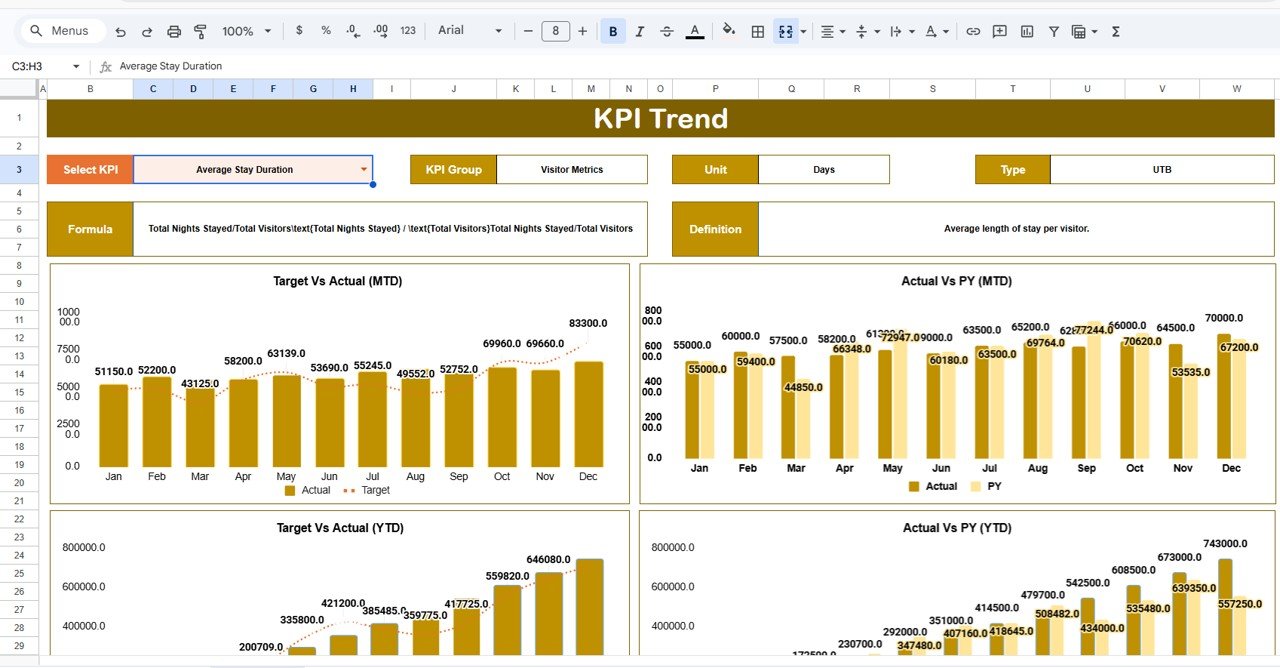
2️⃣ KPI Trend Sheet
The KPI Trend Sheet allows deeper analysis of individual KPIs.
Users can select a KPI from the dropdown in Cell C3, and the dashboard will display detailed information such as:
-
KPI Group
-
KPI Unit
-
KPI Type (Lower the Better / Upper the Better)
-
KPI Formula
-
KPI Definition
The sheet also includes MTD and YTD trend charts comparing Actual, Target, and Previous Year data.
These charts help managers quickly identify performance trends and improvement areas.
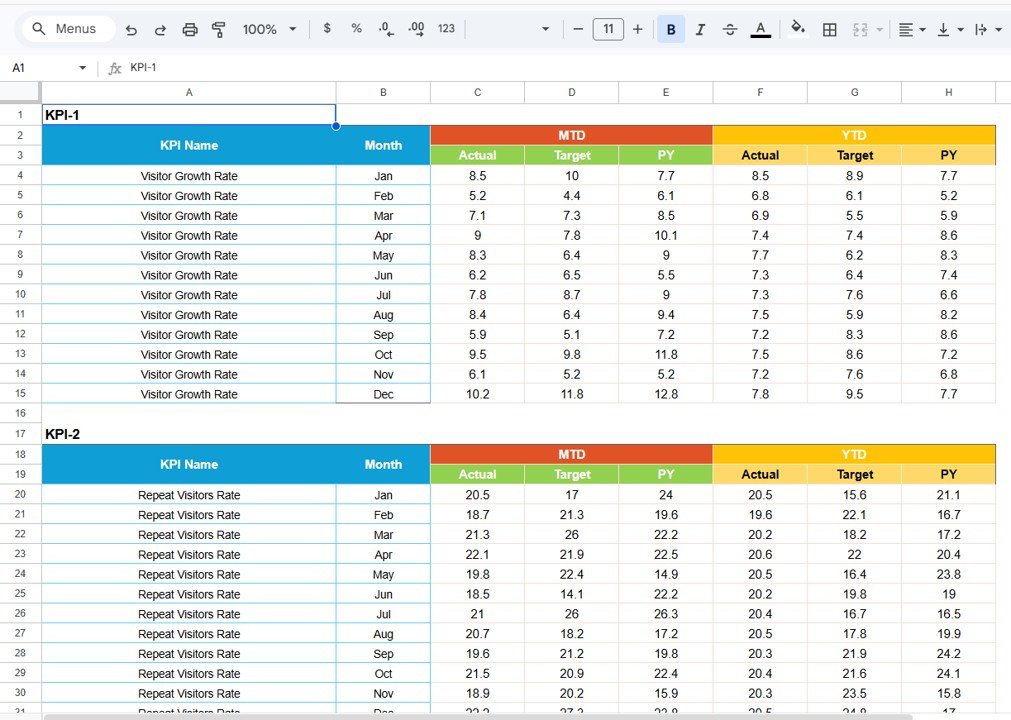
3️⃣ Input Data Sheet
The Input Data Sheet acts as the data source for the entire scorecard.
This sheet allows users to:
-
Enter actual KPI values
-
Input target benchmarks
-
Maintain and update operational metrics
Because all charts and calculations rely on this sheet, keeping this data updated ensures accurate dashboard insights.
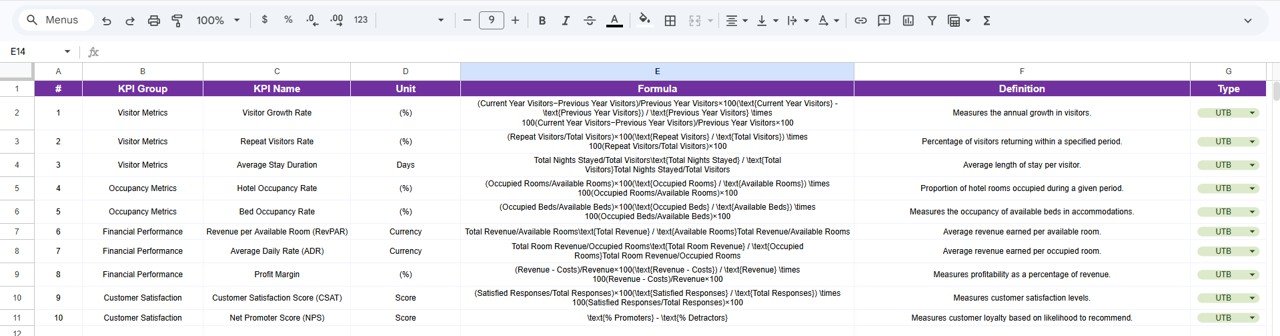
4️⃣ KPI Definition Sheet
The KPI Definition Sheet documents all KPI information to ensure clarity and consistency across teams.
It includes the following fields:
-
KPI Name
-
KPI Group
-
Unit of Measurement
-
KPI Formula
-
KPI Definition
This structured approach ensures that every team member clearly understands how KPIs are calculated and interpreted.
⚙️ How to Use the Travel and Tourism KPI Scorecard in Google Sheets
Getting started with this template is simple.
1️⃣ Enter KPI data in the Input Data Sheet.
2️⃣ Define KPI targets and benchmark values.
3️⃣ Update KPI definitions if customization is required.
4️⃣ Select the desired Month, MTD, or YTD view from the Scorecard Sheet.
5️⃣ Analyze KPI performance using charts and indicators.
Within minutes, your tourism business data will be transformed into clear performance insights.
🌍 Who Can Benefit from This Travel and Tourism KPI Scorecard
This scorecard is designed for organizations operating in the travel and tourism sector.
🏨 Travel Agencies – Track booking performance, revenue, and operational KPIs.
✈️ Tour Operators – Monitor tour performance and customer engagement metrics.
🏝 Tourism Boards – Analyze tourism trends and regional performance.
🏢 Hospitality Businesses – Track service performance and business growth indicators.
📊 Business Analysts – Evaluate travel industry performance metrics.
Any travel-related organization can use this scorecard to improve operational visibility and strategic decision-making.
### Click here to read the Detailed blog post
Watch the step-by-step video tutorial:
Visit our YouTube channel to learn step-by-step video tutorials


