Managing performance across a trade association can quickly become complicated when you are tracking multiple KPIs, member engagement metrics, financial indicators, and operational targets. Without a clear system, it becomes difficult to understand which areas are performing well and which need attention.
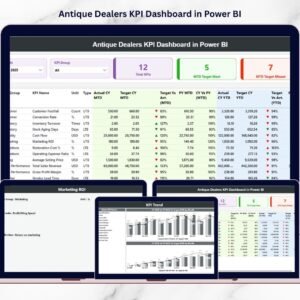
To solve this challenge, we created the Trade Associations KPI Dashboard in Power BI — a powerful, ready-to-use analytics solution designed to help organizations monitor key performance indicators with clarity and precision.
This professionally designed Power BI dashboard allows trade associations to track Month-to-Date (MTD) performance, KPI targets, trends, and performance status in a visually engaging and interactive format. Instead of manually analyzing large spreadsheets, decision-makers can instantly see the performance of every KPI and identify areas that need improvement.
With an intuitive layout, dynamic slicers, and automated calculations, this dashboard turns complex KPI data into clear insights that help associations make smarter and faster decisions.
🚀 Key Feature of Trade Associations KPI Dashboard in Power BI
📊 Interactive KPI Monitoring
Track all important KPIs in one centralized Power BI dashboard designed specifically for trade associations.
🎯 Target vs Actual Performance Tracking
Easily compare actual performance with targets to understand which KPIs are meeting expectations.
📅 Month-to-Date KPI Analysis
Monitor the performance of KPIs for the current month with automated calculations.
📈 Powerful Visual Insights
Charts and tables provide clear visual insights that make complex KPI data easy to interpret.
🔎 Dynamic Slicer Filters
Filter the entire dashboard using slicers such as Month and KPI Group to analyze specific segments instantly.
📉 KPI Performance Status Indicators
Identify whether KPIs are meeting or missing targets through clear performance indicators.
⚡ Fast Decision-Making Support
Turn raw data into actionable insights that help leaders make informed decisions quickly.
🧩 Structured KPI Data Framework
The dashboard uses a structured data model that supports reliable reporting and easy updates.
📦 What’s Inside the Trade Associations KPI Dashboard in Power BI
This Power BI solution includes three well-structured pages that provide a complete KPI monitoring system.
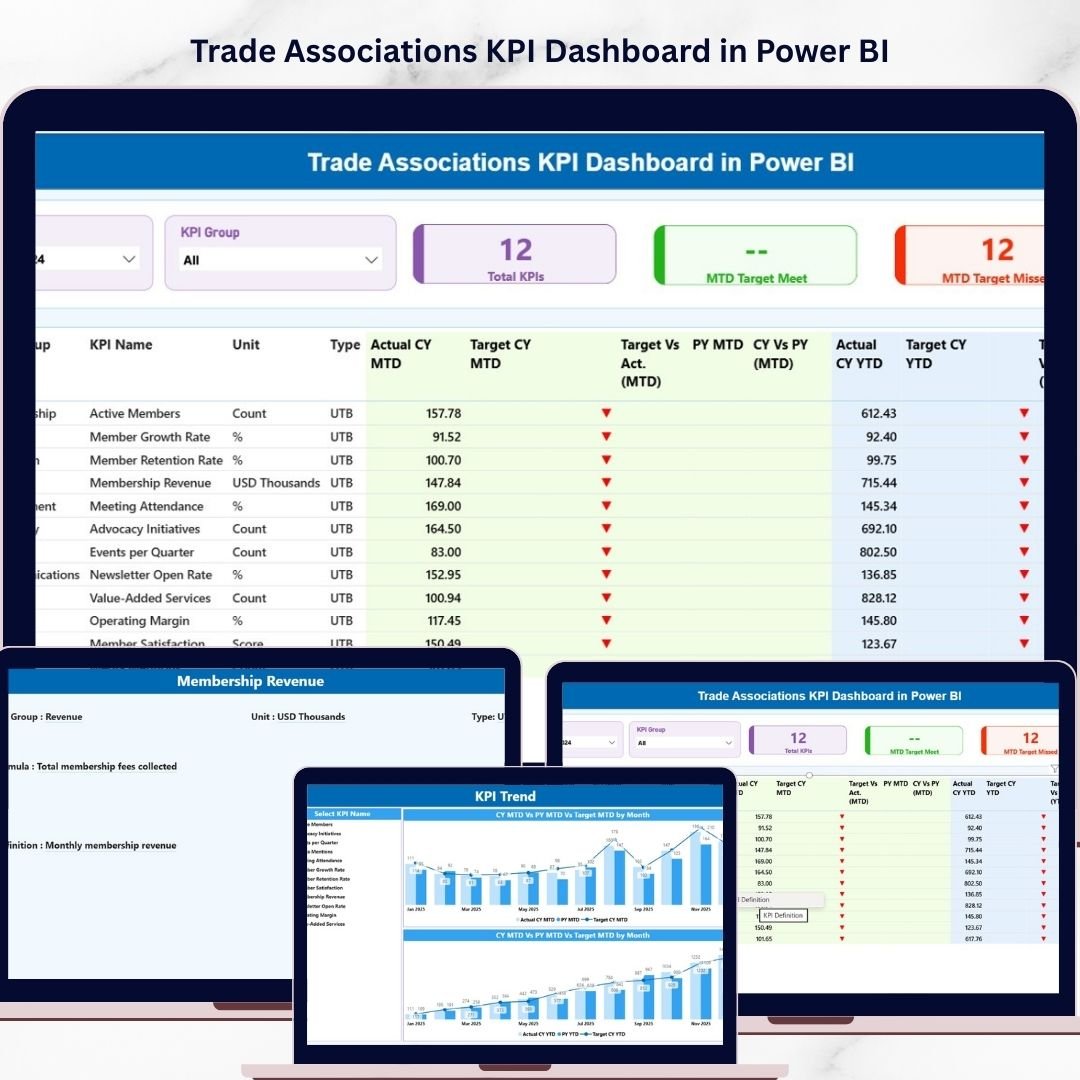
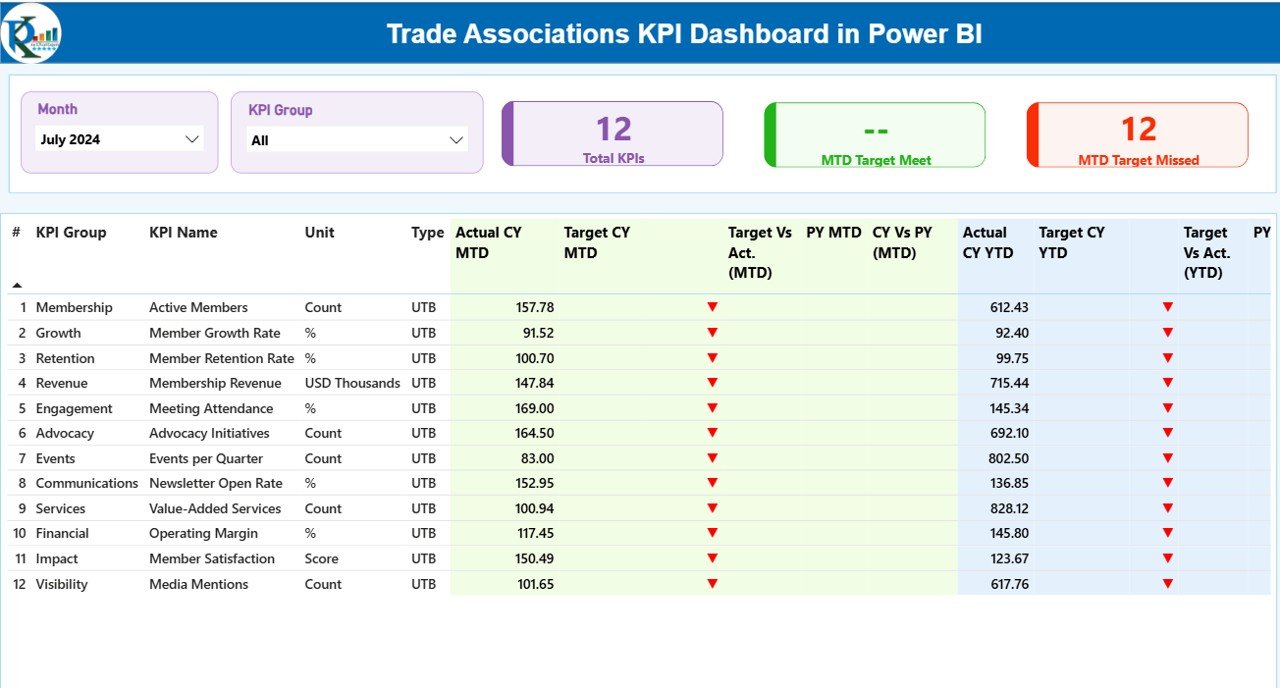
1️⃣ Summary Page
The Summary Page serves as the central performance overview of the dashboard.
It includes two slicers at the top:
-
Month Slicer – Select the reporting month.
-
KPI Group Slicer – Filter KPIs by category.
The page also features three key performance cards:
-
Total KPIs Count
-
MTD Target Meet Count
-
MTD Target Missed Count
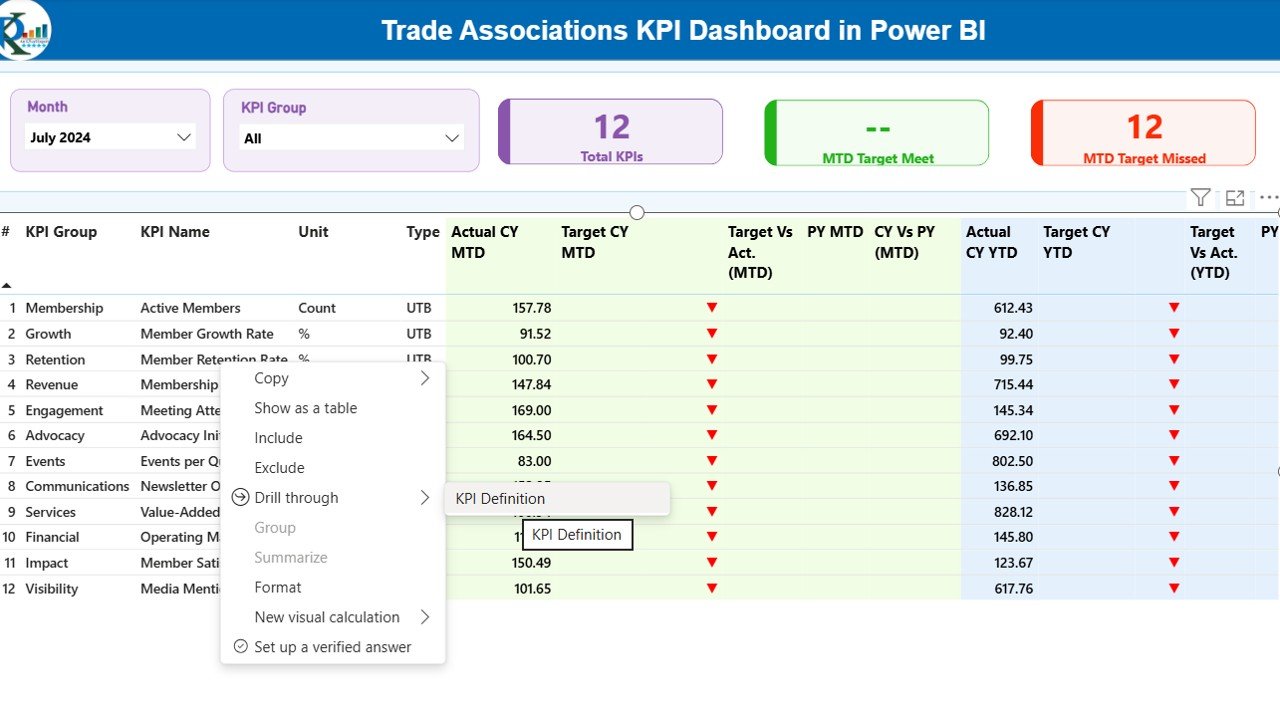
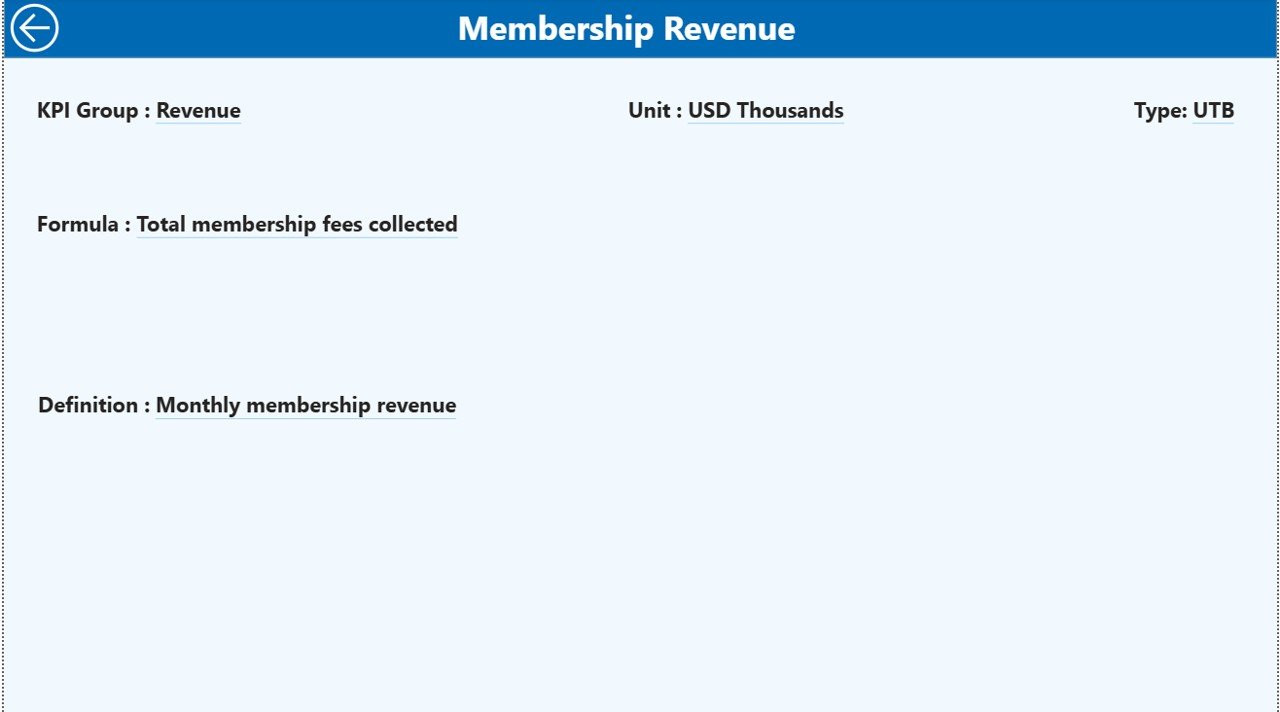
Below the KPI cards, a detailed table displays critical KPI information including:
-
KPI Number
-
KPI Group
-
KPI Name
-
Unit of Measurement
-
KPI Type (UTB – Upper the Better / LTB – Lower the Better)
-
Actual CY MTD
-
Target CY MTD
-
Previous Year CY MTD
-
KPI Status
This structure allows users to quickly review KPI performance and identify areas needing improvement.
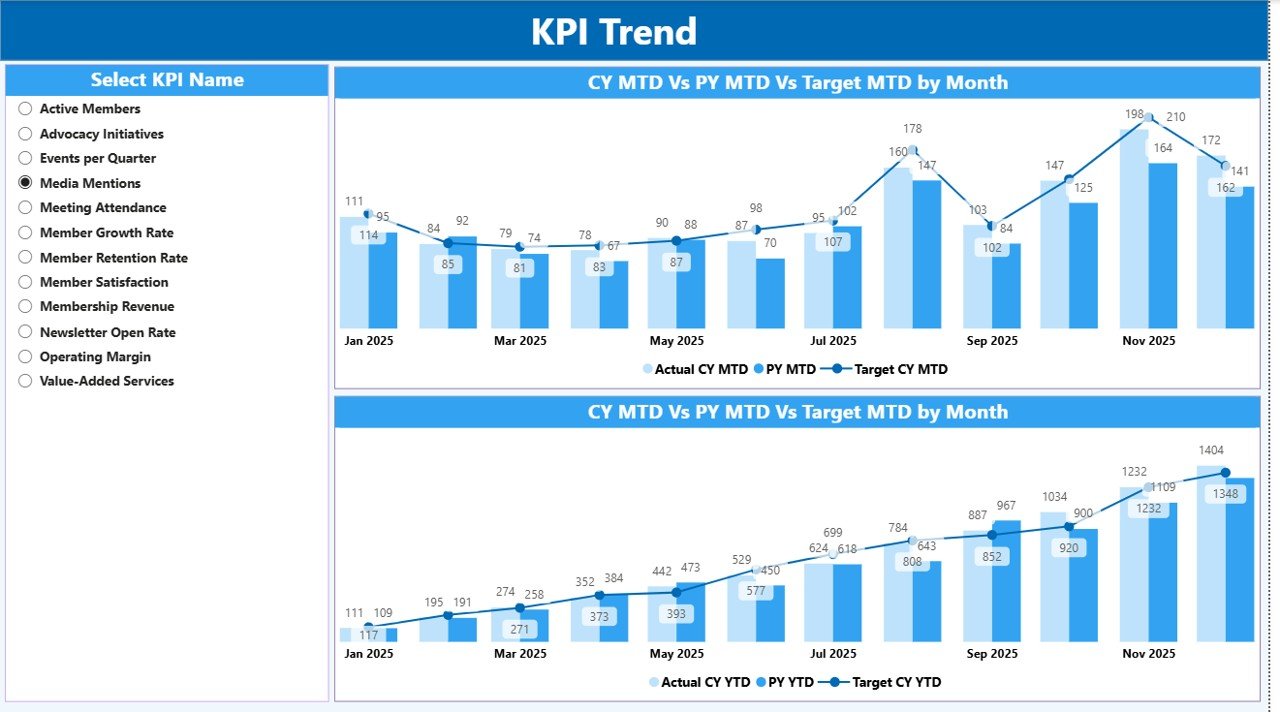
2️⃣ KPI Trend Analysis Page
This page focuses on tracking performance trends across KPIs.
Users can evaluate how KPIs are performing over time by analyzing:
-
Actual performance trends
-
Target comparisons
-
Historical performance indicators
Trend analysis helps trade associations identify patterns, performance improvements, and potential issues early.
3️⃣ KPI Group Analysis Page
The KPI Group Analysis Page allows users to analyze KPI performance by category or department.
This page helps answer questions such as:
-
Which KPI groups are performing best?
-
Which operational areas need improvement?
-
Where should management focus attention?
By providing category-level insights, this page enables deeper strategic analysis.
⚙️ How to Use the Trade Associations KPI Dashboard in Power BI
Using the dashboard is simple and requires minimal setup.
Step 1: Enter your KPI data into the connected Excel data source.
Step 2: Load or refresh the data inside Power BI.
Step 3: Select the desired Month and KPI Group using slicers.
Step 4: Review KPI cards, charts, and detailed tables to analyze performance.
Step 5: Use the insights to guide operational improvements and strategic decisions.
Within minutes, your organization can transform raw data into powerful performance insights.
👥 Who Can Benefit from This Trade Associations KPI Dashboard in Power BI
This dashboard is ideal for organizations that need structured KPI monitoring and data-driven decision-making.
It is especially useful for:
-
Trade Associations
-
Membership Organizations
-
Non-profit Organizations
-
Industry Councils
-
Business Associations
-
Operational Managers
-
Data Analysts
-
Executive Leadership Teams
Any organization that tracks performance indicators will benefit from the clarity and insights provided by this dashboard.
Click here to read the Detailed blog post
Watch the step-by-step video tutorial: