Monitoring business valuation metrics is essential for financial analysts, consulting firms, investors, and corporate finance teams. However, many organizations still rely on scattered spreadsheets, manual calculations, and static reports to track valuation performance. This often leads to delays in reporting, difficulty in identifying trends, and limited visibility into financial performance.
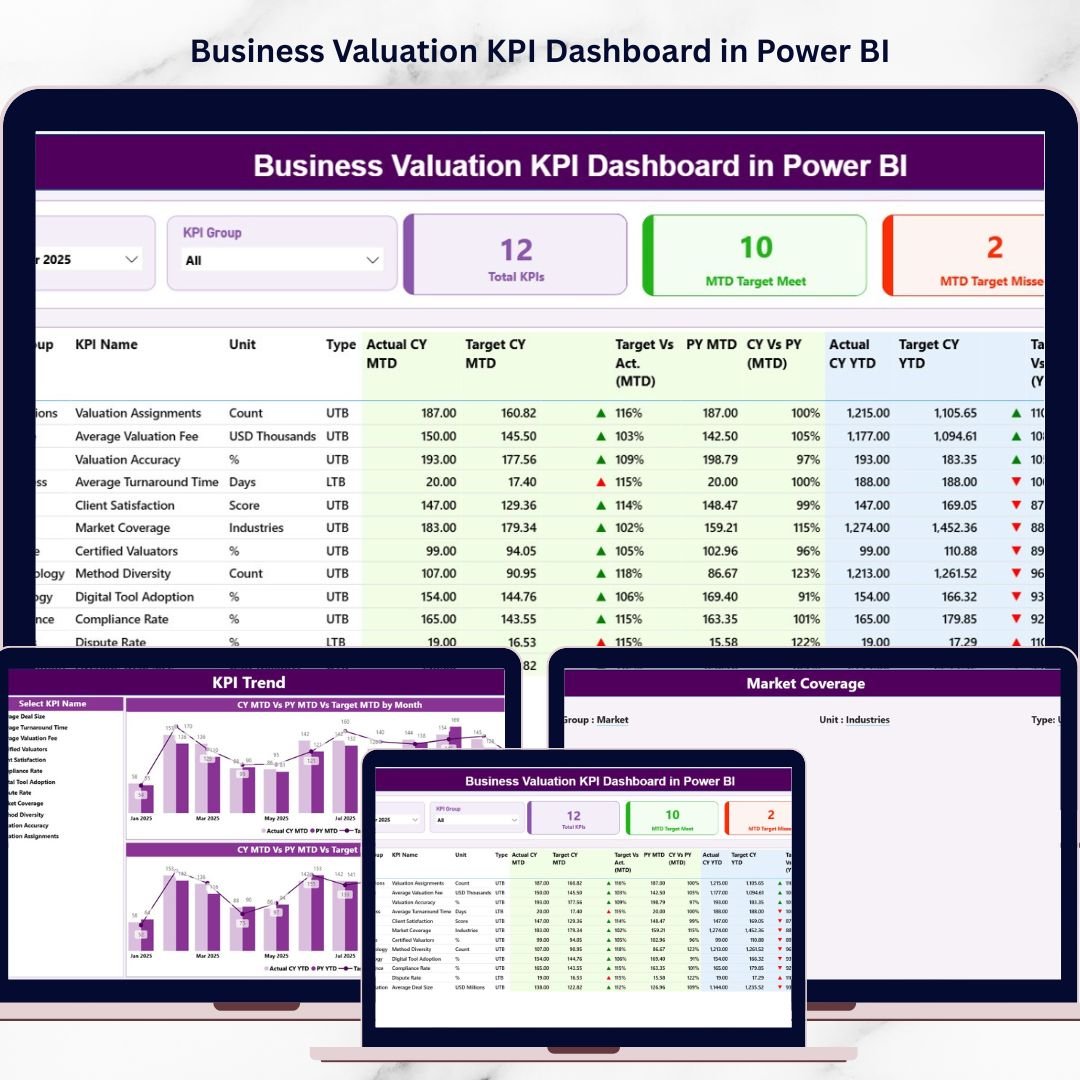
The Business Valuation KPI Dashboard in Power BI solves this problem by transforming complex financial data into clear, interactive, and easy-to-understand insights. This ready-to-use Power BI dashboard allows organizations to monitor valuation KPIs, compare performance against targets, and analyze financial trends using dynamic visuals and automated calculations.
Instead of spending hours compiling reports, users can instantly explore valuation metrics through interactive charts, slicers, and KPI indicators. Because Power BI provides powerful data visualization and filtering capabilities, decision-makers can quickly evaluate financial performance and identify areas that require improvement.
This dashboard is designed for organizations that want a professional analytics solution to monitor valuation indicators, analyze business performance, and support strategic financial decisions.
Whether you are a financial analyst, valuation consultant, investor, CFO, or business owner, this dashboard provides a centralized system for monitoring and analyzing business valuation KPIs.
🚀 Key Features of Business Valuation KPI Dashboard in Power BI
📊 Interactive KPI Monitoring Dashboard
Analyze all valuation KPIs in a single interactive dashboard designed with professional Power BI visuals.
📅 Dynamic Month Selection Filter
Select any month using the slicer and instantly update the entire dashboard to analyze performance for that period.
📂 KPI Group Filtering
Users can filter KPIs by category or group to focus on specific valuation metrics.
🎯 Target vs Actual KPI Comparison
Automatically compare actual performance against targets to evaluate operational efficiency.
📈 Current Year vs Previous Year Analysis
Measure business growth by comparing current year performance with previous year results.
🔺 Visual KPI Performance Indicators
Green and red arrows help quickly identify whether KPIs are meeting targets or underperforming.
📉 Advanced KPI Trend Analysis
Dynamic combo charts allow users to track KPI trends across months and evaluate performance patterns.
🔍 Drill-Through KPI Definition Page
Users can drill through to a detailed KPI page that explains formulas, definitions, and measurement units.
📊 Automated KPI Calculations
Power BI automatically calculates comparisons, percentages, and performance indicators.
📁 Excel Data Integration
The dashboard connects with an Excel data source that stores actual values, targets, and KPI definitions.
📊 What’s Inside the Business Valuation KPI Dashboard in Power BI
This dashboard contains three powerful analytical pages designed to provide deep insights into valuation performance.
🏠 Summary Page – KPI Performance Overview
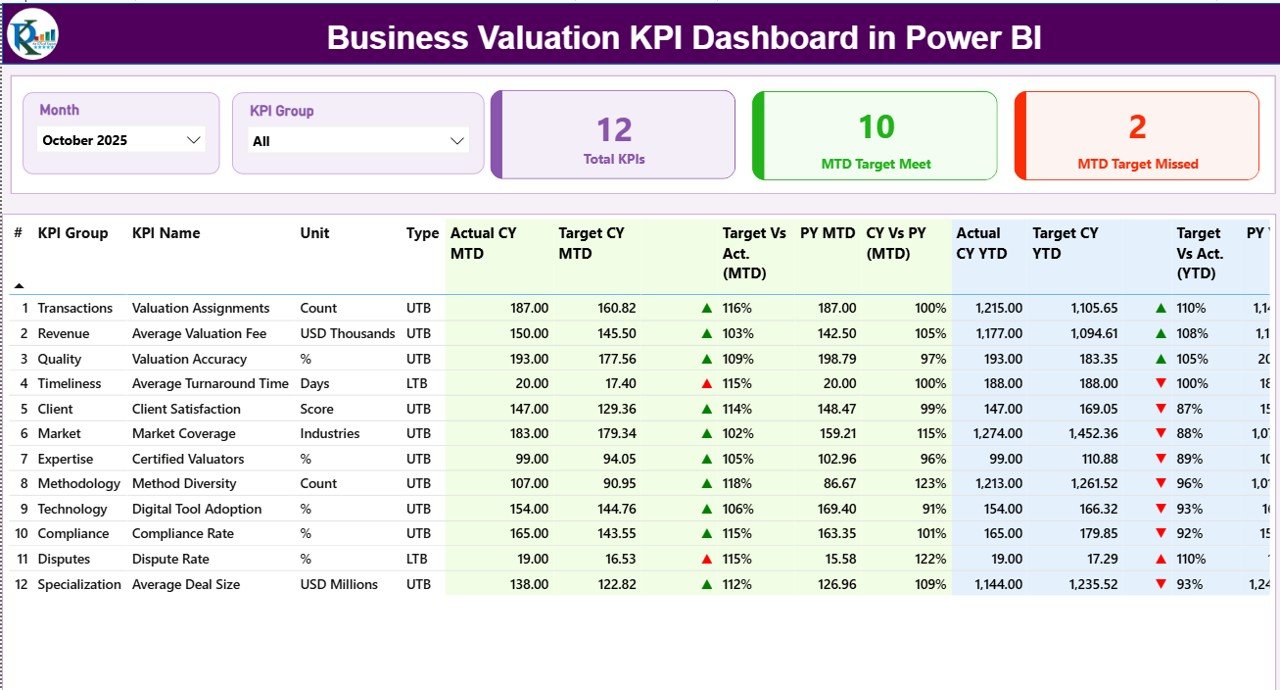
This is the main dashboard page where users can view overall KPI performance. It includes two interactive slicers:
• Month Slicer
• KPI Group Slicer
These slicers allow users to dynamically filter the dashboard.
The page also contains three important KPI cards:
• Total KPIs Count
• MTD Target Meet Count
• MTD Target Missed Count
A detailed KPI performance table displays key information such as KPI number, group, name, unit, type, actual values, targets, previous year comparisons, and performance indicators.
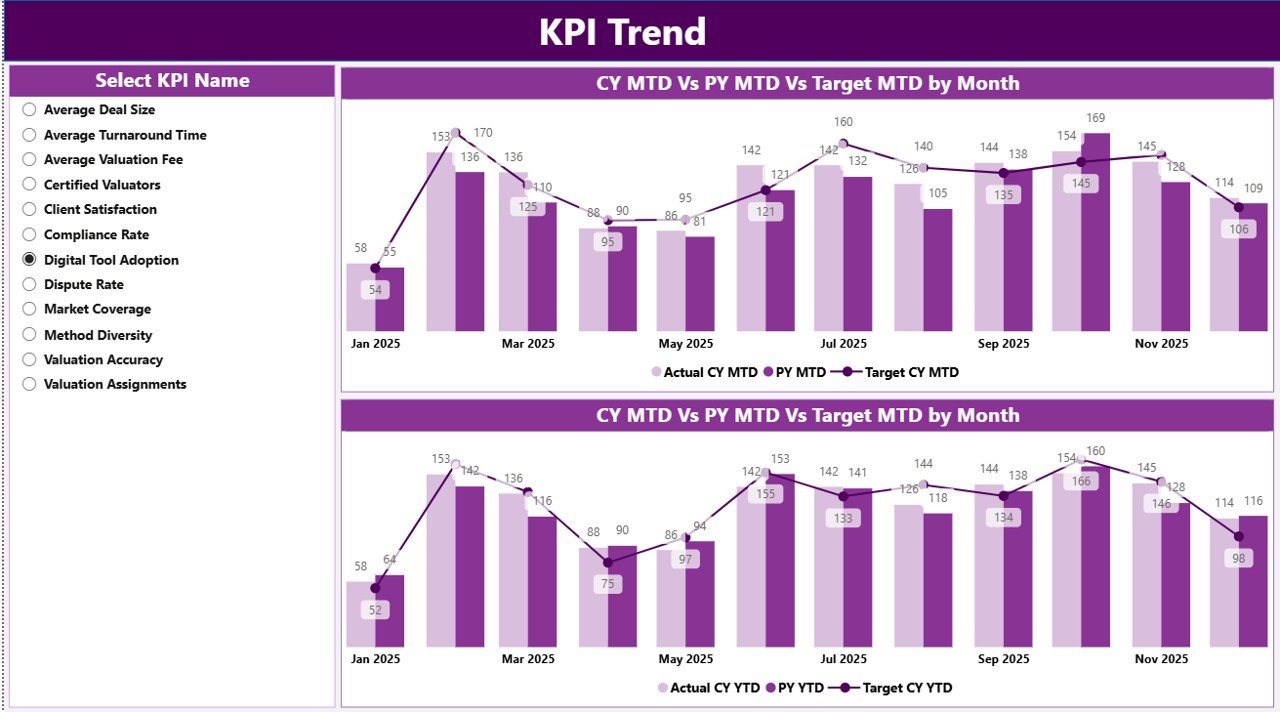
📈 KPI Trend Page – Performance Trend Analysis
This page helps users analyze KPI performance over time. Users can select a specific KPI using a slicer, and the dashboard displays two interactive trend charts:
• MTD Performance Trend
• YTD Performance Trend
These charts compare Actual values, Target values, and Previous Year values, helping users identify trends, growth patterns, and seasonal variations.
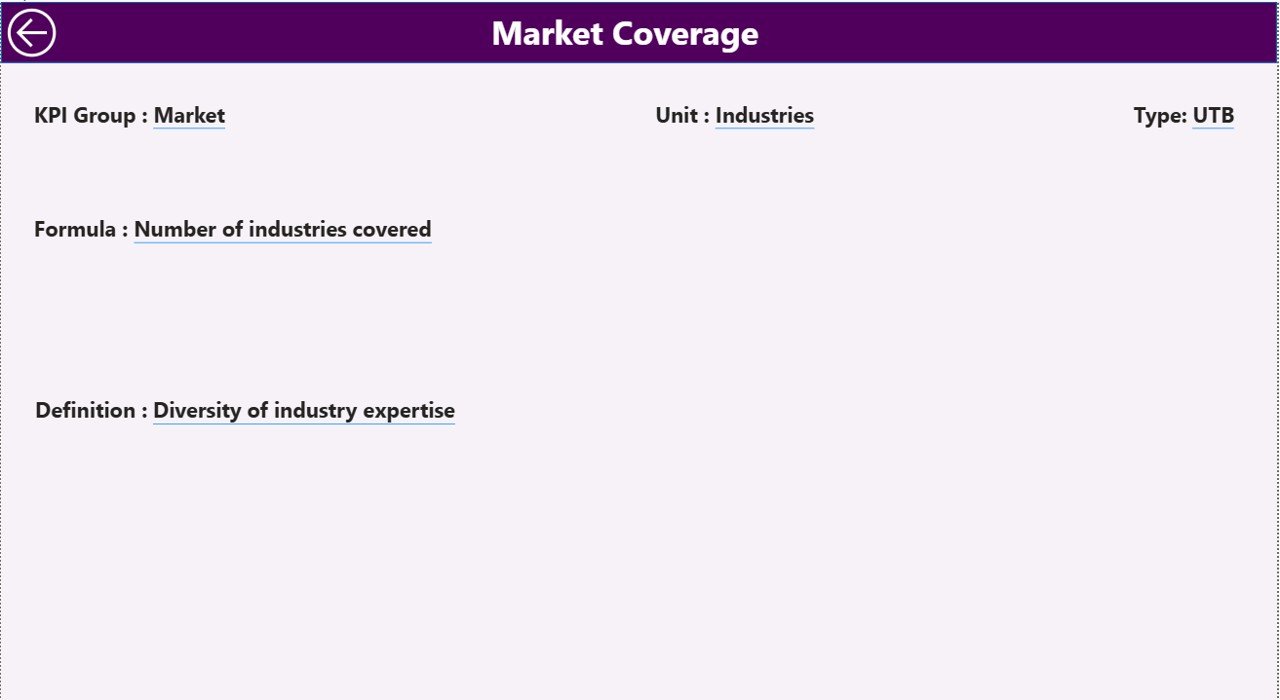
📘 KPI Definition Page – KPI Details & Formula Explanation
This page provides complete details about each KPI, including:
• KPI Formula
• KPI Definition
• KPI Unit
• KPI Group
• KPI Type (UTB or LTB)
Users can access this page using the Power BI drill-through feature, allowing deeper analysis of each KPI.
⚙️ How to Use the Business Valuation KPI Dashboard in Power BI
Using this dashboard is simple and requires minimal technical expertise.
1️⃣ Enter Actual KPI values in the Excel data source.
2️⃣ Input Target KPI values for performance benchmarks.
3️⃣ Define KPIs in the KPI Definition sheet with formula, group, and unit.
4️⃣ Connect the Excel file with the Power BI dashboard.
5️⃣ Use Month and KPI Group slicers to filter the dashboard dynamically.
6️⃣ Analyze KPI performance using the Summary Page and Trend Page.
With just a few simple steps, organizations can convert raw financial data into powerful valuation insights.
👨💼 Who Can Benefit from This Business Valuation KPI Dashboard in Power BI
This dashboard is valuable for professionals who need to monitor financial performance and valuation metrics.
💼 Financial Analysts – Track valuation indicators and financial performance trends.
🏢 Corporate Finance Teams – Monitor company valuation metrics regularly.
📊 Investment Firms – Analyze portfolio company performance effectively.
👨💻 Consulting Firms – Provide valuation insights and financial reporting to clients.
📈 Business Owners & Executives – Evaluate company performance using structured analytics.
🎓 Finance Students & Researchers – Learn KPI-based financial analysis.
Organizations that adopt this dashboard gain better financial transparency, faster reporting, and more informed decision-making.
Click hare to read the Detailed blog post
Visit our YouTube channel to learn step-by-step video tutorials
https://youtube.com/@PKAnExcelExpert


