
Managing a co-working space requires constant monitoring of performance metrics such as occupancy rates, revenue per desk, operational costs, customer satisfaction, and many other business indicators. However, tracking these metrics across different spreadsheets or reports can quickly become confusing and time-consuming.
This is exactly where the Co-working Spaces KPI Dashboard in Excel becomes an incredibly powerful solution.
The Co-working Spaces KPI Dashboard in Excel is a ready-to-use and professionally designed Excel template that allows managers, accountants, and business owners to track key performance indicators in a structured and visually interactive way. Instead of manually reviewing multiple reports, this dashboard consolidates important business metrics into a single easy-to-understand interface.
With automated KPI tracking, dynamic charts, and organized input sheets, this template helps co-working space managers monitor operational performance, compare targets with actual results, and identify business trends quickly.
Whether you manage one location or multiple co-working facilities, this dashboard enables smarter decisions, improved financial tracking, and better operational control.
🚀 Key Features of Co-working Spaces KPI Dashboard in Excel
✨ Fully Automated KPI Tracking
Monitor important KPIs such as occupancy rates, revenue metrics, customer engagement, and operational performance with automated calculations.
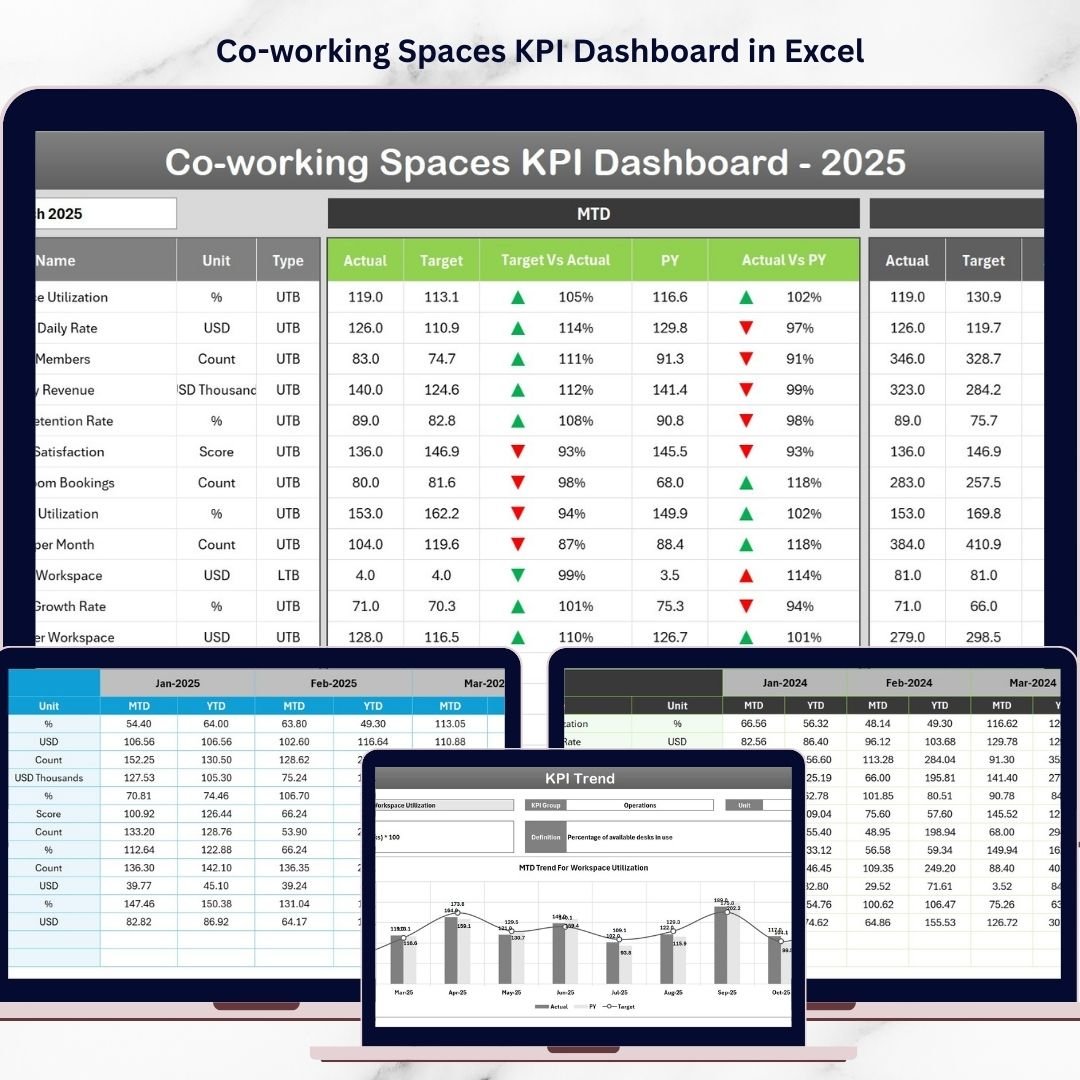
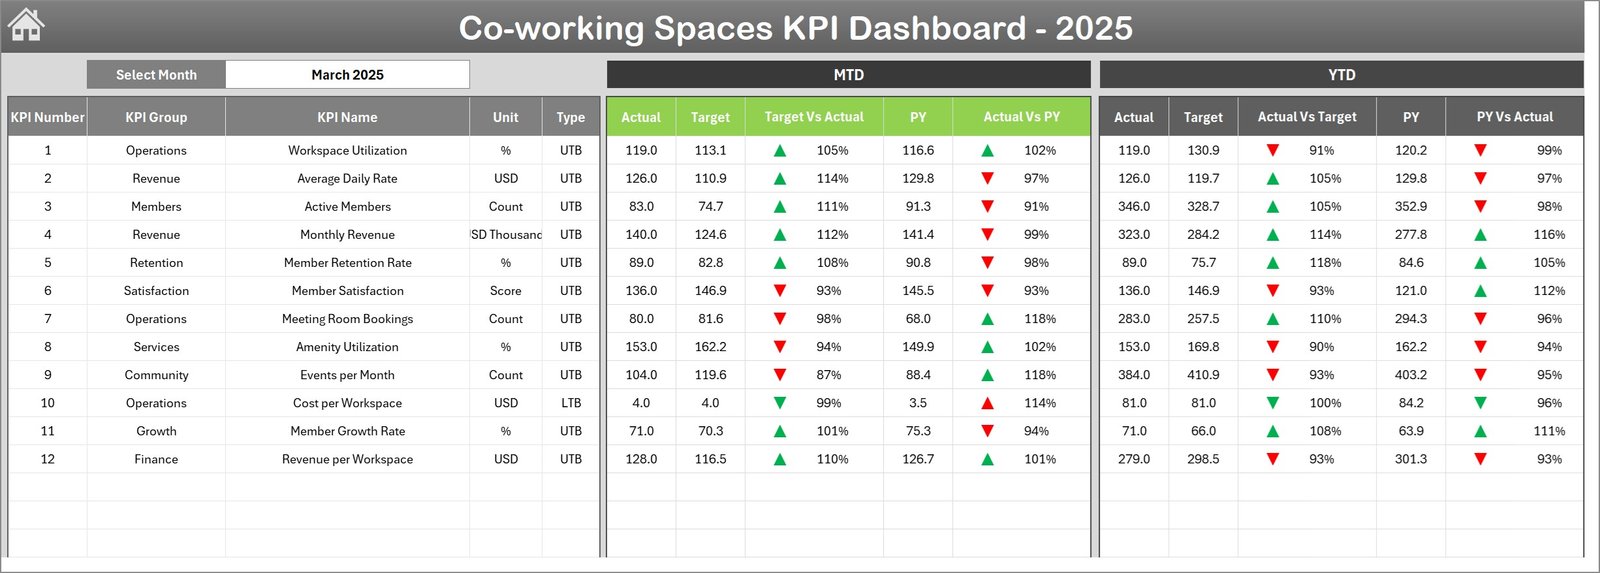
📊 Dynamic KPI Dashboard
A central dashboard displays MTD (Month-To-Date) and YTD (Year-To-Date) performance metrics, making it easy to compare targets, actual values, and previous year performance.
📅 Interactive Month Selection
Select any month from the dropdown to instantly update the dashboard visuals and performance comparisons.
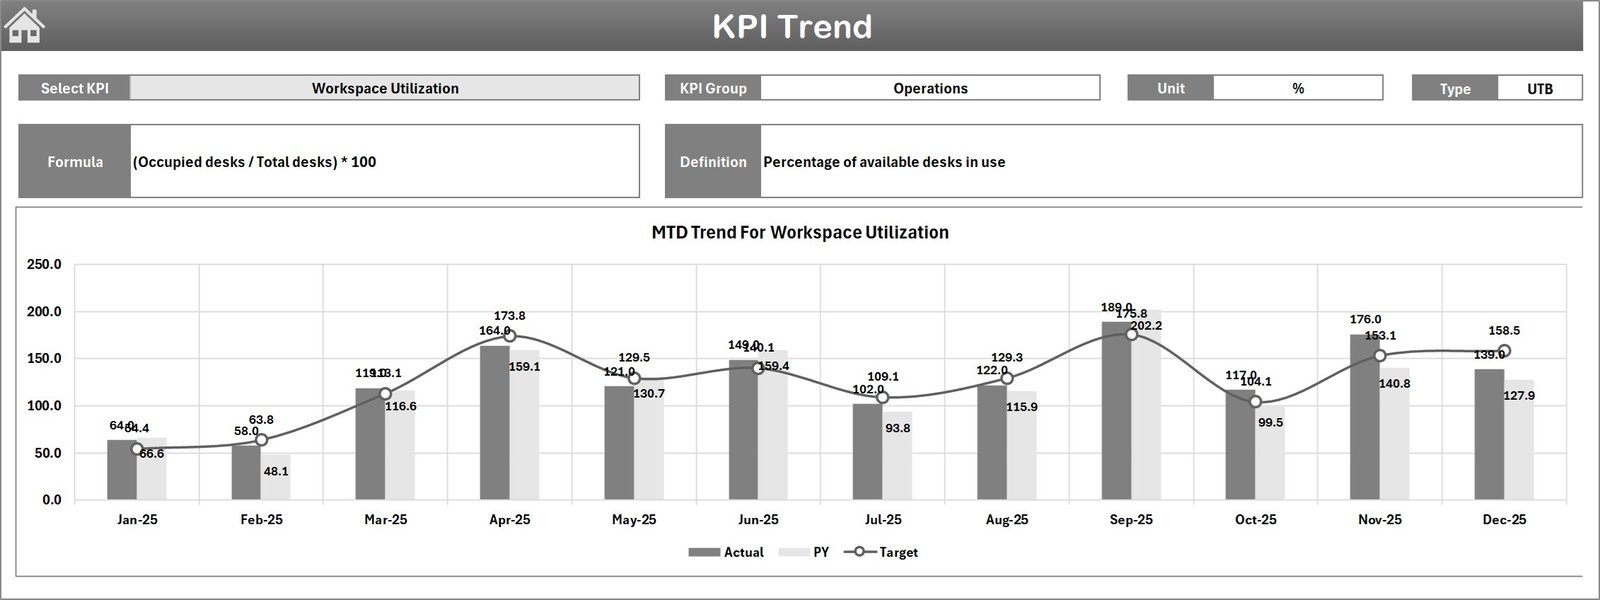
📈 KPI Trend Analysis Charts
Analyze performance trends over time using automated charts that show KPI progress across months.
⚡ Conditional Formatting Indicators
Quickly identifies performance improvements or declines with upward and downward arrows, helping managers react faster.
📂 Organized Data Input Sheets
Separate sheets are available for Actual Numbers, Target Values, Previous Year Data, and KPI Definitions, ensuring accurate and organized data management.
🎯 KPI Definition Management
Define KPIs clearly with attributes such as group, formula, unit of measurement, and performance type (Lower-the-Better or Upper-the-Better).
📑 User-Friendly Navigation
A Home sheet with navigation buttons allows users to easily jump between dashboard sections without searching through worksheets.
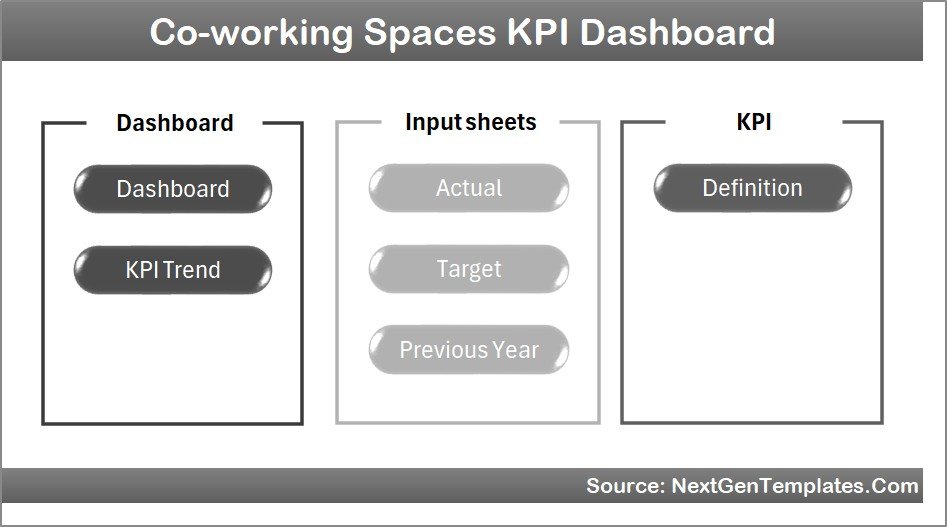
📦 What’s Inside the Co-working Spaces KPI Dashboard
This Excel template includes seven fully designed worksheets to simplify KPI monitoring and data management.
🏠 Home Sheet
Acts as the dashboard index page with navigation buttons that quickly direct users to the required sheets.
📊 Dashboard Sheet
The main performance dashboard showing KPI comparisons including:
-
MTD Actual vs Target
-
MTD Actual vs Previous Year
-
YTD Actual vs Target
-
YTD Actual vs Previous Year
📈 KPI Trend Sheet
This sheet provides detailed trend analysis for selected KPIs. Users can select a KPI from a dropdown menu and view trend charts comparing Actual, Target, and Previous Year values.
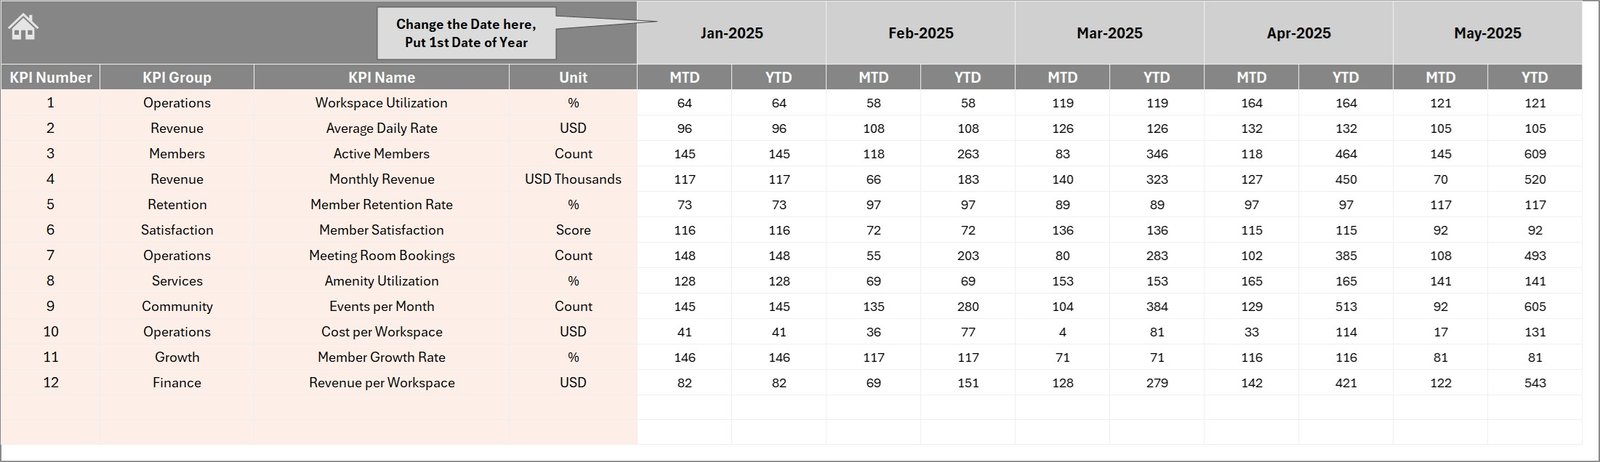
📥 Actual Numbers Input Sheet
Enter the monthly actual KPI data for both MTD and YTD periods.
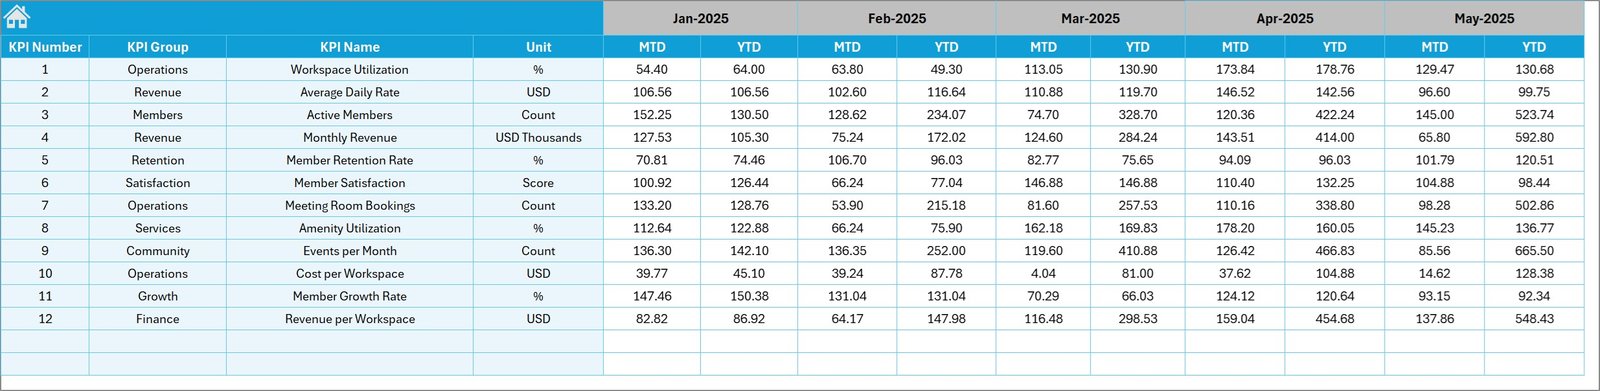
🎯 Target Numbers Sheet
Input monthly target values for each KPI, enabling performance comparison against goals.
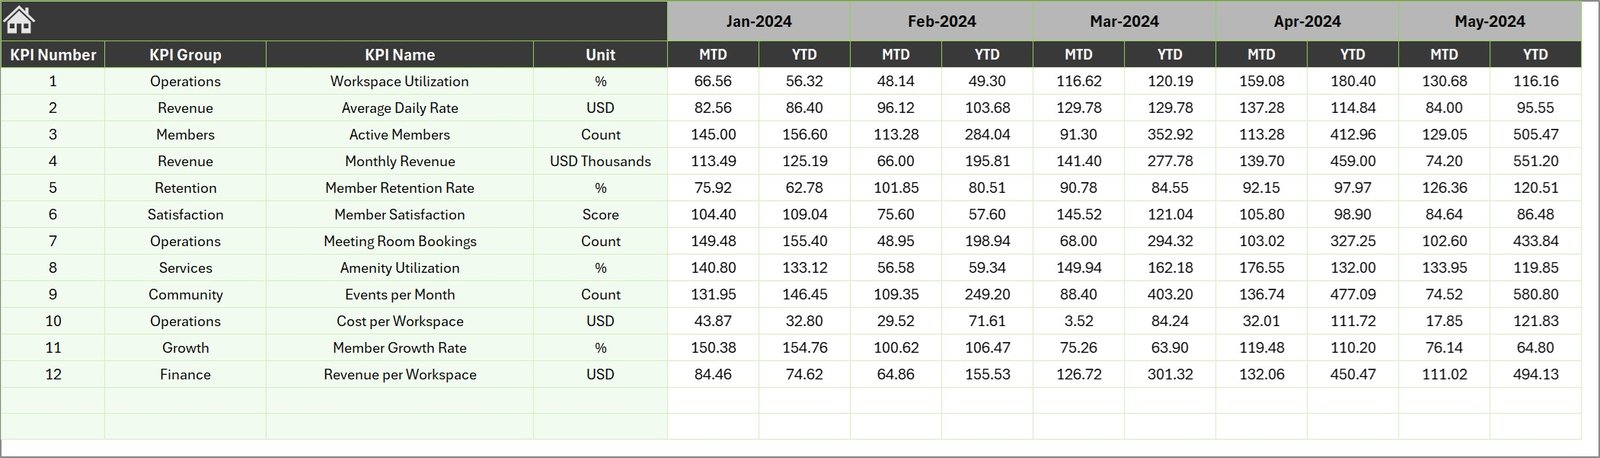
📊 Previous Year Numbers Sheet
Enter last year’s data to evaluate business growth and historical performance trends.
📑 KPI Definition Sheet
Maintain KPI details including KPI group, unit, formula, description, and performance type.
🛠 How to Use the Co-working Spaces KPI Dashboard
Using this dashboard is extremely simple and requires only basic Excel knowledge.
1️⃣ Enter KPI details in the KPI Definition sheet.
2️⃣ Input monthly Actual Numbers for each KPI.
3️⃣ Enter monthly Target Values to define performance goals.
4️⃣ Add Previous Year Data for comparison analysis.
5️⃣ Select the desired month from the dropdown on the dashboard.
Once data is entered, the dashboard automatically generates performance visuals and trend analysis.
Managers can instantly monitor performance gaps, identify trends, and make data-driven decisions.
👥 Who Can Benefit from This Co-working Spaces KPI Dashboard
This dashboard is ideal for professionals responsible for managing and analyzing co-working space performance.
🏢 Co-working Space Owners – Monitor business growth and operational performance.
📊 Operations Managers – Track occupancy, revenue performance, and operational KPIs.
💼 Accountants and Finance Teams – Monitor financial indicators and profitability metrics.
📈 Business Analysts – Evaluate performance trends and business growth opportunities.
🏬 Multi-location Workspace Operators – Consolidate and analyze performance across multiple facilities.
By using this template, businesses gain a centralized KPI monitoring system that improves transparency and decision-making.
Click here to read the Detailed blog post
Visit our YouTube channel to learn step-by-step video tutorials
👉 https://youtube.com/@PKAnExcelExpert