Street lighting is one of the most critical components of modern urban infrastructure. Properly managed lighting systems improve road safety, reduce accidents, enhance public security, and support smart city development. Street Lighting Services KPI Dashboard in Power BI However, managing thousands of streetlights across a city requires efficient monitoring of maintenance activities, operational costs, and service performance.
Street Lighting Services KPI Dashboard in Power BI Many municipalities still rely on scattered spreadsheets and manual reporting systems to monitor street lighting operations. As a result, managers struggle to track key performance indicators, analyze service efficiency, and identify operational issues quickly.
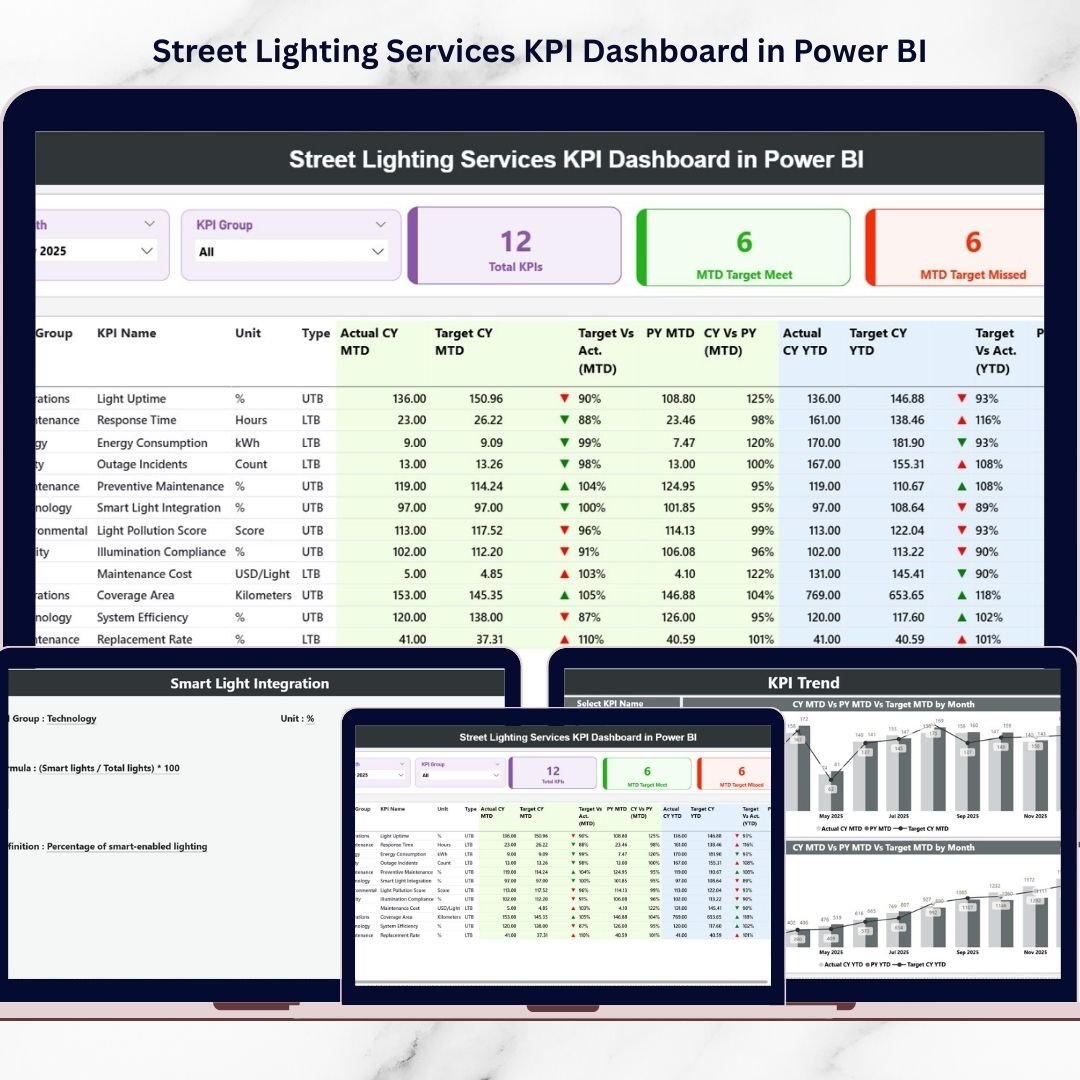
The Street Lighting Services KPI Dashboard in Power BI provides a powerful and ready-to-use business intelligence solution that helps municipalities and infrastructure teams monitor street lighting performance in one centralized platform. This interactive dashboard transforms operational data into dynamic visual reports, KPI indicators, and trend charts, enabling decision-makers to evaluate service performance and make faster, data-driven decisions.
With this Power BI dashboard, organizations can monitor maintenance performance, operational KPIs, service efficiency, and performance trends using interactive visual analytics. Because Power BI supports real-time filtering and advanced visualizations, users can easily analyze data and identify improvement opportunities.
⚡ Key Features of Street Lighting Services KPI Dashboard in Power BI
📊 Centralized KPI Monitoring
Monitor all street lighting KPIs in a single interactive Power BI dashboard, making performance analysis simple and efficient.
📈 Dynamic KPI Summary Page
The dashboard includes a powerful summary page displaying key performance indicators such as total KPIs tracked, targets achieved, and targets missed.
🎯 Target vs Actual Performance Tracking
Compare actual KPI performance with defined targets to quickly identify performance gaps.
📉 Year-over-Year Performance Comparison
Evaluate improvements by comparing current performance with previous year metrics.
📊 Detailed KPI Performance Table
Analyze detailed KPI information including KPI group, measurement units, performance status, and comparisons.
📅 Monthly Performance Monitoring
Track Month-to-Date (MTD) performance metrics and identify operational trends across months.
📆 Year-to-Date Performance Analysis
Monitor Year-to-Date (YTD) progress to evaluate long-term service improvements.
📊 KPI Trend Analysis Charts
Visual combo charts display KPI performance trends for both MTD and YTD metrics.
🔍 Interactive Filters and Slicers
Use slicers such as Month and KPI Group to analyze performance dynamically.
🚀 Professional Power BI Visualization Design
Clean charts and visual indicators make complex infrastructure data easy to understand.
📦 What’s Inside the Street Lighting Services KPI Dashboard
This Power BI dashboard includes three structured analytical pages that provide comprehensive street lighting performance insights.
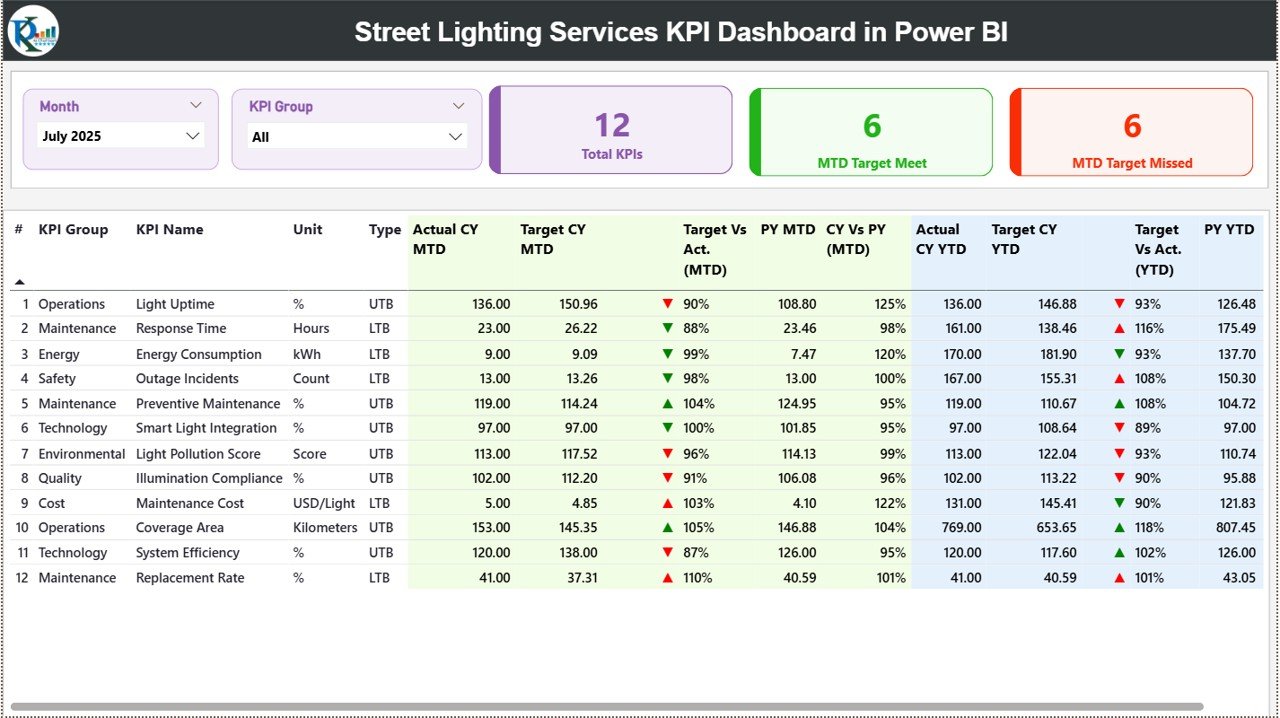
1️⃣ Summary Page – Main KPI Dashboard
The Summary Page acts as the main dashboard where users can monitor overall performance of street lighting services.
Interactive slicers available:
-
Month
-
KPI Group
Key KPI Cards displayed:
-
Total KPIs Count
-
MTD Target Meet Count
-
MTD Target Missed Count
These indicators provide a quick snapshot of service performance.
Below the KPI cards, a detailed KPI performance table displays important information such as:
-
KPI Number
-
KPI Group
-
KPI Name
-
Unit of measurement
-
KPI Type (Lower the Better / Upper the Better)
Performance metrics include:
MTD Metrics
-
Actual CY MTD
-
Target CY MTD
-
Target vs Actual comparison
-
Previous Year MTD value
-
Current Year vs Previous Year comparison
YTD Metrics
-
Actual CY YTD
-
Target CY YTD
-
Target vs Actual comparison
-
Previous Year YTD value
-
Current Year vs Previous Year comparison
Visual indicators (▲ ▼) help managers quickly identify performance improvements or declines.
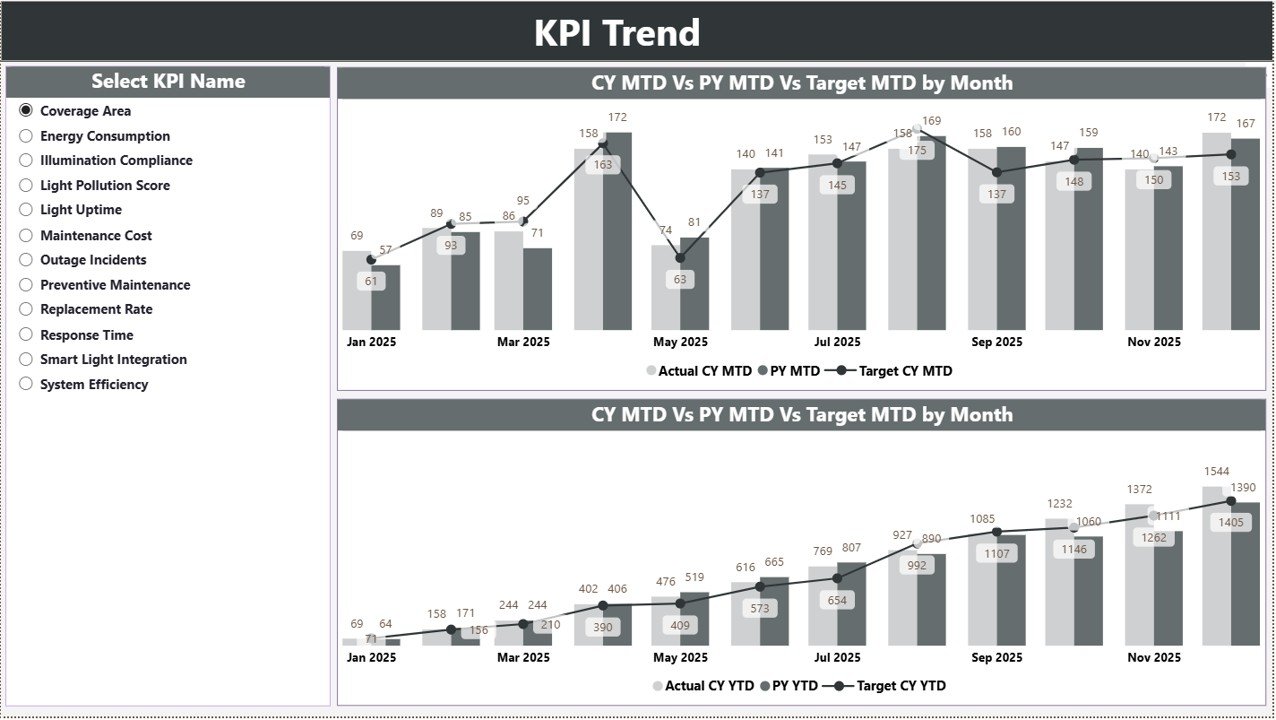
2️⃣ KPI Trend Page – KPI Performance Trends
The KPI Trend Page provides detailed analysis of KPI performance over time.
Users can select the KPI Name using a slicer.
Once a KPI is selected, the page automatically updates trend charts.
Charts included:
📊 MTD Trend Chart
Displays:
-
Current Year Actual values
-
Target values
-
Previous Year values
📊 YTD Trend Chart
Displays:
-
Current Year YTD performance
-
Target YTD values
-
Previous Year YTD values
These charts help infrastructure managers evaluate long-term performance trends.
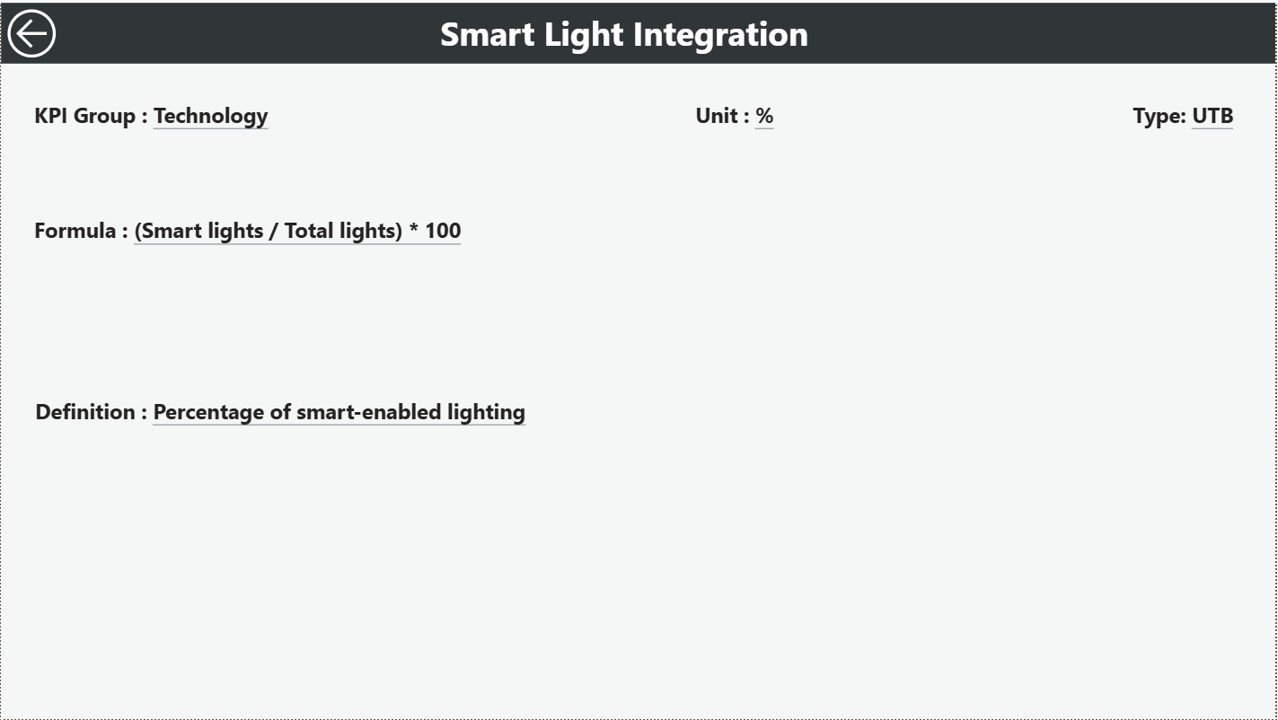
3️⃣ KPI Definition Page – KPI Details
The KPI Definition Page provides detailed information about each KPI.
This page works as a drill-through page, allowing users to access detailed KPI descriptions directly from the summary dashboard.
Information displayed includes:
-
KPI Formula
-
KPI Definition
-
KPI Category
This helps ensure clear understanding of KPI calculations and performance metrics.
🛠 How to Use the Street Lighting Services KPI Dashboard
Using this dashboard is simple and efficient.
1️⃣ Enter KPI definitions in the KPI Definition Excel sheet.
2️⃣ Enter actual KPI performance values in the Input Actual sheet.
3️⃣ Enter target KPI values in the Input Target sheet.
4️⃣ Import the Excel file into Power BI Desktop.
5️⃣ Refresh the dashboard to update all charts and KPI indicators.
6️⃣ Use slicers and filters to analyze service performance.
With this system, municipalities can easily monitor operational efficiency and identify performance gaps.
👨💼 Who Can Benefit from This Street Lighting Services KPI Dashboard?
This dashboard is extremely useful for professionals responsible for managing urban infrastructure.
🏙 Municipal Authorities – Monitor street lighting performance and infrastructure efficiency.
⚙ Infrastructure Management Teams – Track operational KPIs and service performance.
🔧 Maintenance Teams – Monitor repair activities and service response times.
📊 Data Analysts – Analyze operational data and generate actionable insights.
🌍 Smart City Project Managers – Evaluate urban infrastructure performance.
🏢 Public Infrastructure Consultants – Assess service quality and recommend improvements.
Click here to read the Detailed blog post
Visit our YouTube channel to learn step-by-step video tutorials
👉 YouTube Channel: https://youtube.com/@PKAnExcelExpert