Managing telecom networks is becoming increasingly complex as organizations handle massive volumes of operational data every day. Metrics such as network availability, call drop rate, latency, and data throughput must be continuously monitored to maintain service quality and customer satisfaction. However, many telecom companies still rely on scattered spreadsheets and manual reports, which makes it difficult to analyze performance quickly.
That is exactly why the Telecom Network KPI Scorecard in Excel is an essential solution for telecom professionals.
This ready-to-use Excel template helps telecom teams track and analyze network performance metrics in a structured and interactive format. Instead of reviewing multiple reports, users can monitor important KPIs from one centralized scorecard. As a result, managers can quickly compare actual performance vs target values, identify performance gaps, and take corrective action before issues impact customers.
Designed using the powerful capabilities of Microsoft Excel, this KPI scorecard combines data organization, visual indicators, dropdown filters, and trend analysis to provide a clear view of telecom network performance.
Let us explore the key features of this powerful template.
🚀 Key Features of Telecom Network KPI Scorecard in Excel
📊 Centralized KPI Monitoring
Track multiple telecom network KPIs in one structured scorecard without switching between different reports or spreadsheets.
🎯 Actual vs Target Performance Comparison
Instantly compare actual KPI values against target benchmarks to identify underperforming metrics quickly.
📅 MTD and YTD Performance Analysis
Analyze telecom performance using Month-to-Date (MTD) and Year-to-Date (YTD) calculations for deeper insights.
🎛 Interactive Dropdown Filters
Easily switch between months and performance views using dropdown selections for flexible KPI analysis.
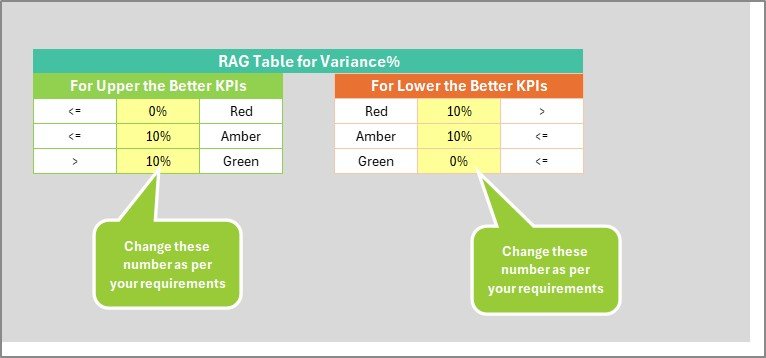
🟢 Visual Performance Indicators
Color-coded indicators highlight KPI performance:
Green = Target Achieved
Yellow = Moderate Performance
Red = Target Missed
📈 KPI Trend Analysis Charts
Visual charts display performance trends for selected KPIs including actual values, targets, and previous year comparisons.
🗂 Structured KPI Documentation
Maintain complete KPI definitions including formula, unit of measurement, and KPI group classification.
📑 10 KPIs in One View
Monitor up to 10 telecom KPIs simultaneously from a single scorecard interface.
⚡ Automated Calculations Using Excel Formulas
All KPI calculations and comparisons are automated, reducing manual work and reporting errors.
📥 Centralized Data Input System
A dedicated input sheet allows users to update KPI values easily while the dashboard updates automatically.
📦 What’s Inside the Telecom Network KPI Scorecard in Excel
This Excel template includes four well-structured worksheets that manage the entire KPI monitoring system.
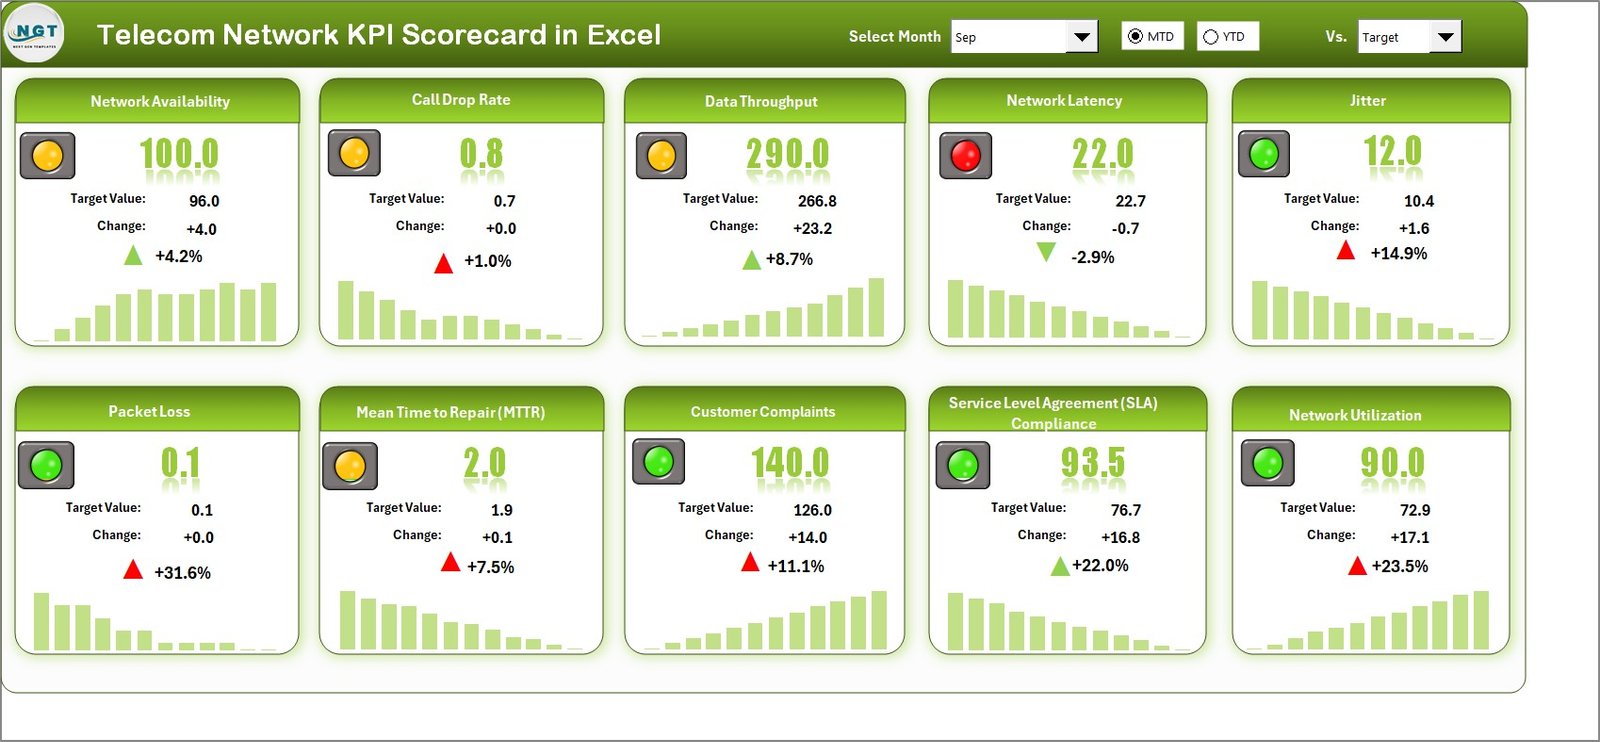
📊 Scorecard Sheet – Main KPI Dashboard
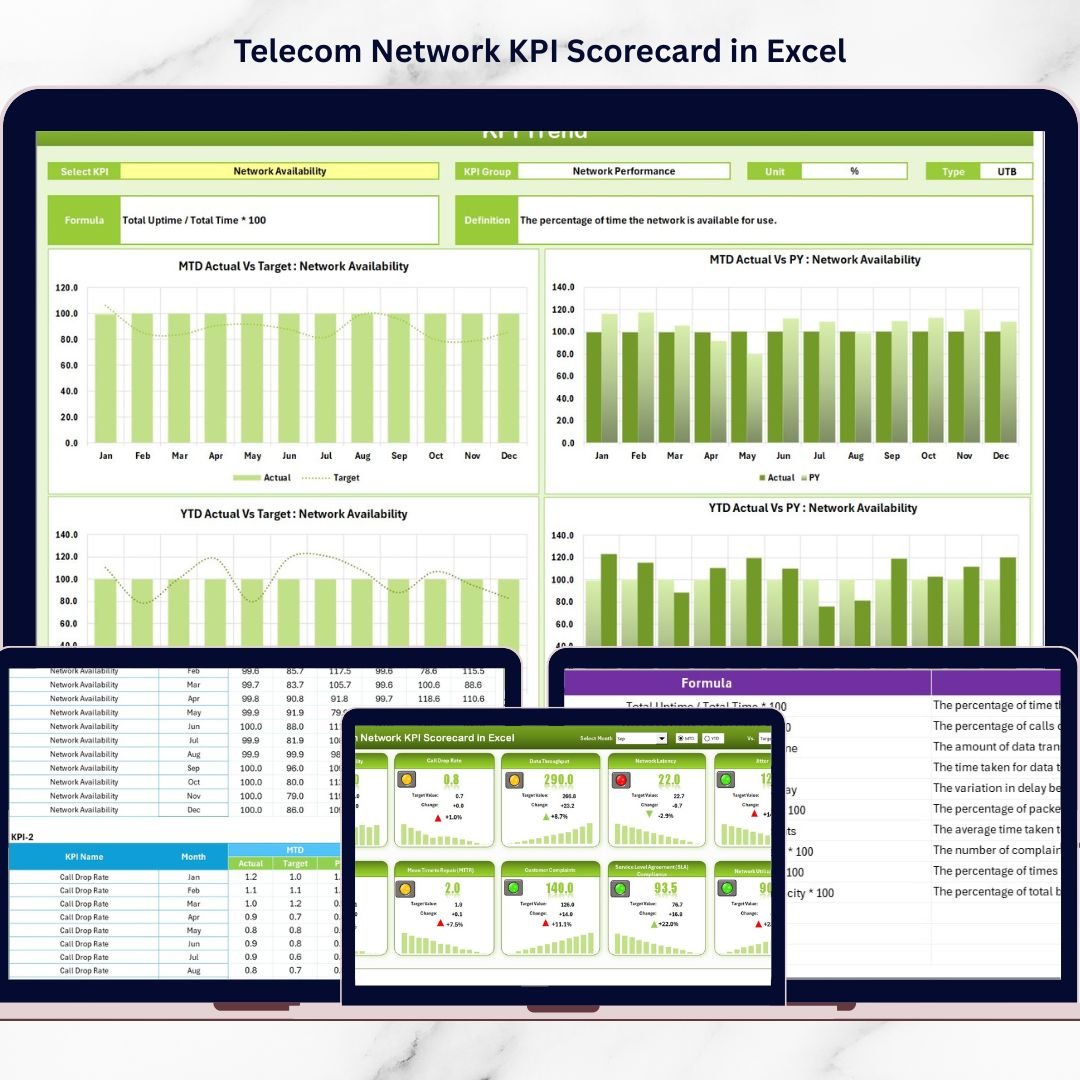
The scorecard sheet serves as the main interface where telecom managers can review KPI performance. It includes dropdown filters, actual vs target comparisons, KPI information, and visual indicators.
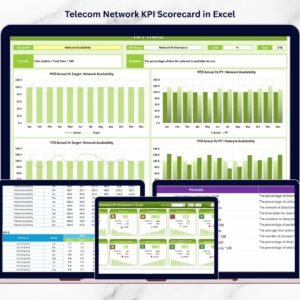
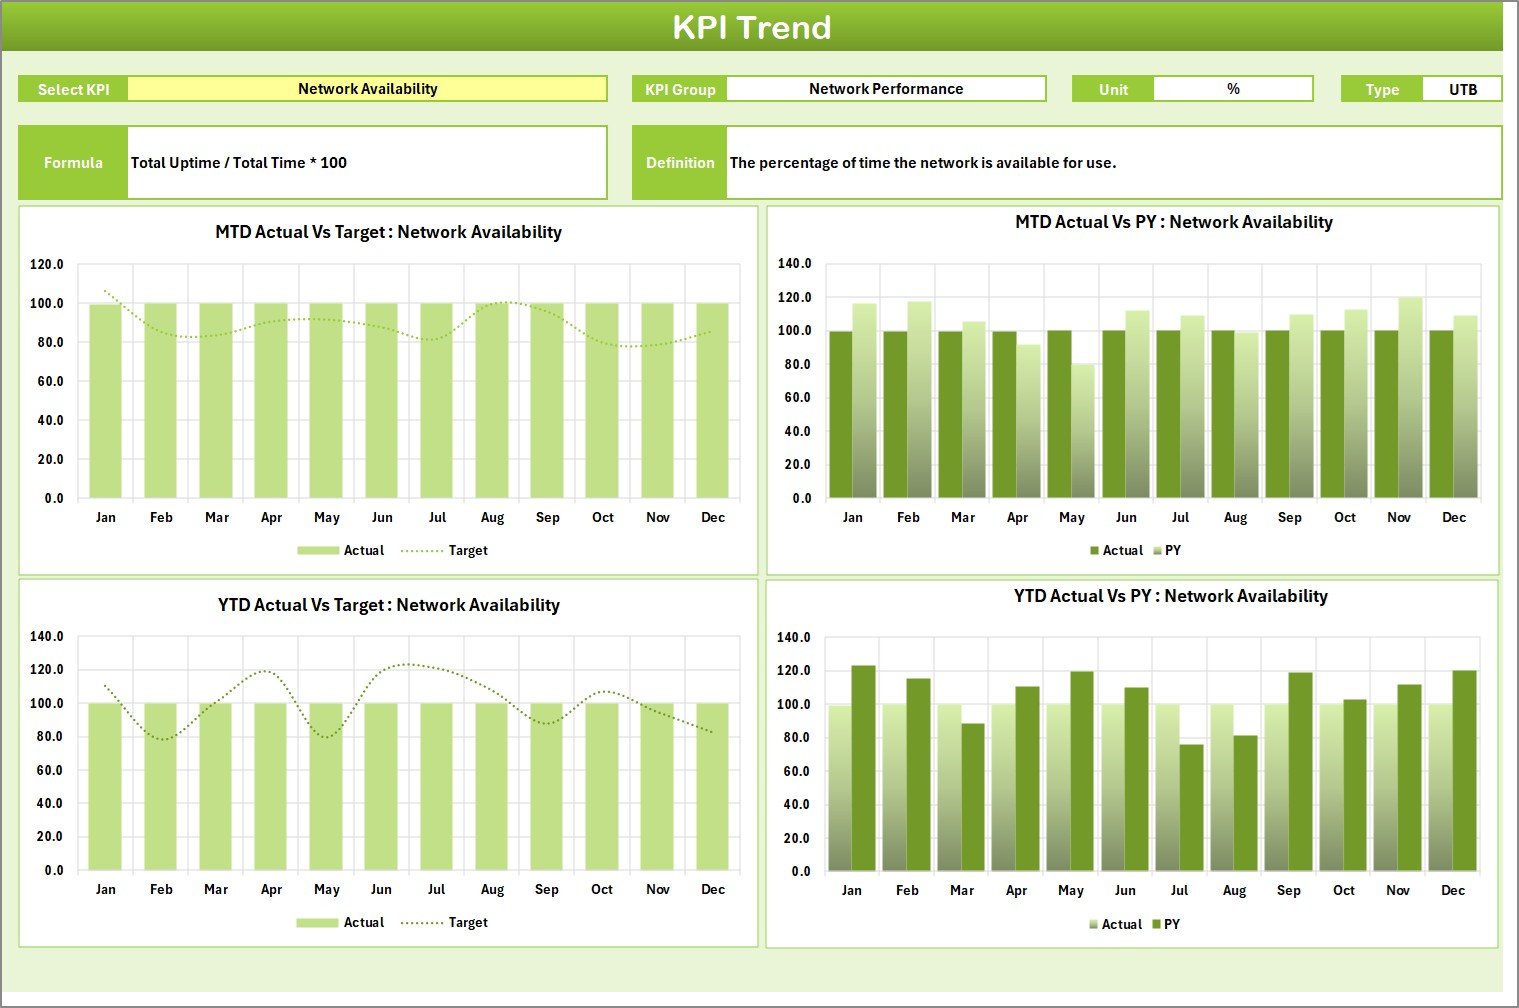
📈 KPI Trend Sheet – Performance Analysis
This sheet allows users to select a KPI from a dropdown list and analyze historical performance through trend charts. Users can view KPI group, formula, unit, and performance trends over time.
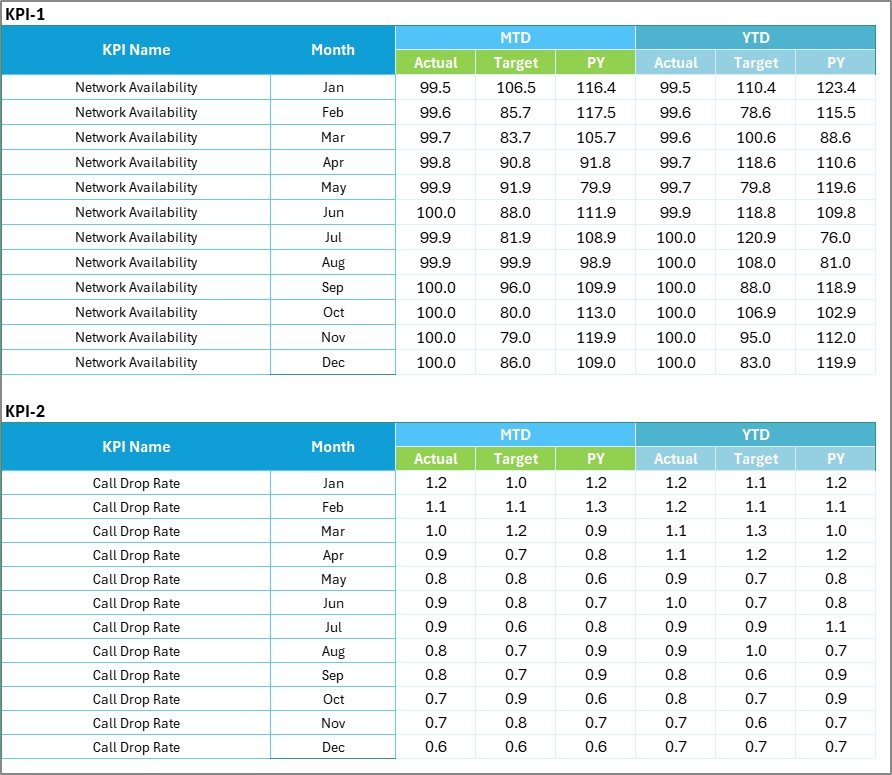
📝 Input Data Sheet – Centralized Data Entry
All KPI data including actual values, target values, and previous year data are entered in this sheet. Once data is updated, the scorecard automatically reflects the latest performance.
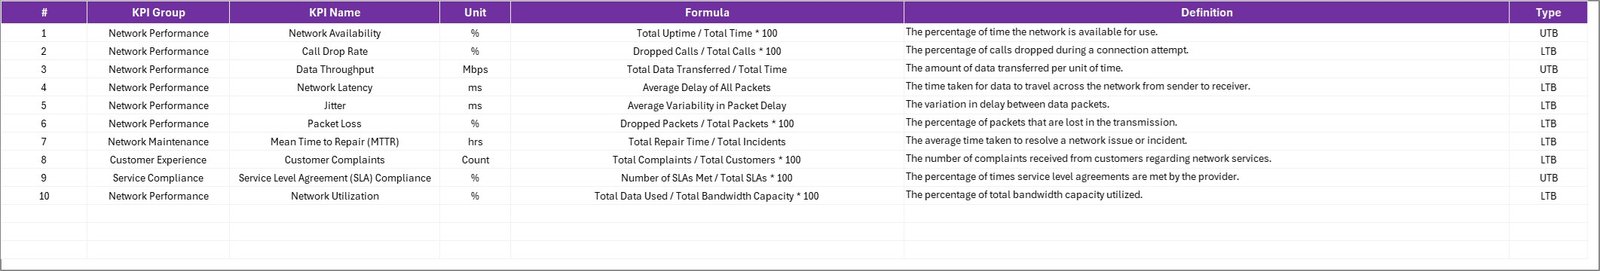
📚 KPI Definition Sheet – KPI Documentation
This sheet stores KPI details such as KPI name, group, formula, unit, and definition, helping organizations standardize performance metrics.
⚙️ How to Use the Telecom Network KPI Scorecard in Excel
Using the KPI scorecard is simple and efficient.
Step 1 – Enter KPI Data
Input actual values, target values, and previous year data in the Input Data Sheet.
Step 2 – Define KPIs
Update KPI information such as formula, unit, and KPI group in the KPI Definition Sheet.
Step 3 – Analyze Performance
Navigate to the Scorecard Sheet to review KPI performance using visual indicators and comparisons.
Step 4 – Study KPI Trends
Use the KPI Trend Sheet to analyze performance patterns and identify improvement opportunities.
Within minutes, telecom teams can convert raw data into meaningful performance insights.
👥 Who Can Benefit from This Telecom Network KPI Scorecard in Excel
This KPI scorecard is ideal for professionals working across telecom operations.
📡 Telecom Network Engineers – Monitor network performance metrics such as latency, downtime, and packet loss.
📊 Operations Managers – Track telecom service quality and ensure KPI targets are achieved.
📈 Data Analysts – Perform telecom performance analysis and generate insightful reports.
👔 Telecom Executives – Review overall network performance and make strategic decisions.
💬 Customer Experience Teams – Monitor service quality indicators that impact customer satisfaction.
By using this scorecard, telecom teams can improve network reliability, reduce service disruptions, and optimize operational performance.
Click here to read the Detailed blog post
Watch the step-by-step video tutorial: